
 Open Access Article
 This Open Access Article is licensed under a
 Creative Commons Attribution 3.0 Unported Licence
One-dimensional Cr-doped NiO nanostructures serving as a highly sensitive gas sensor for trace xylene detection
Changhao Feng *ab,
Xueying Kouc,
Xiaofeng Liaoab,
Yanfeng Sun*c and
Geyu Luc
*ab,
Xueying Kouc,
Xiaofeng Liaoab,
Yanfeng Sun*c and
Geyu Luc
aCollege of Electronic and Information Engineering, Southwest University, Chongqing 400715, China. E-mail: fengchanghao@qq.com
bChongqing Key Laboratory of Nonlinear Circuits and Intelligent Information Processing, Chongqing 400715, China
cState Key Laboratory on Integrated Optoelectronics, College of Electronic Science and Engineering, Jilin University, Changchun 130012, China. E-mail: syf@jlu.edu.cn
First published on 22nd August 2017
Abstract
A highly sensitive xylene sensor based on Cr-doped NiO nanotubes was presented, which was prepared using an electrospinning process. The responses of the sensors were investigated using a static system. We found that the sensors based on the Cr-doped NiO nanotubes exhibited a high response towards 50 ppm xylene, with a response of about 88, which was about 63 times higher than that of pure NiO nanotubes. The results obtained for the sensing properties indicate that the gas sensors based on Cr-doped NiO nanotubes are promising for monitoring air-quality and environmental pollution.
1. Introduction
Xylene is widely used in the field of building, in adhesives, paints, and as an antiseptic.1–4 However, xylene causes great damage to human health, and it was ascribed as the main reason for sick-house syndrome, eye irritation, headache and fatigue.5–7 The occupational safety and health administration (OSHA) suggest the permissible exposure limits for xylene is 100 ppm in an 8 hour period.8 Therefore, detection of xylene is important for personal safety and environmental sustainability. Although some equipment such as gas chromatography-mass spectrometry and fluorescence spectroscopy can be used to measure the concentration of xylene,9,10 these analyses requiring expensive and complex equipment aren't suitable for in situ monitoring. Thus, there is a strong demand for simple and portable xylene sensors with good sensing properties.In recent years, gas sensors based on semiconductors have attracted significant attention for harmful and explosive gas detection.11–14 Nickel oxide (NiO) is a kind of p-type semiconductor, which is widely used in the field of gas sensing.12,15,16 In recent years, some approaches have been studied to enhance the gas sensing performance of NiO.12,17,18 Among these methods, many researchers have confirmed that doping aliovalent metal oxides is a promising approach to improve gas sensing performance19–24 and we have found that NiO nanotubes doped with W can enhance the gas sensing properties towards xylene and methanol, which has a response of about 8.74 to 200 ppm xylene.25 Chromium oxide (Cr2O3) is a kind of p-type semiconductor, which is widely used as a dopant to enhance the response of gas sensors. For example, N. Al-Hardan doped Cr into ZnO films26 and the sensitivity of the sensors towards oxygen was significantly enhanced. B. Lyson-Sypien synthesized Cr doped TiO2 nanopowders using a flame spray method and the response towards H2 was greatly enhanced using this method.27 However, most of the reports are focused on the gas sensing properties of NiO or Cr2O3 and little attention has been given to the xylene-sensing properties of Cr-doped NiO with a 1D nanostructure.
To the best of our knowledge, there have been few reports on the gas sensing properties of Cr-doped NiO one-dimensional nanostructures. So in this work we synthesized Cr-doped NiO nanotubes and their gas sensing characteristics were investigated. These results indicate Cr doped NiO nanotubes with a molar ratio of Cr3+![[thin space (1/6-em)]](https://www.rsc.org/images/entities/char_2009.gif) :Ni2+ = 3:100, show outstanding sensing properties towards xylene. In addition, the effect of Cr doping was investigated and a possible mechanism was proposed.
:Ni2+ = 3:100, show outstanding sensing properties towards xylene. In addition, the effect of Cr doping was investigated and a possible mechanism was proposed.
2. Experimental details
2.1 Preparation of pure and Cr-doped NiO nanofibers
All chemicals were of analytical grade and used without further purification. Chromic nitrate (Cr(NO3)3·9H2O), polyvinyl pyrrolidone (PVP, K90) and N,N-dimethylformamide (DMF) were obtained from Sinopharm-Aldrich, USA. Nickel chloride (NiCl2) and ethanol (C2H5OH) were purchased from Beijing Chemicals, China. The morphology of the samples was investigated using field emission scanning electron microscopy (FE-SEM; JEOL JSM-7500F) and transmission electron microscopy (TEM; JEOL JEM-3010). An X-ray diffractometer (Rigaku TTRIII) was used to analyze the phase and crystallinity of the nanomaterials. Energy-dispersive X-ray spectroscopy (EDS) and selected area electron diffraction (SAED) were performed using a TEM attachment.The pure and Cr-doped NiO nanotubes (the molar ratio of Cr3+ to Ni2+ are 0:100, 1:100, 3:100 and 5:100) were synthesized using an electrospinning process and labeled as S1, S2, S3 and S4, respectively. In a typical synthesis process, 2 mmol of NiCl2 and a certain amount of Cr(NO3)3·9H2O (0.02, 0.06 and 0.1 mmol) were dissolved in 9 mL of DMF and 1 mL of ethanol, and stirred for 1 h at 50 °C. Then, 1 g of PVP was added and stirred at 50 °C, until a viscous precursor solution was completely formed and the precursor solution was placed into the electrospinning installation. The electrospinning installation is described in our previous works;10 the inner diameter of the spinneret was 1.01 mm, the voltage between the spinneret and collector was 10–13 kV and the distance between the spinneret and collector was 10 cm. The flow rate of the precursor solution was fixed at 0.3 mL h−1 using a KD Scientific syringe pump. After the electrospinning experiment, the precursor nanofibers were calcined at 500 °C for 3 h in the air at a heating rate of 1 °C min−1 to completely decompose the PVP.
2.2 Fabrication and measurement of the gas sensor
Fig. 1(a) shows the photographs of the substrate. There are two L golden electrodes on the front-side and a ruthenium oxide (RuO2) micro-heater on the back-side, which were made using a screen printing technique. The micro-heater was connected with Pt wire and the operating temperature was controlled by adjusting the current passing through the micro-heater. Fig. 1(b) shows the photographs of the gas sensor; the Cr-doped NiO nanotubes were mildly pressed on the substrate using a hot press machine (HS-XX40, Hesen Inc., China) at 120 °C for 5 min. By doing this, the sensing materials form a good contact with the electrodes. The temperature was distributed uniformity on the substrate, as shown in Fig. 1(c). The emissivity value of the temperature sensor (T250, FLIR Systems Inc., USA) was fixed at 0.9 and power consumptions of 102.1, 116.9, 129.8, 150.5, 165 and 188.5 mW were used to heat the substrates to 250, 275, 300, 325, 350 and 375 °C, respectively.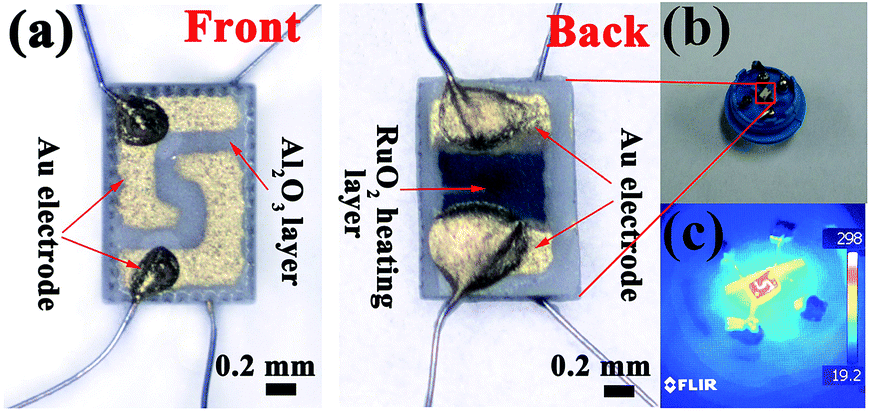 | ||
| Fig. 1 (a) A schematic structure of the alumina substrate. (b) The photographs of the gas sensor. (c) The temperature distribution of the gas sensors. | ||
The gas sensing properties were measured using a static testing system, as shown in Fig. 2. Under the same conditions (relative humidity: 25–35% and temperature: 20–25 °C), the gas sensing properties of the nanotubes were tested. The response of the gas sensor (R) was defined as the ratio of resistance in air (Ra) to that in the tested gas (Rg). The response time was defined as the time required by the sensor to attain 90% of its saturation resistance value after being exposed to the target gas. The recovery time is characterized as the time lag to reach its base-line value (90%) after the target gas was withdrawn.
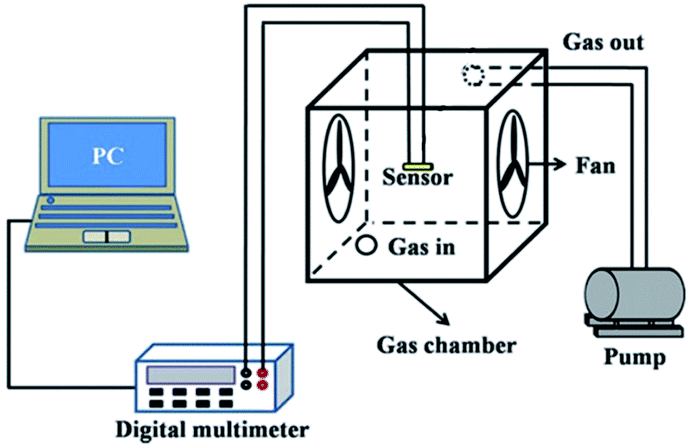 | ||
| Fig. 2 The static gas-sensing characterization system. | ||
3. Results and discussion
3.1 Characterization
Fig. 3 is the SEM images of the pure NiO and Cr-doped NiO nanotubes after calcination. These nanotubes display porous structures, which are beneficial for the diffusion of target gas and may enhance the response of the gas sensor. As shown in the insets of Fig. 3, the nanotubes are composed of many small nanoparticles. In addition, Fig. 3(b)–(d) are the FESEM images of the Cr-doped NiO nanotubes (S2, S3 and S4). When compared to the S1 nanotubes, the morphology of S4 was changed significantly, the S1 nanotubes are porous while the S4 nanotubes become tighter. This is because Cr doping impedes the growth of the nanoparticles, which was also confirmed by the XRD results. What's more, there are some large nanoparticles on the backbones of the nanotubes, when the amount of Cr doping was increased to 5 mol%. We think this may be caused by the mismatch in the NiO lattice. Further study and systematic experiments are needed for a deeper understanding of this.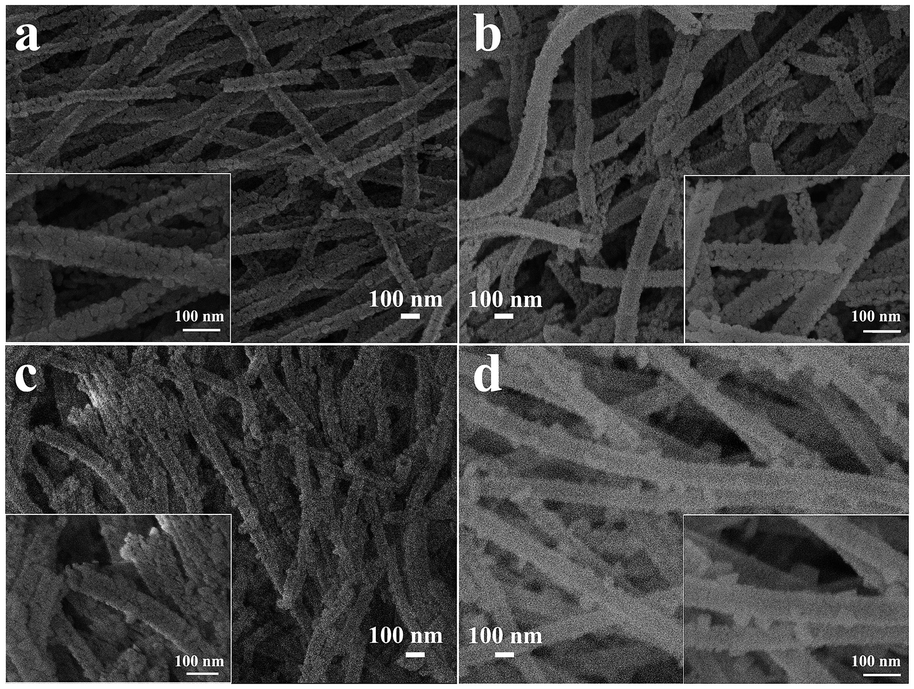 | ||
| Fig. 3 The FESEM images of (a) S1, (b) S2, (c) S3 and (d) S4, the insets are the high-magnification images. | ||
TEM was employed to further study the internal structure of the NiO nanotubes. Fig. 4(a) and (b) are the TEM images of the S4 sample and it obviously confirmed this one-dimensional structure was nanotubes. The inset of Fig. 4(a) is the SAED pattern obtained from the marked circle, which demonstrates the backbones are polycrystalline. Fig. 4(b) shows the HRTEM images and the lattice fringes can be clearly observed and the lattice spacing was 0.209 nm corresponding to the (100) planes of NiO. Fig. 4(c)–(g) are the EDS results, which clearly show the spatial distribution of the elements Ni, Cr and O. As shown in Fig. 4(e), Cr was uniformly distributed in the nanotubes and the peaks for Cr can be clearly seen in Fig. 4(g). Therefore, the EDS results demonstrate that Cr can enter the NiO lattice using this method.
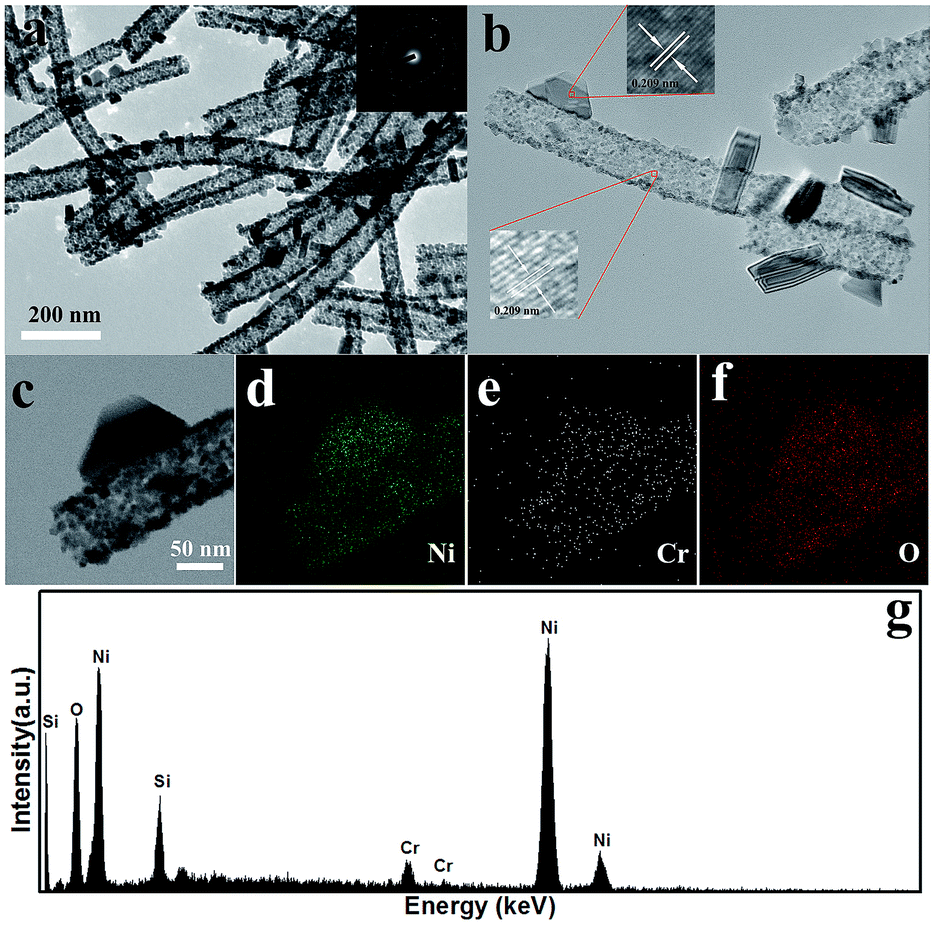 | ||
| Fig. 4 (a) The TEM images of the S4 nanotubes. The insets are the selected area electron diffraction (SAED) patterns and (b) is the TEM image. The inset is the HRTEM of the selected areas. (c)–(f) The EDS elemental maps and (g) spots pattern of Cr, Ni and O. | ||
Fig. 5 presents the XRD patterns of the S1, S2, S3 and S4 nanotubes. As Fig. 5(a) shows, the diffraction peaks can be readily indexed to a cubic NiO phase, which is in a good agreement with JCPDS: 47-1049. Because the doping amount is small, there are no phases corresponding to the chromic compound observed in the XRD patterns. The diffraction peaks of nanotubes S1 to S4 become broader upon increasing the amount of Cr, which demonstrates that the grain size of the samples decreases. The average crystal size of S1, S2, S3 and S4 were calculated using the Debye–Scherrer formula. The average crystal sizes of S1, S2, S3 and S4 are about 19.6 nm, 16.0 nm, 12.9 nm and 12.0 nm, respectively. What's more, as the radius of Cr3+ and Ni2+ are 0.0615 nm and 0.069 nm at a coordination number (CN) of 6, the diffraction peaks shift to the right as the Cr doping amount increased. There is a 0.06° right shift in the (1 1 1) and (2 0 0) diffraction peaks of the S4 nanotubes when compared with S1, as shown in Fig. 5(b). The results indicate that Cr3+ can enter the NiO lattice easily.
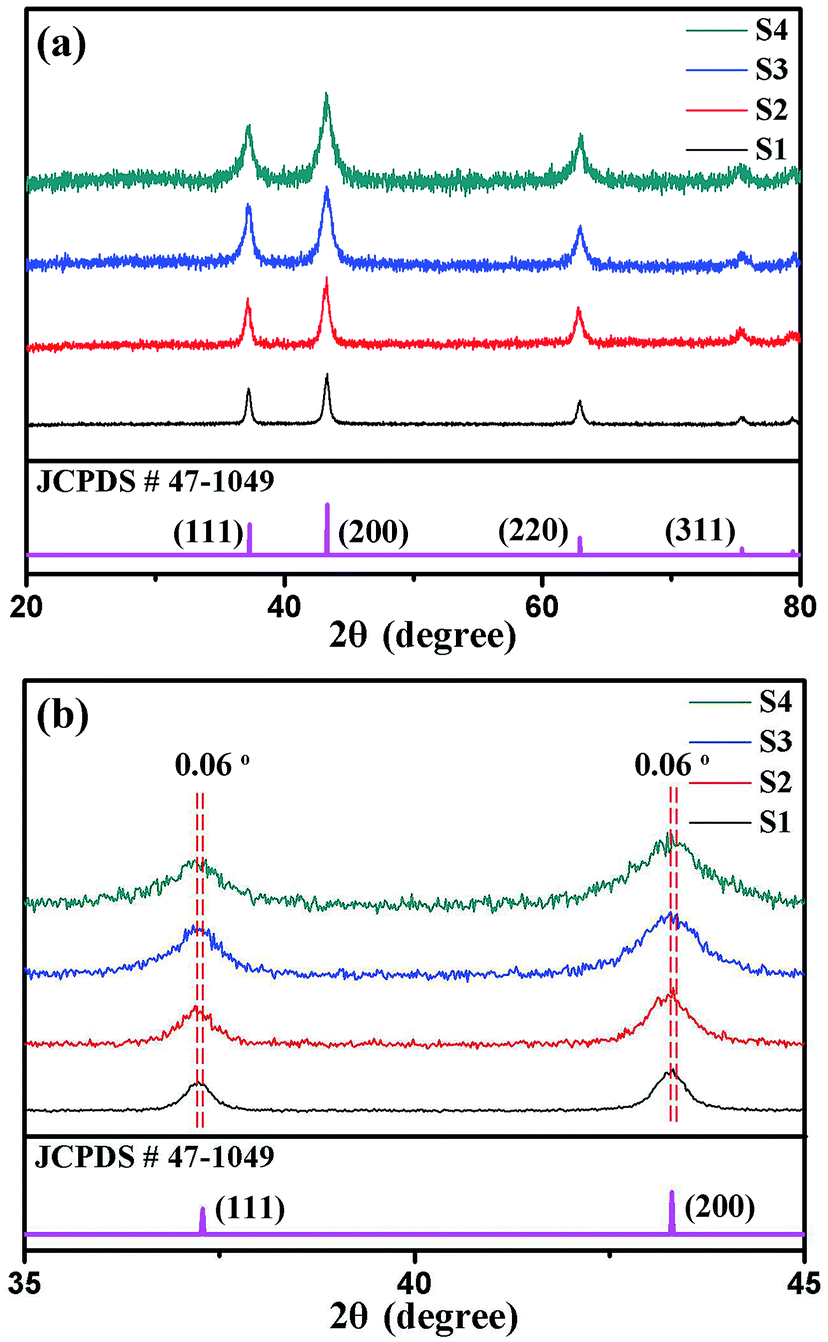 | ||
| Fig. 5 (a) The XRD patterns of Cr–NiO nanotubes with different molar ratios. (b) A comparison of the (111) and (200) peaks obtained from the XRD patterns. | ||
3.2 Xylene sensing properties
Gas sensors based on the Cr-doped NiO nanotubes were fabricated and a series of gas sensing measurements were carried out. In order to determine the optimum operating temperatures of the sensors, the responses to 50 ppm xylene were tested as a function of the operating temperature, as shown in Fig. 6(a). It clearly shows that the responses of the sensors to xylene varied with temperature and exhibited an ‘increase-maximum-decrease’ tendency. For sensor S3, there is not enough energy to make the oxygen species effectively react with the xylene vapor at low temperature. At 325 °C, all the oxygen species have the required energy to react with the target gas, so both the higher reaction activity and the conversion of the surface absorbed oxygen species (O2(gas) → O2(ads) → O2− → 2O−) contributed to the higher response. However, when the temperature was above 325 °C, the response reduced because of the amount of adsorbed gas molecules was insufficient to react with the oxygen species. Therefore, 325 °C was selected as the operating temperature of sensor S3 in following gas testing process. Similar behavior can be observed in the case of sensors S1, S2 and S4. However, their maximal responses appeared at different temperatures, sensor S1 has a maximum gas response at 325 °C, while sensors S2 and S4 have maximum gas responses at 300 °C and 350 °C, respectively. What's more, sensor S3 shows the highest response towards 50 ppm xylene with a maximum response of 88, which is about 63 times higher than sensor S1. As shown in Fig. 6(b), the resistance in air (Ra) was increased as the doping amount increased and the Ra of S1, S2, S3 and S4 are 5.1, 9.3, 29.1 and 70.2 kΩ, respectively, at 325 °C.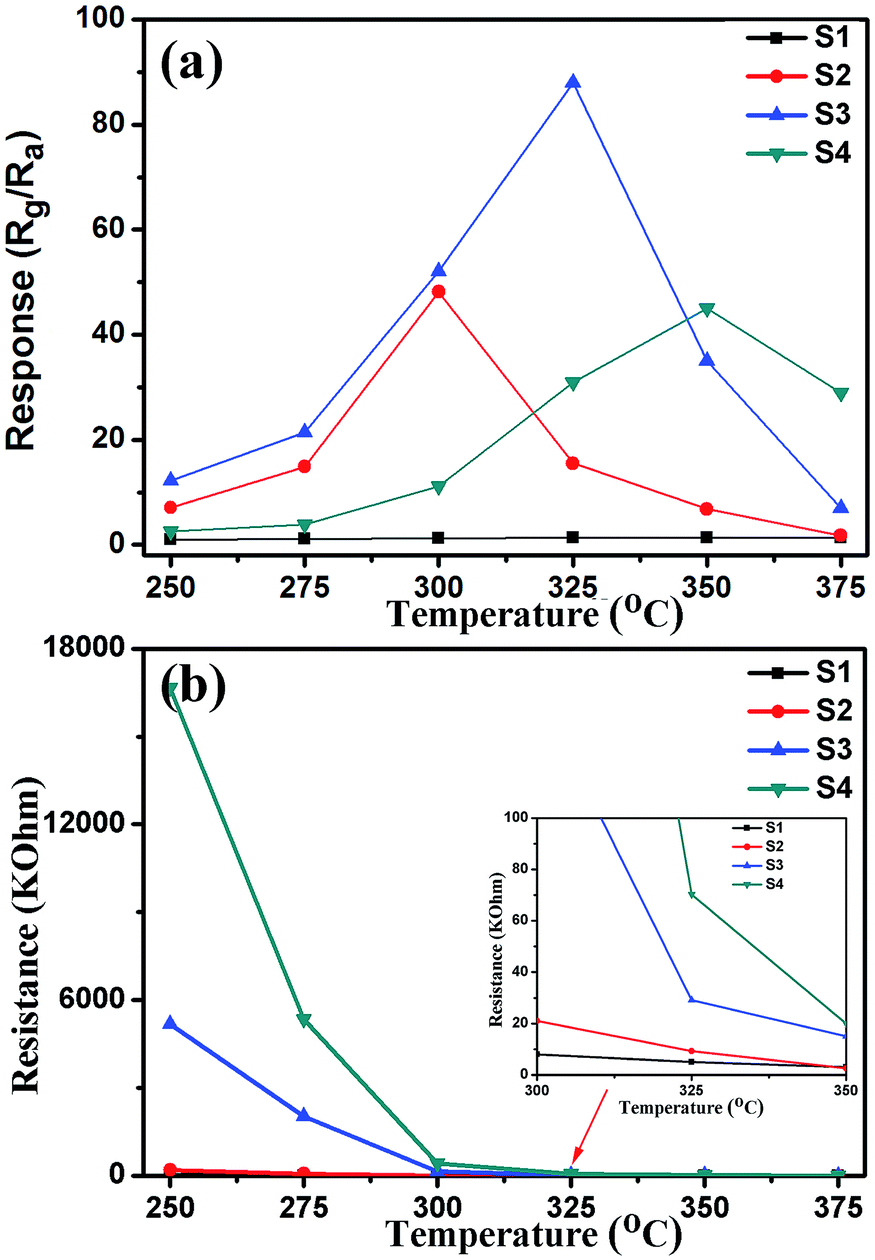 | ||
| Fig. 6 (a) The response of nanotubes S1, S2, S3 and S4 to 50 ppm xylene as a function of the operating temperature. (b) The resistance of the samples in air as a function of the operating temperature. | ||
Fig. 7(a) is the dynamic characteristics of the S3 sensor to 200 ppm xylene; the response and recovery time are ∼144 s and 50 s, rspectivley. There are four reversible response curves in the inset of Fig. 7(a). These results indicate the gas sensors based on Cr doped NiO displayed a fast response, recovery and good repeatability. Fig. 7(b) reveals the response as a function of the xylene concentration. The concentration of xylene was varied from 5 to 500 ppm and the responses of sensors S1 and S3 both increased upon increasing the xylene concentration and the response of the S3 sensor was obviously higher than S1. For sensors S3, the response was 1219 for 500 ppm xylene and the detection limit was 5 ppm with a response of 1.42. While the response of sensor S1 to 500 ppm xylene was 3.11 and the detection limit was 100 ppm with a response of 1.71. Evidently, doping with Cr can effectively enhance the response towards xylene.
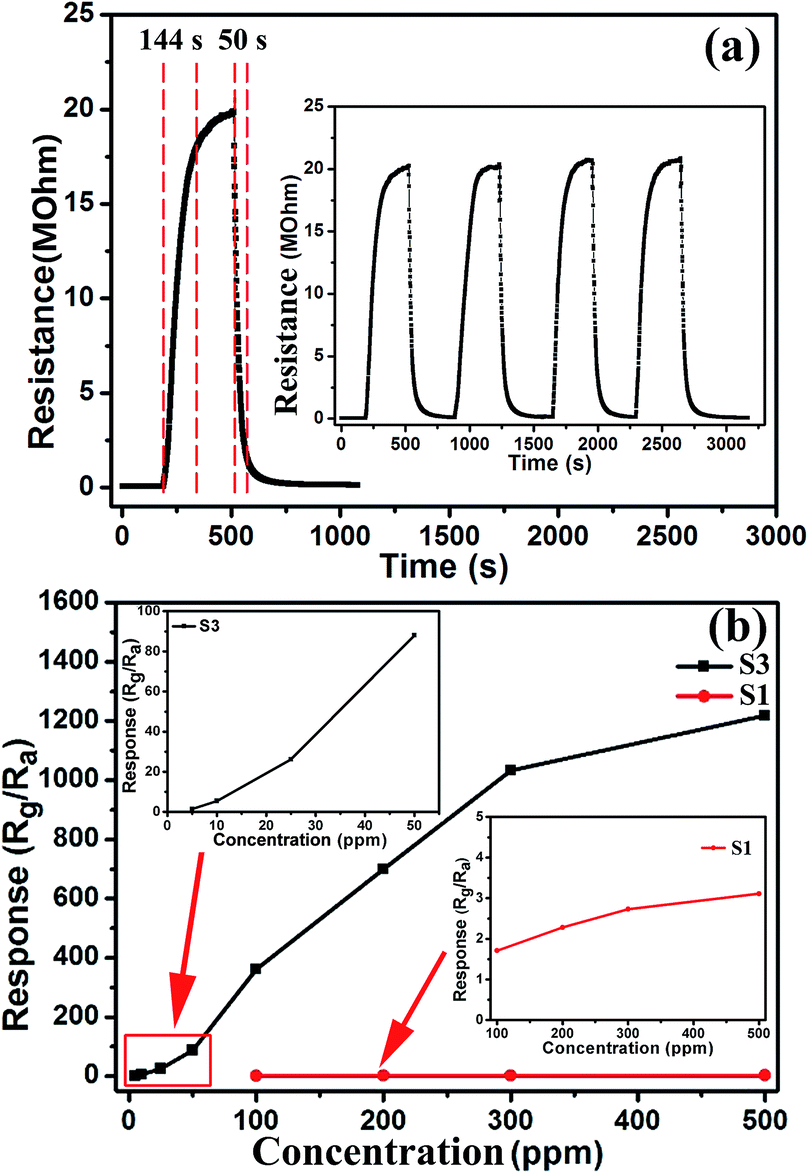 | ||
| Fig. 7 (a) The response of the S3 nanotubes towards 200 ppm xylene. The inset displays four periods of the response curve. (b) The response of nanotubes S1 and S3 towards xylene at different concentrations; the inset on the left is the response of the S3 nanotubes towards xylene at concentrations between 5–50 ppm. The inset on the right is the response of the S1 nanotubes towards xylene at concentrations between 100–500 ppm. | ||
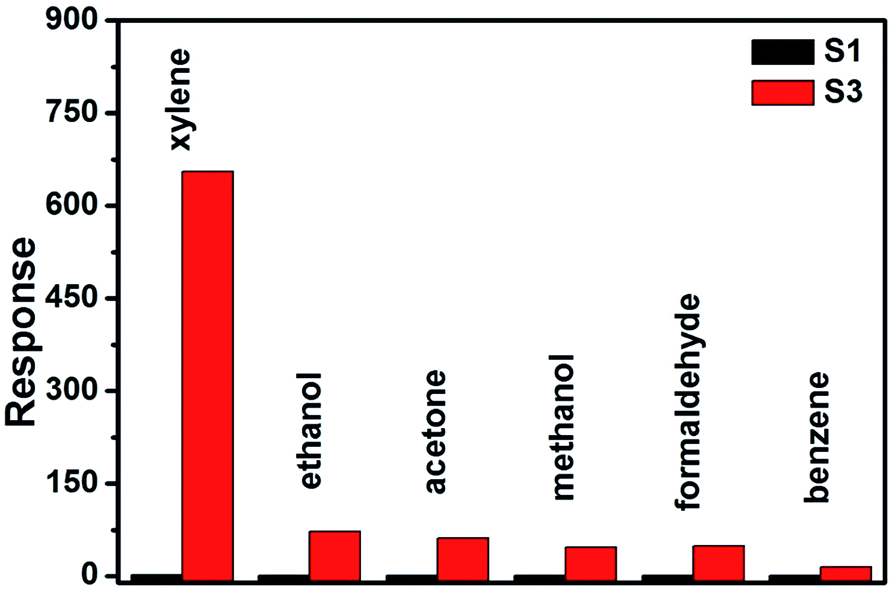
Fig. 8 shows the selectivity of sensors S1 and S3, which were evaluated by exposing to six kinds of gases with a concentration of 200 ppm at 325 °C, including xylene, ethanol, acetone, methanol, formaldehyde and benzene. It can be seen that sensor S3 displayed an ultra-enhanced response to most of the test gases when compared with sensor S1. In addition, the response towards xylene was remarkably higher than the other gases with a response of 656, while the responses to ethanol, acetone, methanol, formaldehyde and benzene were much lower. Therefore, it was revealed that the Cr-doped NiO nanotubes showed an excellent selectivity towards xylene.
 | ||
| Fig. 8 A comparison of the response of nanotubes S1 and S3 towards different gases at 200 ppm. | ||
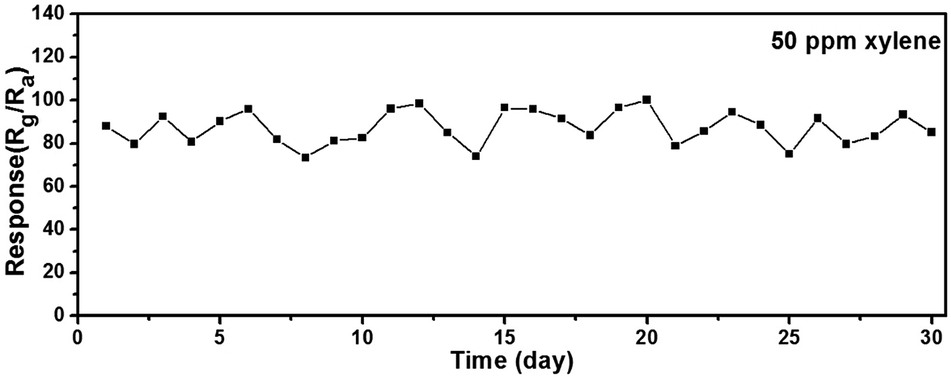
The long-term stability is a crucial parameter for evaluating the gas sensing performance in practical applications. The response as a function of the number of testing days was measured and shown in Fig. 9. The responses of sensor S3 to 50 ppm xylene were tested under the same temperature and humidity conditions over 30 days. Even though the response changed every day, we can see that the response values are floating around 88, which shows its good stability.
 | ||
| Fig. 9 The long-term stability of sensor S3 at 325 °C. | ||
A widely accepted sensing mechanism for this type of gas sensor is based on the resistance changes during the adsorption and desorption processes.2 When the pure NiO nanotubes or Cr-doped NiO nanotubes are exposed to an air atmosphere, the adsorbed oxygen molecules will ionize and attract holes to the surfaces and the hole accumulation layer (HAL) will lead become thick, which will result in a decrease in the resistance. On exposure to the reducing gas, such as xylene, the testing gases will be oxidized by the ionized oxygen and release electrons,10 which will decrease the concentration of holes and the HAL will become thinner and the resistance will increase. What's more, the highly enhanced gas sensing properties of the Cr-doped NiO nanotubes are likely to be explained as follows. According to previous research by Hyo-Joong Kim,11 the response of p-type semiconductors can be written as follows:
 | (1) |
4. Conclusions
In summary, a series of Cr doped-NiO nanotubes have been synthesized via a simple and facile technique, and their gas sensing properties were investigated. The gas sensors based on the S3 nanotubes demonstrated good selectivity, repeatability and long term stability at 325 °C. The method of modulating the concentration of hole provides a new and promising strategy to design high performance xylene sensors. The good xylene sensing characteristics indicate that the presented sensors based on Cr-doped NiO nanotubes are promising for xylene sensing and can used for air-quality and environmental monitoring.Conflicts of interest
There are no conflicts to declare.Acknowledgements
This work is supported by the Fundamental Research Funds for the Central Universities (Grant No. XDJK2017C074, SWU116059 and SWU116013), China Postdoctoral Science Foundation (Grant No. 2016M602631 and 2017M610583) and National Nature Science Foundation of China (Grant No. 61134010, 61304242, 61703348, 61327804, 61377058 and 61374218).Notes and references
- J. Hue, M. Dupoy, T. Bordy, R. Rousier, S. Vignoud, B. Schaerer, T. H. Tran-Thi, C. Rivron, L. Mugherli and P. Karpe, Sens. Actuators, B, 2013, 189, 194–198 CrossRef CAS
.
- J. H. Lee, Sens. Actuators, B, 2009, 140, 319–336 CrossRef CAS
- A. K. Srivastava, Sens. Actuators, B, 2003, 96, 24–37 CrossRef CAS
- Y. S. Kim, S. C. Ha, H. Yang and Y. T. Kim, Sens. Actuators, B, 2007, 122, 211–218 CrossRef CAS
- Y. Li, Y. Cao, D. Jia, Y. Wang and J. Xie, Sens. Actuators, B, 2014, 198, 360–365 CrossRef CAS
- Y. Cao, P. Hu, W. Pan, Y. Huang and D. Jia, Sens. Actuators, B, 2008, 134, 462–466 CrossRef CAS
- K. Niaz, H. Bahadar, F. Maqbool and M. Abdollahi, EXCLI J., 2015, 14, 1167–1186 Search PubMed
- H. J. Kim, J. W. Yoon, K. I. Choi, H. W. Jang, A. Umarcd and J. H. Lee, Nanoscale, 2013, 5, 7066–7073 RSC
- K. W. Kao, M. C. Hsu, Y. H. Chang, S. Gwo and J. A. Yeh, Sensors, 2012, 12, 7157–7168 CrossRef CAS PubMed
- C. Feng, X. Li, C. Wang, Y. Sun and G. Lu, RSC Adv., 2014, 4, 47549–47555 RSC
- H. Kim, K. Choi, K. Kim, C. W. Na and J. H. Lee, Sens. Actuators, B, 2012, 171–172, 1029–1037 CrossRef CAS
- P. Rai, J. Yoon, H. Jeong, S. Hwang, C. Kwaka and J. H. Lee, Nanoscale, 2014, 6, 8292–8299 RSC
- N. Yamazoe, G. Sakai and K. Shimanoe, Catal. Surv. Asia, 2003, 7, 63–75 CrossRef CAS
- J. Tamaki, Sens. Lett., 2005, 3, 89–98 CrossRef CAS
- J. A. Dirksen, K. Duval and T. A. Ring, Sens. Actuators, B, 2001, 80, 106–115 CrossRef CAS
- P. V. Tong, N. D. Hoa, N. V. Duy, V. V. Quang, N. T. Lam and N. V. Hieu, Int. J. Hydrogen Energy, 2013, 38, 12090–12100 CrossRef CAS
- R. K. Jamal, K. A. Aadim, Q. G. Al-Zaidi and I. N. Taaban, Photonic Sens., 2015, 5, 235–240 CrossRef CAS
- Y. Liu, G. Li, R. Mi, C. Deng and P. Gao, Sens. Actuators, B, 2014, 191, 537–544 CrossRef CAS
- Y. Zhang and W. Zeng, Mater. Lett., 2017, 195, 217 CrossRef CAS
- M. Tonezzer, T. T. L. Dang, Q. H. Tran, V. H. Nguyen and S. Iannotta, Int. J. Hydrogen Energy, 2017, 42, 740 CrossRef CAS
- M. K. Khalaf, R. H. Mutlak, A. I. Khudiar and Q. G. Hial, Phys. B, 2017, 514, 78 CrossRef CAS
- U. Cindemir, M. Trawka, J. Smulko, C. Granqvist, L. Österlund and G. A. Niklasson, Sens. Actuators, B, 2017, 242, 132 CrossRef CAS
- Y. Lu, Y. H. Ma, S. Y. Ma, W. X. Jin, S. H. Yan, X. L. Xu and Q. Chen, Mater. Lett., 2017, 190, 252 CrossRef CAS
- M. Tonezzer, T. T. L. Dang, Q. H. Tran and S. Iannotta, Sens. Actuators, B, 2016, 236, 1011 CrossRef CAS
- C. Feng, X. Li, J. Ma, Y. Sun, C. Wang, P. Sun, J. Zheng and G. Lu, Sens. Actuators, B, 2015, 209, 622–629 CrossRef CAS
- N. Al-Hardan, M. J. Abdullah, A. Abdul Aziz and H. Ahmad, Appl. Surf. Sci., 2010, 11, 3468–3471 CrossRef
- B. Lyson-Sypien, A. Czapla, M. Lubecka, P. Gwizdz and K. Schneider, Sens. Actuators, B, 2012, 175, 163–172 CrossRef CAS
| This journal is © The Royal Society of Chemistry 2017 |