 Open Access Article
Effects of epoxy resin on ground-granulated blast furnace slag stabilized marine sediments†
Jiapei Du ,
Yuhuan Bu*,
Shenglai Guo,
Leiju Tian and
Zhonghou Shen
College of Petroleum Engineering, China University of Petroleum, 266580 Qingdao, China. E-mail: buyuhuan@163.com
First published on 21st July 2017
Abstract
In this study, an environmentally friendly epoxy resin is mixed with ground-granulated blast furnace slag (GGBS) for use as a stabilizer to enhance mechanical performance and leaching resistance properties of marine sediments. Investigations of unconfined compressive strength, Young's modulus, hydraulic conductivity and leaching behavior tests were performed on stabilized samples in order to understand the effects of hybrid stabilizer on sediment properties. In addition, XRD, SEM, EDX and moisture content analyses were conducted to illustrate the leaching controlled mechanism of the resin. Test results show that the mechanical performance is sensitive to the dosage of resin. The stabilized sediment sample with 5% of resin gave the best strength as well as excellent Young's modulus. Furthermore, the leaching controlled effect of the resin led to the stabilization of hazardous elements. The maximum content of As, Cd, V and Cr leached from the stabilized samples was much lower than the respective contamination limits of EP PART 503. The core–shell structure and chain-like framework which formed in the stabilized sediment system after the addition of resin could control the connection between the water environment and inorganic soluble minerals effectively. This investigation provides further beneficial uses of alkali-activated GGBS materials in the field of geotechnical engineering.
1 Introduction
The operation of dredging generates large quantities of marine sediments from the bottom of rivers, lakes and estuaries every year in China. The helpful use of dredged sediments in road construction is one of the primary opportunities considered by Chinese harbor managers. The road construction sector consumes plenty of natural materials and their natural mineral resources are being depleted due to the increasingly difficult to develop new quarries. Thus, the use and the recycling of marine dredged sediments for road construction purposes are useful methods for saving natural resources.1 The marine dredged sediments are usually utilized in the foundation and base layer which has to bear important stresses attribute to traffic loading.2,3 Road construction demands the sediments with high mechanical characteristics, such as, compressibility, strength and permeability.4 However, these marine sediments cannot utilize directly as road construction materials without treatment due to weak strength and high water content.5–7 Stabilization treatment can be used to enhance the environmental and mechanical properties of marine sediments utilizing lime, cement and other hydraulic binders.8–10 Among various industrial waste materials, ground-granulated blast furnace slag (GGBS) is widely used in road construction, since their chemical and physical properties are similar, or even superior to traditional Portland cement.11–13 However, environmental concerns about using of GGBS as soil stabilizer concentrated on the leachable quantities of hazardous elements, where chromium (Cr), barium (Ba), vanadium (V), molybdenum (Mo) have gained attention because of their toxicity on the environment and humans.14,15 In many conditions, roads are at least partially environmentally open system. Therefore, GGBS is percolated by surface runoff water and rainwater.16 After encounter with water, the surface compositions of GGBS become active, including the hazardous elements. In previous studies, many investigations have suggested some mineral phases, which obtained from GGBS hydration under alkaline condition, can control the release of solubility elements. Loncnar et al. indicated that Ca(OH)2 and calcium silicate hydrate (CSH) are the main solubility-controlling minerals.14 Huijgen et al. indicated that ettringite and portlandite can immobilize Ca2+ from fresh BOF slags.17 Baciocchi et al. suggested that CSH is a solubility controlling phase of Si leaching.18 The leaching of Cr, Ba, V and Mo are most likely controlled by their substitution as a solid solution in ettringite and CSH.19–21 Therefore, the controlling of solubility elements especially toxicity elements should start with the immobilization of cementitious mineral phases.For the stabilization of marine sediments with GGBS, the high water content of marine sediments becomes the most serious issue due to water is one of the strong decalcifying agents for cementitious phases.22 During leaching process, Ca2+ and OH− in pore solution of cementitious phases migrate into environment water because of the concentration gradients between environment water and pore water. This phenomenon reduces the alkalinity of pore water and causes dissolution of hydration products.23 For pure cementitious mineral phases, the decomposition of hydration product might occur after a very long time,24 but for cementitious mineral phases stabilized marine sediments, this process will be fast due to the high porosity, more micro-cracks and low content of stabilizers, which allow more environment water contact with the cementitious mineral phases. Thus, the priority task to prevent the leaching of cementitious phases is to improve water resistance property of GGBS stabilized marine sediments.
Partial substitution of GGBS with traditional inorganic cementitious materials is widely investigated to enhance the mechanical performance of stabilized soil samples. Keramatikerman et al. investigated the effect of GGBS and lime binder on the engineering properties of clay at different curing periods. In their study, a mixture of GGBS and lime mixed with clay showed a significantly higher compressive strength for all curing age.25 Yi et al. studied the stabilization of alkali-activated GGBS for marine soft clay. The effect of activators, including NaCO3, NaOH, carbide slag (CS) and Na2SO4, on the stabilization efficacy was investigated. Na2SO4–CS–GGBS was found to show the best unconfined compressive strength for the marine soft clay.26 Mozumder and Lasker indicated GGBS–fly ash based geopolymer soil stabilizer shows much higher strength than GGBS based geopolymer soil stabilizer.27 So in previous study of other researchers, the efforts which made to improve the utilization of GGBS as soil stabilizer were focused on the compressive strength enhancement of stabilized soil samples. However, the water resistance property of GGBS based soil stabilizer, which relates to the leaching of cementitious mineral phases, was barely referred by other researches.
Traditional inorganic cementitious materials tend to dissolve when immersed in water due to the plenty of solubility ions in the inorganic phases. But some organic epoxy composites, they show excellent penetration resistance properties in moist environment.28 Ferone et al. indicated that inorganic–organic hybrid materials by a method based on co-reticulation of geopolymer and epoxy resin present significantly enhanced compressive strength and a homogeneous dispersion.29 In our recently studies, we found that metakaolin–GGBS based inorganic material had good compatibility with epoxy resin and the mechanical properties were improved remarkably by doping resin.30 Nevertheless, the environmental concern of using epoxy resin is that the chemicals (epoxy chloropropane and amine curing agents) in resins can influence the health of human when they come into contact with skin. Completely cured epoxy resins are almost nontoxic. But the curing agents, such as aliphatic amines, are usually toxic liquids with unpleasant, strong odors. They may cause birth defects and be causing agents in test animals. It is found that polyamide or cyclic amines are less hazardous than aliphatic amines.31 As chitosan bears alcohol and amine functions, it can perform polyaddition reactions with epoxy resins.32 Meanwhile, it is the second richest natural polysaccharide.33 Thus, in this paper, the amphiphilic biopolymer chitosan was used as a curing agent in a novel epoxy–slag system for use in environmental-friendly marine sediments stabilization in order to minimize health effects of hazardous elements and traditional epoxy resin chemicals. The effects of environmental friendly epoxy/chitosan system on the mechanical properties and leaching behavior of GGBS stabilized marine sediments were investigated. The leaching controlled mechanism of epoxy resin in stabilized samples was detailed illustrated by scanning electron microscopy (SEM), energy dispersive X-ray spectroscopy (EDX) and moisture content analyses.
2 Materials and method
2.1 Materials
Marine sediments utilized in this research were collected from Tangdao bay in Qingdao, China. Particle size analysis was performed on this sediment by the standard methods of ASTM D2487 and D698.34,35 The result of particle analysis is shown in ESI.† About 70% of the sediments are finer than 0.2 mm, so the major components in this sediment are fine sand and clay. The plastic limit is 27% and liquid limit is 58.5%, determined by the thread-rolling test and Casagrande cup test, respectively. The sediment mineral consists mainly of quartz, kaolinite, illite and smectite which evaluated by the X-ray diffraction (XRD) and energy dispersive X-ray spectroscopy (EDX). The water content of this sediment is 49.6%. GGBS was provided by Jiaozuo Yukun Mining Corporation, China. The chemical composition and physical properties of GGBS are presented in Table 1. Sodium hydroxide was obtained from Sinopharm Chemical Reagent Co., Ltd. Modified Bisphenol A epoxy resin (MBA) and chitosan was obtained from Shanghai coating corporation, China. The comparison of basic properties of MBA and Bisphenol A epoxy resin (BA) is shown in Table 2.| Oxides | OPC (wt%) | GGBS (wt%) |
|---|---|---|
| CaO | 64.20 | 36.57 |
| SiO2 | 19.40 | 28.30 |
| Fe2O3 | 5.50 | 0.83 |
| Al2O3 | 4.50 | 13.16 |
| SO3 | 2.80 | 1.65 |
| MgO | 2.00 | 7.58 |
| Na2O | 0.10 | 0.49 |
| K2O | 0.60 | 0.50 |
| Loss on ignition | 1.20 | 9.65 |
| Density (g cm−3) | 3.15 | 3.01 |
| Specific surface area (m2 kg−1) | 336.00 | 420.00 |
| Properties | MBA | BA |
|---|---|---|
| a Volatile organic compound.b Setting time at 15 °C.c At 15 °C for 24 h curing. | ||
| Epoxide equivalent (g per eq.) | 185–190 | 185–210 |
| Density (g cm−3) | 1.25 | 1.16 |
| VOCa content (g L−1) | 0 | 10 |
| Setting timeb (min) | 110 | 50 |
| Strength of solidifiedc (MPa) | 30 | 24 |
Optimum ratio (epoxy![[thin space (1/6-em)]](https://www.rsc.org/images/entities/char_2009.gif) : :![[thin space (1/6-em)]](https://www.rsc.org/images/entities/char_2009.gif) hardener) hardener) |
1![[thin space (1/6-em)]](https://www.rsc.org/images/entities/char_2009.gif) : :![[thin space (1/6-em)]](https://www.rsc.org/images/entities/char_2009.gif) 1.2 1.2 |
1![[thin space (1/6-em)]](https://www.rsc.org/images/entities/char_2009.gif) : :![[thin space (1/6-em)]](https://www.rsc.org/images/entities/char_2009.gif) 2 2 |
2.2 Methods
![[thin space (1/6-em)]](https://www.rsc.org/images/entities/char_2009.gif) :
:![[thin space (1/6-em)]](https://www.rsc.org/images/entities/char_2009.gif) activator (sodium hydroxide)
activator (sodium hydroxide)![[thin space (1/6-em)]](https://www.rsc.org/images/entities/char_2009.gif) :
:![[thin space (1/6-em)]](https://www.rsc.org/images/entities/char_2009.gif) water = 1
water = 1![[thin space (1/6-em)]](https://www.rsc.org/images/entities/char_2009.gif) :
:![[thin space (1/6-em)]](https://www.rsc.org/images/entities/char_2009.gif) 0.1
0.1![[thin space (1/6-em)]](https://www.rsc.org/images/entities/char_2009.gif) :
:![[thin space (1/6-em)]](https://www.rsc.org/images/entities/char_2009.gif) 0.6. Sodium hydroxide is a granule that must dissolve in water. The mix proportion of MBA and chitosan is 1
0.6. Sodium hydroxide is a granule that must dissolve in water. The mix proportion of MBA and chitosan is 1![[thin space (1/6-em)]](https://www.rsc.org/images/entities/char_2009.gif) :
:![[thin space (1/6-em)]](https://www.rsc.org/images/entities/char_2009.gif) 1.2. A constant speed blender was used to make sure the solution homogeneously. Sodium hydroxide was added into the blender after which the blender was started on a rotation speed of 2000 rpm. While the blender was running, the GGBS was gradually added to sodium hydroxide solution. The chitosan was added into the MBA and then stirred for 5 min to be homogeneously mixed. Subsequently, the aqueous solution of alkali–GGBS was put into the resin mixed liquor and stirred for 5 min with a stirring rate of 4000 rpm to achieve complete reaction. The defoamer was utilized to remove air bubbles. The defoamer used in this study is polyether modified silicon which amount is 0.2–0.6% by weight of GGBS.
1.2. A constant speed blender was used to make sure the solution homogeneously. Sodium hydroxide was added into the blender after which the blender was started on a rotation speed of 2000 rpm. While the blender was running, the GGBS was gradually added to sodium hydroxide solution. The chitosan was added into the MBA and then stirred for 5 min to be homogeneously mixed. Subsequently, the aqueous solution of alkali–GGBS was put into the resin mixed liquor and stirred for 5 min with a stirring rate of 4000 rpm to achieve complete reaction. The defoamer was utilized to remove air bubbles. The defoamer used in this study is polyether modified silicon which amount is 0.2–0.6% by weight of GGBS.| Samples | Geopolymer (wt%) | Resin (wt%) | OPC (wt%) | W/S |
|---|---|---|---|---|
| OPC (control 1) | 0 | 0 | 100 | 0.6 |
| GR0 (control 2) | 100 | 0 | 0 | 0.6 |
| GR5 | 95 | 5 | 0 | 0.6 |
| GR10 | 90 | 10 | 0 | 0.6 |
| GR20 | 80 | 20 | 0 | 0.6 |
| GR30 | 70 | 30 | 0 | 0.6 |
| GR40 | 60 | 40 | 0 | 0.6 |
Young's modulus of each specimen was derived from the slope of the stress–stain curve. Based on ASTM E-111,36 the chord modulus or tangent modulus of the stress–stain curve from UCS testing can be utilized as the estimate of Young's modulus.
 | (1) |
The determination method of the content of chemical bonding water is as follows: firstly, the investigated samples were heated to 105 ± 2 °C to remove free water. And then, the temperature was raised to 1050 ± 2 °C. Finally, the weight loss of investigated samples from 105 °C to 1050 °C is the content of chemical bonding water.
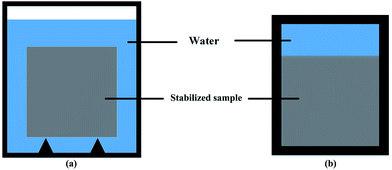 | ||
| Fig. 1 Leaching test vessel: (a) all surface area leaching test vessel; (b) one surface leaching test vessel. | ||
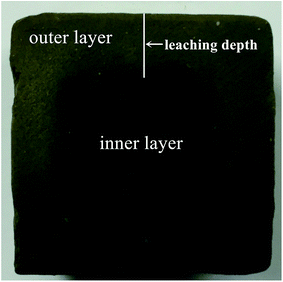
For one surface leaching test, a specific vessel was made, as shown in Fig. 1b. The sediment–stabilizer composite slurries were poured in the lower part of the vessel. 200 mL deionized water (L/S = 80 L m−2) was poured in the upper part at an age of 48 h. The vessel was sealed and put into a water bath which temperature was kept at 15 ± 2 °C. The water in the specific vessel was changed after 3 d, 7 d, 14 d, 21 d, 28 d and 56 d. The test samples were cut from the middle into two pieces by rock cutting machine to observe the leaching depth of stabilized samples (Fig. 2). Due to cementitious leaching, the outer area of stabilized sample displayed light color while the inner area showed dark color. According to XRD test results, the CSH content of outer area is lower than the inner area. Thus, we defined the leaching depth as the maximum length of outer areas.
Hazardous element tests are based on EPA method 1311.39 The leachate of stabilized sample after all surface area leaching test was collected and pressure extracted by a 0.45 μm filter paper, and the concentration of As, Cr, Cd, V, Fe and Cu in collected leachate was determined by atomic absorption spectroscopy (AA) test.
To determine the microstructural change of stabilized samples and reveal the leaching controlled mechanisms, SEM images were performed on GR0, GR5 and GR40 samples in a scanning electron microscope ZEISS-SUPRA55. After the compressive strength tests, small pieces of the crushed stabilized sediment samples were selected for SEM tests. The internal surfaces of the cube samples, which were not exposed to air and cannot be carbonated, were picked for microstructure evaluation. Ion beam milling was used to obtain the best possible surface for high resolution observation. The EDX spectra were collected within the selected areas of SEM for the sake of examine the composition of special structures in stabilized samples.
3 Results and discussion
3.1 Mechanical properties of hybrid stabilizer stabilized samples
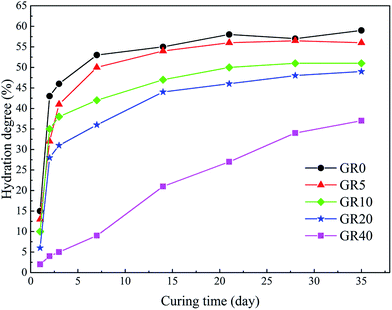
The UCS values and Young's modulus of all the stabilized samples after curing for 3, 7 and 28 days are shown in Fig. 3. The dosage of stabilizer is 20% by weight of sediments. The UCS of OPC and GR0 stabilized samples did not display further development after 7 days, its 28 day UCS showed a significant decrease due to cementitious mineral phases leaching. As expected, the UCS values of all GGBS stabilized samples were much higher than the OPC counterpart except GR40 sample. For GR5, GR10, GR20 and GR30, the strength increased with curing time. However, the UCS values decreased with the resin concentrations ranging from 5% to 40%. Among them, stabilized sample with 5% of resin gave the best strength of 7.7 MPa. This phenomenon can be explained by the degree of hydration test, as we can see in Fig. 4. The influence of 5% of resin on the hydration of GGBS is very slightly. For GR10, GR20, GR30 and GR40, the excessive epoxy resin prevented the GGBS from further hydration. The hydration of GGBS plays a leading role in the strength development of hybrid stabilizers. The more dosage of epoxy resin mixed with GGBS, the more serious of its influence on degree of hydration. Note that when the dosage of resin is 40%, the hydration of GGBS is slower than any other samples. This is the reason why GR40 sample did not show strength development in first 7 days but achieved 4 MPa after 28 days curing.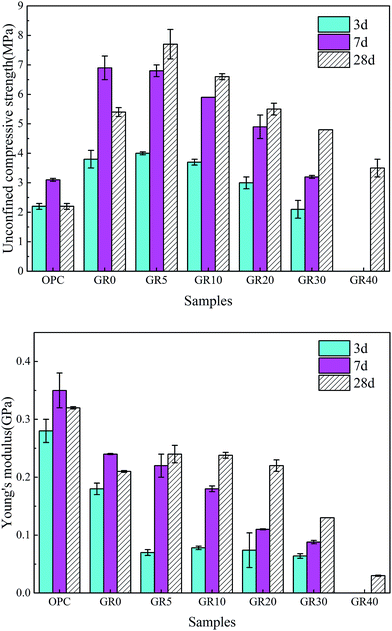 | ||
| Fig. 3 Changes in UCS and Young's modulus of OPC and hybrid stabilizer stabilized samples. These samples were cured in deionized water and performed UCS and Young's modulus tests at 3, 7 and 28 days. | ||
As for Young's modulus, the 3 day Young's moduli of GR5, GR10, GR20 and GR30 samples is similar, which are much lower than that of OPC and GR0 stabilized samples. This might be caused by two reasons: on the one hand, epoxy resin could counteract part of the load by plastic deformation; on the other hand, it could perform a toughening effect according to a typical crack skewing mechanism.29 After 7 days curing, the Young's modulus of GGBS stabilized samples decreased with the epoxy resin concentrations ranging from 5–40%. This result can be explained by Fig. 4, the excessive epoxy resin slowed down the hydration process of hybrid stabilizers. Low degree of hydration means that GGBS hydration product which generated in the sediment matrix after 7 day-curing is insufficient to form an effective microstructure to resistant deformation. The OPC stabilized sample shows low stiffness and it is brittle, thanks to the presence of resin, the hybrid stabilizer stabilized samples become tenacious. The influence of curing time on Young's modulus is illustrated well by Fig. 3, when the curing time is longer than 3 days, the degree of hydration become very fast (Fig. 4). There are enough GGBS hydration products, which generated in the sediment matrix, to form a more deformation resistant microstructure that led to a high Young's modulus.
Fig. 5 shows the UCS development of stabilized samples after soaking in deionized water. The differences in content of the hybrid stabilizer induced great influence on the 3 day strength. If the additive content of hybrid stabilizer is less than 16%, the increase in strength would terminate after 7 days, while the sediments stabilized by 16% and 20% of hybrid stabilizer achieved higher strength after 21 days. In fact, the Ca2+ generated from GGBS becomes distributed amongst the sediment particles, accelerating the formation of CSH.41 This causes the UCS increased with curing time. This trend can be promoted by the addition of higher dosages of hybrid stabilizer to the sediments in order to generate more cementitious mineral phases and consequently increase the UCS value.42 The increase in UCS values after 28 days was not remarkable for any stabilized samples due to the hydration of hybrid stabilizer became very slowly after 7 days curing (see from Fig. 4). After 56 days soaking, the stabilized samples with 2%, 4% of hybrid stabilizer showed different degree of disintegration, while the soaking time did not induce any effect on the disintegration of samples with 8%, 16% and 20% stabilizer.
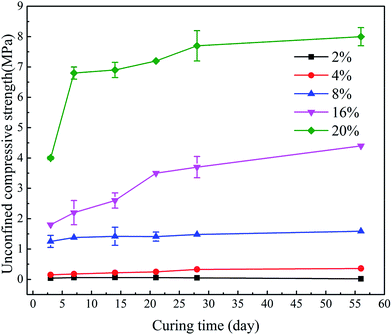 | ||
| Fig. 5 UCS development of sediments with different dosage of hybrid stabilizer (GR5) after soaking in deionized water. | ||
3.2 Cementitious mineral phases leaching behavior
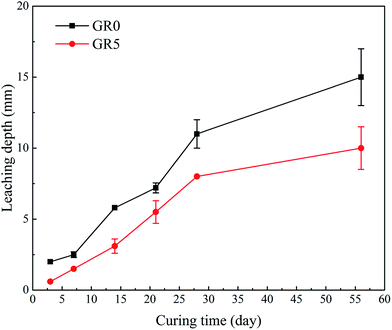
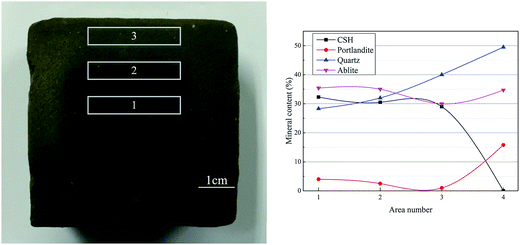
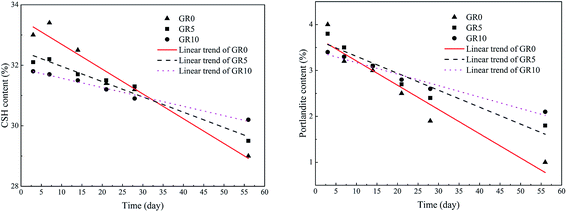
When the stabilized sediment samples immersed in water, the leaching process began.32 In first 7 days, the initially soluble elements of GR0 sample released slowly. It can be observed in Fig. 6 that the leaching depth of GR0 at 3 day-soaking is similar to 7 day-soaking. But the UCS values of GR0 showed great increase (Fig. 3a) due to the hydration of GGBS in first 7 days (Fig. 4). After the dissolution of initial soluble elements, the main dissolution process occurred between 7 days and 28 days, as we can see, the leaching depth showed a significant change. This result has good accordance with ref. 32. In the meantime, the hydration rate of GR0 became very slow during 7 days to 28 days. These factors lead to the strength decline of GR0 at 28 day-soaking. After 28 days curing, the leaching speed became sluggish, so the leaching depth of 28 day-soaking sample and 56 day-soaking sample showed little change. For stabilized sediment sample GR5, compared to GR0 stabilized sample, there is little difference in leaching depth and degree of hydration between these two samples after soaking for 7 days. As a result, the UCS value of GR0 and GR5 displayed little various at 7 day-soaking. But after 28 days soaking, the leaching process of GR0 was more serious than GR5 (see from Section 3.3). This is the reason why GR5 sample showed better strength than GR0 after 28 day-soaking.As we can see in Fig. 7, the content of quartz and portlandite increased while the CSH content decreased from inner area to outer area. For the filter residue (area 4), the CSH phase was not detected but the content of portlandite significantly increased, meaning that the Ca2+ in CSH transformed into portlandite according to the leaching process. After the cementitious mineral phases in the surface of sediment sample leached out, sediments spalling occurred due to the loss of cementitious mineral phases. This is the reason why plenty of quartz and albite phases, which are the main composition of sediments, were detected in leachate. Fig. 8 shows the main cementitious mineral phases content of GR0, GR5 and GR10 stabilized samples at different soaking time. Test specimens were extracted from the center of stabilized samples. The content of CSH from all of the stabilized samples decreased with the soaking time. However, the decreasing trend of GR5 and GR10 was more gently than GR0. The content of portlandite from the stabilized samples followed a similar trend to CSH during the soaking time, but the content of portlandite was much lower. Accompanied by compressive strength results, the GR5 and GR10 samples showed 7.7 MPa and 6.5 MPa of 28 days curing strength, respectively, but the value of GR0 sample was only 5.5 MPa (Fig. 3). This phenomenon illustrate that resin has inhibition effect to the leaching of cementitious mineral phases in stabilized sediment samples.
3.3 Hydraulic conductivity
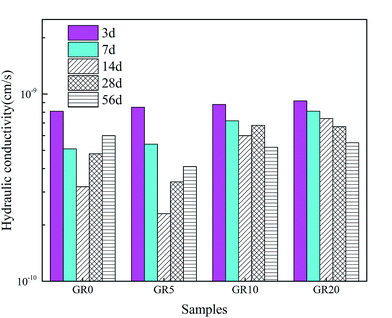
The hydraulic conductivity behaviors of stabilized sediment samples permeated with deionized water are shown in Fig. 9. For all of the test samples, the hydraulic conductivity values up to 14 days decreased with permeation time. This phenomenon is due to the rapid hydration of GGBS forming more content of cementitious mineral phases. In the meantime, the leaching rate is very slow at 14 days. After 14 day-permeation, the hydraulic conductivity values of stabilized sediment samples containing resin showed lower increased level than GR0 sample or even displayed continuous decreasing. For 56 day-permeation samples, the stabilized samples with resin showed better hydraulic conductivity behavior than pure GGBS stabilized samples. Meaning that after 28 days soaking, the leaching process of GR0 was more serious than hybrid stabilizer stabilized samples. These results illustrate that resin possesses good anti-penetrability performance.3.4 Hazardous elements leaching behavior
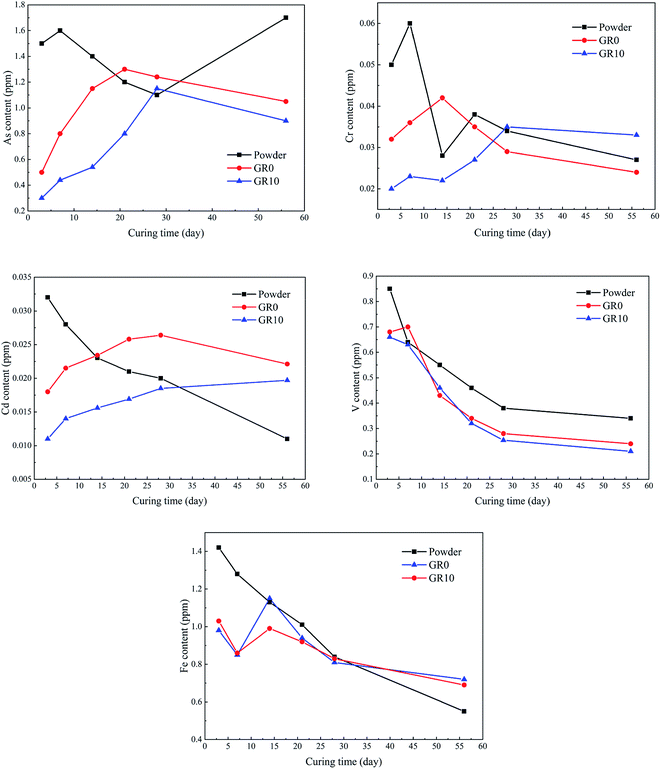
Fig. 10 shows the content of hazardous elements which leached from stabilized samples. The leached content of As from unhydrated GGBS powder was much higher than GR0 and GR10 stabilized samples at first 14 days. After 28 days, the leached content of As in unhydrated GGBS powder was similar to GR0 and GR10 stabilized samples in a short periods and then the stabilized samples showed much lower leached content of As than unhydrated GGBS powder samples. Note the content of leached As from GR10 was less than GR0 in almost all soaking ages, which might be resulted from the cementitious leaching controlled effect of resin. For As, the leaching control effect was manifested at early term and long term soaking. But for Cr and Cd ions, the hybrid stabilizer showed better performance during the early term until 25 days and 30 days, respectively. The changes in the leached content of V followed a similar trend to Fe during the soaking time, while the Fe leached from the stabilized samples was lower than unhydrated GGBS powder sample at first 14 days. But the GR10 sample did not show better behavior than GR0 on the stabilization of Fe and V. This phenomenon illustrated that the leaching control effect of resin on Fe and V is slightly.Fig. 11 presented the maximum content of hazardous elements tested in the leachate during the soaking time. The maximum content of hazardous elements leached from unhydrated GGBS powder samples was much higher than those from the stabilized samples. The GR10 sample showed the lowest contents of all the hazardous elements except As ions. However, the average leached content of As from GR10 stabilized sample was much lower than GR0 sample. The maximum content of As, Cd, V and Cr leached from the stabilized samples were much lower than the respective contamination limits set by US EPA, which are 2, 5.6, 130 and 212 ppm, respectively.43
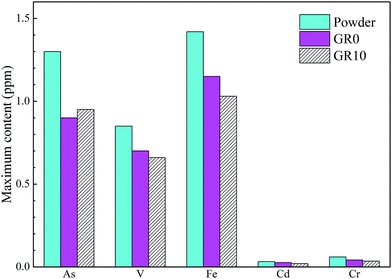 | ||
| Fig. 11 Maximum content of the detectable hazardous elements leached from powder (unhydrated GGBS powder) and stabilized samples after soaking for 56 days. | ||
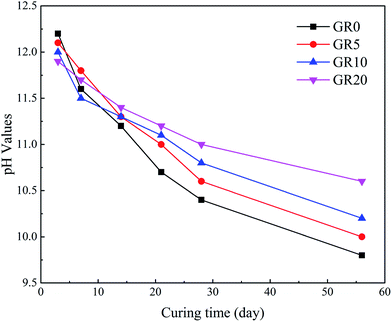
Fig. 12 shows the pH values of pore solution of hybrid stabilizer stabilized sediments. The pH values reduced with an increase in curing days. Moreover, Fig. 12 indicates that as more amounts of resin were added to sediments, an obvious increment of pH values was noticed. This led to the stability of leaching controlled mineral phases which play an important role in the releasing of hazardous elements.20,23 This is the reason why the leaching level of hazardous elements except As in GGBS becomes lower after the addition of resin.
3.5 SEM-EDX characterization
Fig. 13 shows the SEM and EDX spectra of GR0 sample after cured for 56 days. The GR0 stabilized sample showed a heterogeneous morphology with lots of sediment and cementitious mineral phase particles of different size on the surface. The bonding of sediment particles and cementitious mineral phases is weak, as apparent from Fig. 13a. In the meantime, crystalline phase and amorphous phase can both observe in Fig. 13b, meaning that the geopolymer gel and CSH crystal were both formed in GR0 stabilized sample. EDX is utilized to offer a qualitative evidence for the formation of CSH, geopolymer and resin in sediments. The content of Ca, Si and Al element was high in spectrum 1, which further demonstrated that the microstructure of spectrum 1 is the composite of geopolymer gel and CSH. However, the high content of Ca element was only detected in spectrum 2, which represents the portlandite or high Ca/Si ratio CSH in sediment matrix. These minerals leach easily in presence of pore water, leading to the microstructural failure in hardened sediment matrix. When sediment samples were immersed in water, the pore and crack system of the sediment samples would form, which is the place of leaching reaction. For GGBS stabilized sample, NaOH was used to activate the GGBS, which is well-known for their high solubility, so it would release into the pore and crack system at the initial contact with water and then diffused into the leachate. See from the pH value tests (Fig. 12), the pH values reduce with the increasing of curing days. The diffusion might affect the solubility of the inorganic solid phases (CSH and portlandite), which would lead to the aggravation of solid phases decomposition.24,44 After the leaching of these bonding materials, the stripping of sediment minerals occurred.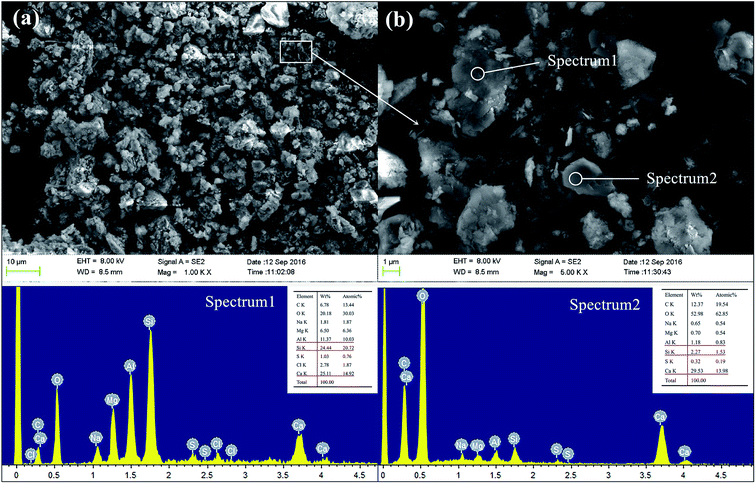 | ||
| Fig. 13 The SEM and EDX spectra of GR0 sample after curing for 56 days, (a) 1000 magnification; (b) 5000 magnification. | ||
Fig. 14 presents the SEM images and EDX spectra of sample GR5, a different morphology is observed compared to the GR0 sample (Fig. 13). As apparent from the images, plenty of floccules can observe in sediment matrix. According to the EDX spectra, see from the element composition of spectrum 1, high content of C, Si, Al element demonstrated the floccules might be the composite of resin and geopolymer. As for spectrum 2, high content of Ca, O and C element was detected, which illustrate that the cubic crystals in this area are probably portlandite. The microdispersion of this poly-system showed good homogeneity and uniformity, which in good agreement with compressive strength results. The GR5 stabilized sediment sample represented excellent compressive strength by means of the adhering effect of the poly-system which would closely bond sediment particles. Meanwhile, it is worth pointing out that, the closely bonded microstructure enhanced the water resistant property of the hybrid composite due to the resin formed a confining bed which can reduce the connections between pore water and soluble minerals.
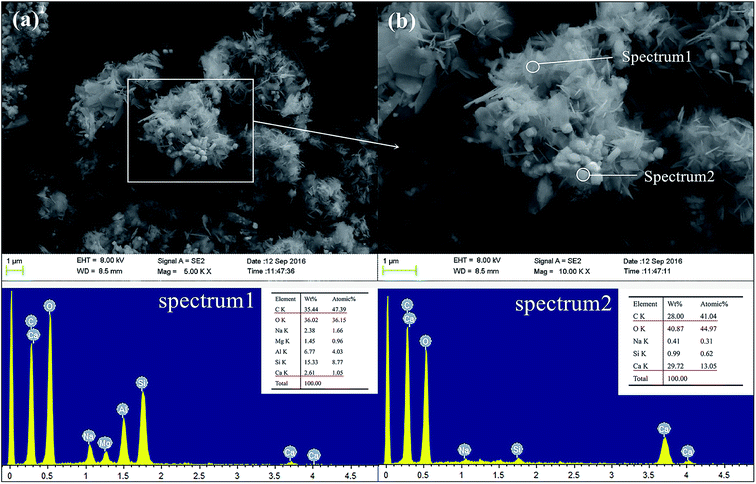 | ||
Fig. 14 The SEM and EDX spectra of GR5 sample after curing for 28 days, (a) 5000 magnification; (b) 10![[thin space (1/6-em)]](https://www.rsc.org/images/entities/char_2009.gif) 000 magnification. 000 magnification. | ||
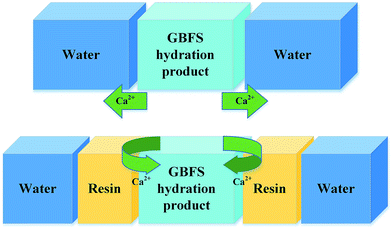
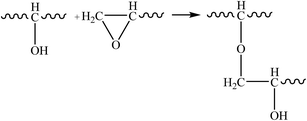
Therefore, the leaching inhibition effect of resin could be described by two steps: firstly, epoxy resin cross-link reaction (eqn (2)–(4)) on the surface of inorganic phase formed organic–inorganic core–shell structure (Fig. 14), preventing the Ca2+ from leaching into the pore water, see from the schematic illustration of leaching and leaching preventing (Fig. 15).
 | (2) |
 | (3) |
 | (4) |
Secondly, in alkali-activated GGBS system, the [SiO(OH)3]− species which derived from Si(OH)4 reacted with NaOH as shown in eqn (5). And then, [SiO(OH)3]− reacted with [Al(OH)4]− to yield to a hydration product which has a chain-like structure of [AlO4]5− and [SiO4]4− tetrahedral interlinked by sharing oxygen atoms as shown in eqn (6).
| Si(OH)4 + NaOH → Na+[OSi(OH)3]− + H2O | (5) |
 | (6) |
Hence, during the cross-linking reaction of epoxy resin, the formation of epoxy groups made the resin compatible with the inorganic phases due to the epoxy opening ring reaction in the curing stage.30 In this way, the resin phase could chemically interact with the inorganic phase to form a novel chain-like framework which composed of polyamine, [AlO4]5− and [SiO4]4−, as we can see in Fig. 14. This new substance showed an excellent dispersion up to micrometric level between organic and inorganic phases.29,45
Fig. 16 shows the SEM images and EDX spectra of sample GR40, a very different morphology is observed instead in the case of the GR0 and GR40 sample (Fig. 13 and 14). See from Fig. 16a, the surface of inorganic phases is mainly covered by the floccule phases. According to the EDX spectrum 1, the floccule phases show high C element content, meaning that the major component of this phase is resin. As for spectrum 2, the bulk phase presents high C and Ca element content, which indicates that this phase is probably the hybrid organic–inorganic composite. The resin dosage of 40% by weight may be excessive to form the hybrid cementitious composite, see from degree of hydration tests (Fig. 4), the degree of hydration reduced with the increasing of resin dosage. Accordingly, the redundant resin covered the surface of the hybrid composite, preventing the connection between the free water and inorganic phases, which would inhabit the further hydration of inorganic phases and led to the strength development sluggish, as confirmed by compressive strength data (Fig. 3).
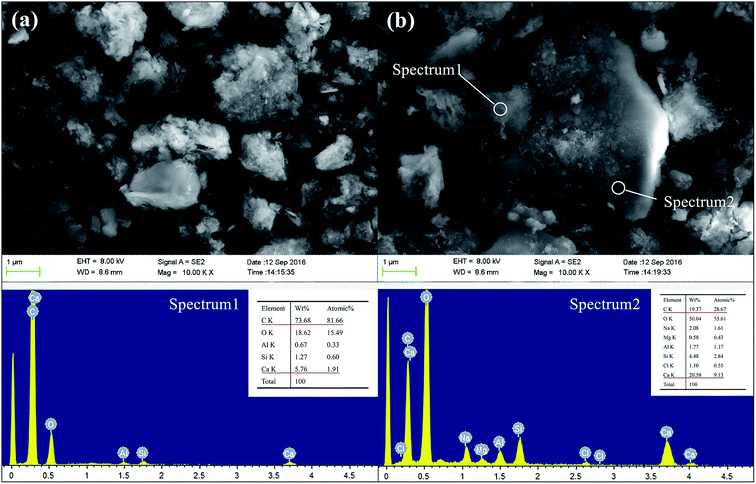 | ||
Fig. 16 The SEM and EDX spectra of GR40 sample after curing for 28 days, (a) 10![[thin space (1/6-em)]](https://www.rsc.org/images/entities/char_2009.gif) 000 magnification; (b) 10 000 magnification; (b) 10![[thin space (1/6-em)]](https://www.rsc.org/images/entities/char_2009.gif) 000 magnification. 000 magnification. | ||
3.6 Moisture content
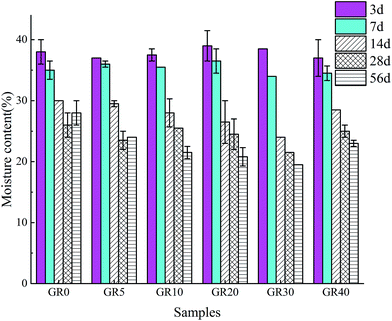
The moisture content of broken inner layer of sediment samples after 3, 7, 14, 28 and 56 days curing is shown in Fig. 17. The moisture content of GR0 and GR5 samples decreased with the increasing of curing time at first 28 days. But after 56 days curing, the moisture content increased. This is due to the hydration of GGBS consumed pore water during the early hydration age. After 28 days, the GGBS in GR0 and GR5 are almost completely hydrated (Fig. 4). In the meantime, the leaching process of cementitious mineral phases became more serious (Fig. 9). Thus, more environment water came into the pore space lead to the increase of moisture content. For the samples which dosage of resin is larger than 5%, the moisture content decreased with the increase of curing time. In the presence of resin, free water in stabilized sediment system was controlled in a low range, which slowed down the leaching speed of inorganic phases. Meanwhile, the hydration rate of GR10, GR20, GR30 and GR40 is slower than GR0 and GR5 (Fig. 4). So these samples with high dosage of resin could continue consuming pore water to perform hydration reaction. This is the reason why the compressive strength of those samples, which resin dosage is larger than 5%, increased with curing time. In the case of GR40 sediment sample, because of the water-resisting effect of resin, the excessive resin prevented the inorganic phases from completely hydration in early age. Accordingly, the low degree of hydration of inorganic phases led to the formation of large pore and structure cracks in sediment matrix. Finally, free water was allowed to enter the stabilized sediment system from pores and cracks. This might be the reason why the GR40 sample shows high moisture content of 56 days curing.4 Conclusions
In this study, an environmental friendly epoxy resin was used to synthesis an organic–inorganic hybrid composite which utilized as marine sediments stabilizer. It was observed that the mechanical performance is sensitive to the dosage of resin. The UCS values decrease with the resin concentrations ranging from 5% to 40% due to the excessive epoxy resin covered the surface of GGBS particles and prevented the GGBS from further hydration. The stabilized sediment sample with 5% of resin gave the best strength as well as excellent Young's modulus. The strength development would terminate after 7 days, if the dosage of hybrid stabilizer is less than 16%. But the sediments stabilized by 16% and 20% of hybrid stabilizer achieve higher strength even after 21 days soaking.It seems that, the primary leaching cementitious phases in hybrid stabilizer stabilized sediment are CSH and portlandite, while the presence of resin controlled the leaching of these two phases effectively. The cementitious leaching controlled effect of resin led to the stabilization of hazardous elements. For As, the leaching control effect was manifested at early term and long term soaking. But for Cr and Cd ions, the hybrid stabilizer showed better performance during the early term until 25 days and 30 days, respectively. In case of Fe and V, the leaching control effect of resin could not be easily observed. The maximum content of As, Cd, V and Cr leached from the stabilized samples were much lower than the respective contamination limits.
SEM-EDX analyses illustrated that different dosages of resin formed various microstructures to influence the water content of stabilized sediment samples. The leaching controlled mechanism of resin consists of two reactions, which are epoxy resin cross-link reaction on the surface of inorganic phase that formed organic–inorganic core–shell structure and co-reticulation with the inorganic phases to form a novel chain-like framework which composed of polyamine, [AlO4]5− and [SiO4]4−. We are optimistic that the novel environmental friendly organic–inorganic hybrid sediment stabilizer can prevent the leaching of cementitious mineral phases and hazardous elements in GGBS hydrated products effectively and provide further beneficial uses of the alkali-activated GGBS materials.
Acknowledgements
This study was supported by Program for Changjiang Scholars and Innovative Research Team in University (IRT1086), the Graduate Innovation Foundation of China University of Petroleum (YCX2017015) and National Basic Research Program of China (2015CB251202).References
- R. Zentar, V. Dubois and N. E. Abriak, Resour., Conserv. Recycl., 2008, 52, 947–954 CrossRef.
- K. Siham, B. Fabrice, A. N. Edine and D. Patrick, Waste Manage., 2008, 28, 919–928 CrossRef PubMed.
- D. Wang, N. E. Abriak and R. Zentar, Mar. Georesour. Geotechnol., 2016, 35, 472–480 CrossRef.
- C. F. Chiu, W. Zhu and C. L. Zhang, Eng. Geol., 2009, 103, 1–12 CrossRef.
- R. Zentar, D. Wang, N. E. Abriak, M. Benzerzour and W. Chen, Constr. Build. Mater., 2012, 35, 856–863 CrossRef.
- D. Wang, R. Zentar and N. E. Abriak, J. Mater. Civ. Eng., 2017, 29, 04016281 CrossRef.
- D. Wang, R. Zentar and N. E. Abriak, J. Mater. Civ. Eng., 2016, 28, 04016005 CrossRef.
- L. Saussaye, H. Hamdoun, L. Leleyter, E. van Veen, J. Coggan, G. Rollinson, W. Maherzi, M. Boutouil and F. Baraud, Mar. Pollut. Bull., 2016, 110, 401–408 CrossRef CAS PubMed.
- Y. Mamindy-Pajany, C. Hurel, F. Geret, M. Roméo and N. Marmier, J. Hazard. Mater., 2013, 252–253, 213–219 CrossRef CAS PubMed.
- B. Chai, T. Huang, W. Zhu and F. Yang, J. Environ. Sci., 2011, 23, 1977–1982 CrossRef CAS.
- A. R. Goodarzi and M. Movahedrad, Appl. Geochem., 2017, 81, 155–165 CrossRef CAS.
- M. Xie, A. K. Leung and C. W. W. Ng, Chemosphere, 2017, 175, 425–430 CrossRef CAS PubMed.
- A. R. Goodarzi and M. Salimi, Appl. Clay Sci., 2015, 108, 61–69 CrossRef CAS.
- M. Loncnar, H. A. van der Sloot, A. Mladenovič, M. Zupančič, L. Kobal and P. Bukovec, J. Hazard. Mater., 2016, 317, 147–157 CrossRef CAS PubMed.
- A. Jarošíková, V. Ettler, M. Mihaljevič, B. Kříbek and B. Mapani, J. Environ. Manage., 2017, 187, 178–186 CrossRef PubMed.
- O. Schwab, P. Bayer, R. Juraske, F. Verones and S. Hellweg, Waste Manage., 2014, 34, 1884–1896 CrossRef CAS PubMed.
- W. J. J. Huijgen and R. N. J. Comans, Environ. Sci. Technol., 2006, 40, 2790–2796 CrossRef CAS PubMed.
- R. Baciocchi, G. Costa, A. Polettini and R. Pomi, J. Hazard. Mater., 2015, 286, 369–378 CrossRef CAS PubMed.
- G. Cornelis, C. A. Johnson, T. V. Gerven and C. Vandecasteele, Appl. Geochem., 2008, 23, 955–976 CrossRef CAS.
- M. Chrysochoou and D. Dermatas, J. Hazard. Mater., 2006, 136, 20–33 CrossRef CAS PubMed.
- R. B. Perkins and C. D. Palmer, Appl. Geochem., 2000, 15, 1203–1218 CrossRef CAS.
- J. Jain and N. Neithalath, Cem. Concr. Compos., 2009, 31, 176–185 CrossRef CAS.
- V. B. Duong, R. Sahamitmongkol and S. Tangtermsirikul, Constr. Build. Mater., 2013, 40, 1066–1075 CrossRef.
- F. Han, R. Liu and P. Yan, Constr. Build. Mater., 2014, 68, 630–636 CrossRef.
- M. Keramatikerman, A. Chegenizadeh and H. Nikraz, Appl. Clay Sci., 2016, 132–133, 722–730 CrossRef CAS.
- Y. Yaolin, L. Cheng and L. Songyu, J. Mater. Civ. Eng., 2010, 27, 04014146 Search PubMed.
- R. A. Mozumder and A. I. Laskar, Computers and Geotechnics, 2015, 69, 291–300 CrossRef.
- D.-H. Kim and H.-S. Kim, Composites, Part B, 2013, 55, 86–95 CrossRef CAS.
- C. Ferone, G. Roviello, F. Colangelo, R. Cioffi and O. Tarallo, Appl. Clay Sci., 2013, 73, 42–50 CrossRef CAS.
- J. Du, Y. Bu, Z. Shen, X. Hou and C. Huang, Mater. Des., 2016, 109, 133–145 CrossRef CAS.
- E. M. Petrie, Adhesives Formulations, 2006 Search PubMed.
- E. Guibal, Sep. Purif. Technol., 2004, 38, 43–74 CrossRef CAS.
- A. R. Cestari, E. F. S. Vieira, F. J. Alves, E. C. S. Silva and M. A. S. Andrade Jr, J. Hazard. Mater., 2012, 213–214, 109–116 CrossRef CAS PubMed.
- ASTM2487, Standard practice for classification of soils for engineering purposes (unified soil classification system), 2011 Search PubMed.
- ASTM698, Standard test methods for laboratory compaction characteristics of soil using standard effort, 2007 Search PubMed.
- ASTM E111-04, Standard Test Method for Young's Modulus, Tangent Modulus and Chord Modulus, 2010 Search PubMed.
- P. Wang, S. Feng and X. Liu, J. Build. Mater., 2005, 8, 646–652 CAS.
- NEN 7345, Leaching characteristics of solid earthly and stony building and waste materials – leaching tests – determination of the leaching of inorganic components from buildings and monolitic waste materials with the diffusion test, 1995 Search PubMed.
- E. P. Agency, Toxicity Characteristic Leaching Procedure: Method 1311, 2003 Search PubMed.
- R. L. Snyder, Powder Diffr., 1992, 7, 186–193 CrossRef CAS.
- A. H. M. Kamruzzaman, S. H. Chew and F. H. Lee, J. Geotech. Geoenviron. Eng., 2009, 135, 573–589 CrossRef.
- G. N. Obuzor, J. M. Kinuthia and R. B. Robinson, Eng. Geol., 2012, 151, 112–119 CrossRef.
- E. P. Agency, Part 503-standards for the use or disposal of sewage sludge, 1993 Search PubMed.
- L. Tiruta-Barna, C. Fantozzi-Merle, C. D. Brauer and R. Barna, J. Hazard. Mater., 2006, 138, 331–342 CrossRef CAS PubMed.
- G. Roviello, L. Ricciotti, C. Ferone, F. Colangelo and O. Tarallo, Cem. Concr. Compos., 2015, 59, 89–99 CrossRef CAS.
Footnote |
| † Electronic supplementary information (ESI) available. See DOI: 10.1039/c7ra06460h |
| This journal is © The Royal Society of Chemistry 2017 |

