DOI:
10.1039/C7RA06341E
(Paper)
RSC Adv., 2017,
7, 36279-36287
LC-MS/MS reveals the formation of aldehydes and iminium reactive intermediates in foretinib metabolism: phase I metabolic profiling
Received
6th June 2017
, Accepted 15th July 2017
First published on 20th July 2017
Abstract
Foretinib (GSK1363089) is an inhibitor of multiple receptor tyrosine kinases including MET and VEGFR, with the potential for treatment of solid tumors. In this study, we investigated the in vitro metabolic pathways for foretinib in rat liver microsomes using LC-MS/MS. Methoxylamine and potassium cyanide were used as trapping agents for aldehyde and iminium reactive intermediates, respectively, of foretinib to form a stable complex that can be identified by LC-MS/MS. Six foretinib phase I metabolites were characterized. The phase I metabolic pathways were oxidation, defluorination, reduction and hydroxylation. Additionally, four potential reactive metabolites, two aldehydes and two iminium ions, were found and the bioactivation pathways were proposed. Reporting the in vitro and reactive metabolites of foretinib is very crucial in the development stage. A literature review showed that no previous articles have provided an in vitro metabolism study of foretinib or detailed structural identification of the formed reactive metabolites.
1. Introduction
Tyrosine kinase inhibitors (TKIs) are considered a very important class of targeted therapy which interferes with specific cell signalling pathways that allow targeting selected malignancies.1 Tyrosine kinases are enzymes that catalyze the transfer of the γ phosphate of ATP to the tyrosine hydroxyl groups on target proteins. They act as an “on” or “off” switch in many cellular functions.2 Strict control of the tyrosine kinase activity in the cell regulates important processes such as the cell cycle, proliferation and cell death. In many cases, the abnormal proliferation characteristics of cancer are driven by growth factor receptor-mediated signaling. In tumor cells, the failure of the control mechanism may lead to excessive phosphorylation, and pathways sustained in an activated state.3,4 Foretinib is a multikinase inhibitor that inhibits multiple receptor tyrosine kinases, including MET (mesenchymal–epithelial transition factor) and VEGFR (vascular endothelial growth factor receptor-2), with the potential for treatment of solid tumors5 and hepatocellular carcinoma (HCC).6 Foretinib showed a very promising synergetic effect with HER2 inhibitors and the potential to overcome drug resistance to lapatinib.7
Metabolic activation of a drug leading to reactive metabolite(s) that can covalently modify proteins is considered an initial step that may lead to drug-induced organ toxicities.
Metabolism is considered a detoxification process by which endogenous compounds and xenobiotics are transformed into more hydrophilic species to enable elimination from the body. In most cases, metabolites are less toxic than parent molecules, but sometimes undergo bioactivation to form reactive intermediates that are more toxic.8–10 Reactive metabolites can covalently modify proteins, which are considered the first step in drug-induced organ toxicities.11,12 The reactive metabolites generated from metabolism are considered crucial in drug-induced toxicity. Usually, reactive metabolites are produced by phase I metabolic reactions. The reactive metabolites can cause many side effects. Reactive intermediates cannot be detected directly due to their transient nature. Instead, a trapping agent was used to capture the reactive intermediate, leading to formation of adducts which are stable and can be detected and characterized by tandem mass spectrometry.13,14
Foretinib chemical structure contains morpholine group (Fig. 1). Morpholine group containing drugs undergo bioactivation by iminium ion formation or oxidative dealkylation to form aldehyde.15–17 GSH or its derivatives are not suitable agents for trapping hard reactive intermediates. Potassium cyanide (KCN) and methoxyl amine are considered perfect trapping agents for iminium ion and aldehydes intermediates, respectively.8,15,16 The formed adducts are stable and can be separated, detected and characterized using liquid chromatography tandem mass spectrometry.13–15,18,19
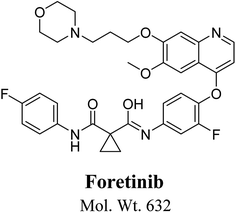 |
| | Fig. 1 Chemical structure of foretinib. | |
2. Chemicals and methods
2.1. Chemicals
Foretinib was procured from LC Labs (Woburn, MA, USA). Ammonium formate and HPLC-grade acetonitrile (ACN), potassium cyanide (KCN), methoxyl amine (MeONH2) and formic acid were procured from Sigma-Aldrich (West Chester, PA, USA). Purified water was obtained from Milli-Q plus purification system, Millipore, Waters (Millipore, Bedford, MA, USA). Rat liver microsomes (RLMs) were prepared in-house using Sprague Dowley rat following reported method.20
2.2. Chromatographic conditions
Study of foretinib fragmentation was performed using an Agilent HPLC 1200 connected to triple quadrupole mass spectrometer (Agilent 6410 QqQ) by direct injection through using a connector instead of a column. Chromatographic separation for extract of the incubation mixture was performed on an Agilent 1200 series system and an Agilent 6410 QqQ LC/MS with an electrospray ionization (ESI) interface. The chromatography was performed on Agilent eclipse plus C18 analytical column (150 mm × 2.1 mm, 3.5 μm particle size) (Agilent Technologies, Palo Alto, CA, USA). Column temperature was kept constant at 25 ± 2 °C. The most suitable chromatographic conditions were achieved at a flow rate of 0.25 mL min−1 with a gradient system. Mobile phase consisted of solvent A which is 10 mM ammonium formate (pH: 4.2 by addition of formic acid) and solvent B which is ACN. The stepwise gradient was 5% B (0–5 min), 5 to 70% B (5–60 min), 70 to 90% B (60–70 min), 90 to 5% B (70–75 min). The post time was 15 minutes to allow conditioning of column before the next run. Sample injection volume was 15 μL with a total run time of 75 minutes. Mass parameters were optimized for foretinib. Product ions for foretinib, its phase I metabolites and its adducts were generated in the collision cell by collision-induced dissociation (CID) mode. Detection was performed on a triple quadrupole mass spectrometer, operated with an ESI interface in the positive ionization mode. Low purity nitrogen was used as desolvation gas at a flow rate of 12 L min−1 and high purity nitrogen was used as collision gas at a pressure of 55 psi. Source temperature was set at 350 °C and capillary voltage was set at 4000 V. Fragmentor voltage was set to 145 V with collision energy of 25 eV for foretinib, its phase I metabolites and its adducts. Mass Hunter software (Agilent Technologies, Palo Alto, CA, USA) was used to control the instruments and data acquisition.
2.3. RLMs incubations
Thirty μM foretinib was incubated with 1.0 mg mL−1 RLMs, 1.0 mM NADPH and 50 mM Na/K phosphate buffer (pH 7.4) containing 3.3 mM MgCl2. The mixtures were incubated at 37 °C in a shaking water bath for 120 min. The metabolic reaction was initiated by addition of NADPH and terminated by adding 2 mL of ice-cold ACN. Centrifugation for the incubation mixture (14![[thin space (1/6-em)]](https://www.rsc.org/images/entities/char_2009.gif) 000 rpm, 10 min and 4 °C) was done to devoid of proteins. The supernatants were removed, evaporated and reconstituted in ACN/water and transferred to HPLC vial to be injected into Agilent 6410 LC-MS.21,22
000 rpm, 10 min and 4 °C) was done to devoid of proteins. The supernatants were removed, evaporated and reconstituted in ACN/water and transferred to HPLC vial to be injected into Agilent 6410 LC-MS.21,22
2.4. Trapping foretinib reactive metabolites using methoxylamine and potassium cyanide
The same experiment of RLMs incubation was repeated using 2.5 mM methoxyl amine and with 1.0 mM KCN to capture reactive iminium and aldehyde intermediates. Incubations were performed in triplicate to confirm the data obtained.
2.5. Identification of the in vitro foretinib metabolites
Full mass spectra (MS) scan and product ion (PI) experiment were used to detect of metabolites and adducts of foretinib formed by the in vitro incubations with RLMs. Searching for metabolites in the total ion chromatogram (TIC) of the metabolic extract was done by extracted ion chromatogram (EIC) of m/z of proposed foretinib metabolites. EICs of the metabolic extract were compared with control incubations.
3. Results and discussion
3.1. PI study of foretinib
Foretinib molecular ion peak (MIP) appears as [M + H]+ (m/z 633) at 40.9 min in PI chromatogram (Fig. 2A). Collision induced dissociation (CID) of parent ion at m/z 633 gave two daughter ions (DI) at m/z 128 and at m/z 100 (Fig. 2B). DI at m/z 128 represents propyl morpholine ring by single bond cleavage (Scheme 1).
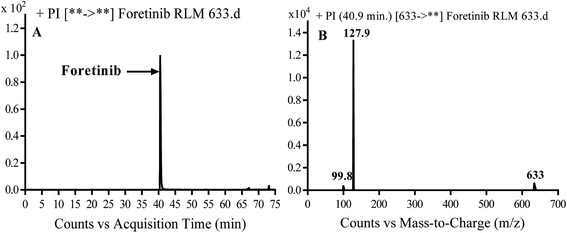 |
| | Fig. 2 PI chromatogram of MIP at m/z 633 showing foretinib peak at 40.9 min (A), PI mass spectrum of foretinib (B). | |
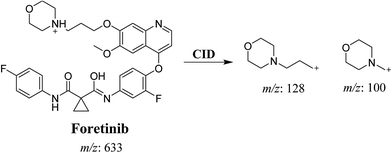 |
| | Scheme 1 Proposed CID of foretinib. | |
3.2. Identification of in vitro foretinib metabolites produced RLMs incubation
Purified extracts of RLMs incubations were injected into LC-QqQ. Metabolites were not observed in control incubations. Five phase I metabolic reactions generated six metabolites through: α hydroxylation, α oxidation, reduction, ether cleavage and deflourination. Two cyano adducts and two methoxyl amine conjugates were characterized after incubation with RLMs in the presence of 1.0 mM KCN and 2.5 mM methoxylamine, respectively (Table 1).
Table 1 Phase I and reactive metabolites of foretinib
| |
MS scan |
Most abundant fragment ions |
Rt. (min) |
Metabolic reaction |
| Foretinib |
633 |
127.9, 99.8 |
40.9 |
|
![[thin space (1/6-em)]](https://www.rsc.org/images/entities/char_2009.gif) |
| Phase I metabolites |
| FA649 |
649 |
144 |
41.3 |
α hydroxylation |
| FA647 |
647 |
142 |
45.6 |
α oxidation |
| FA635a |
635 |
128, 99.9 |
40.0 |
Reduction |
| FA635b |
635 |
506, 130, 74.1 |
41.9 |
Ether cleavage |
| FA615a |
615 |
128 |
39.9 |
Deflourination |
| FA615b |
615 |
128 |
40.8 |
Deflourination |
![[thin space (1/6-em)]](https://www.rsc.org/images/entities/char_2009.gif) |
| Reactive metabolites |
| FC658 |
658 |
631, 126, 98 |
51.3 |
Cyano addition |
| FC660 |
660 |
633, 126, 98 |
51.1 |
Reduction and cyano addition |
| FM591 |
519 |
104 |
51.5 |
Methoxyl amine oximer formation |
| FM607 |
607 |
506, 327.1, 102.2 |
37.2 |
Hydroxylation and methoxyl amine oximer formation |
3.2.1. Identification of FA649 phase I metabolite of foretinib. FA649 MIP appears as [M + H]+ (m/z 649) at 41.3 min in PI chromatogram (Fig. 3A). CID of parent ion at m/z 649 gave one DI at m/z 144 which represent propyl hydroxyl morpholine ring by single bond cleavage (Fig. 3B). Hydroxylation was proposed to happen in α position of morpholine nitrogen atom (Scheme 2).
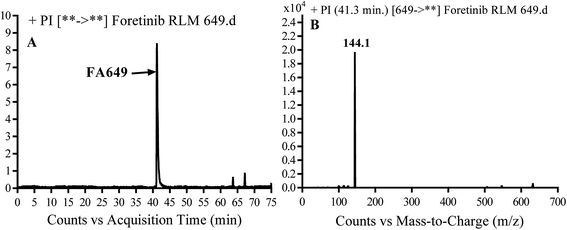 |
| | Fig. 3 PI chromatogram of MIP at m/z 649 showing FA649 peak at 41.3 min (A), PI mass spectrum of FA649 (B). | |
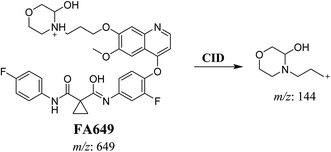 |
| | Scheme 2 Proposed CID of FA649. | |
3.2.2. Identification of FA647 phase I metabolite of foretinib. FA647 MIP appears as [M + H]+ (m/z 647) at 45.6 min in PI chromatogram (Fig. 4A). CID of parent ion at m/z 647 gave one DI at m/z 142 which represent propyl α oxo morpholine ring by single bond cleavage (Fig. 4B). Oxidation was proposed to happen in α position of morpholine nitrogen atom (Scheme 3).
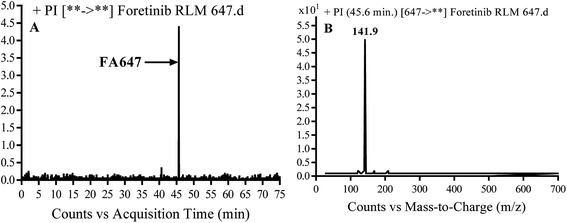 |
| | Fig. 4 PI chromatogram of MIP at m/z 647 showing FA647 peak at 45.6 min (A), PI mass spectrum of FA647 (B). | |
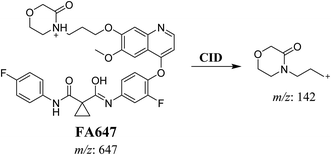 |
| | Scheme 3 Proposed CID of FA647. | |
3.2.3. Identification of FA635a and FA635b phase I metabolite of foretinib. FA635a and FA635b MIPs appears as [M + H]+ (m/z 635) at 40.0 min and 41.9 min, respectively in PI chromatogram (Fig. 5A). CID of parent ions at m/z 635 gave different DIs.
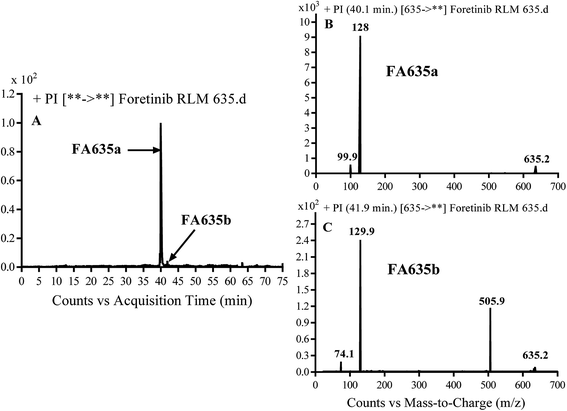 |
| | Fig. 5 PI chromatogram of MIP at m/z 635 showing FA635a peak at 40.1 min and FA635b peak at 41.9 min (A), PI mass spectrum of FA635a (B), PI mass spectrum of FA635b (C). | |
In case of FA635a, CID gave two DIs at m/z 128 and at m/z 100 (Fig. 5B). DI at m/z 128 proposed that no metabolic change occurred in the morpholine ring. DIs revealed that FA635a is reduced form of foretinib without any metabolic change at morpholine ring (Scheme 4).
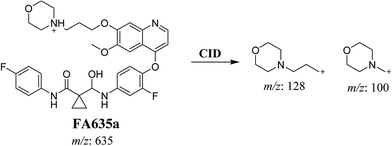 |
| | Scheme 4 Proposed CID of FA635a. | |
In case of FA635b, CID gave three DIs at m/z 506, at m/z 130 and at m/z 74 (Fig. 5C). DI at m/z 130 proposed that metabolic change occurred in the morpholine ring which is consistent with the other DI at 506. The DIs revealed that FA635b is the result of ether cleavage and ring opening of morpholine group (Scheme 5).
 |
| | Scheme 5 Proposed CID of FA635b. | |
3.2.4. Identification of FA615a and FA615b phase I metabolite of foretinib. FA615a and FA615b MIPs appears as [M + H]+ (m/z 615) at 39.9 min and 40.8 min, respectively in PI chromatogram (Fig. 6A). CID for FA615a and FA615b gave DI at m/z 128 (Fig. 6B and C) which represent propyl morpholine ring by single bond cleavage. DI at m/z 128 proposed that no metabolic change occurred in the morpholine ring. The DIs revealed that the metabolic reaction for FA615a and FA615b is deflourination of one flour atom at two different positions (Scheme 6).
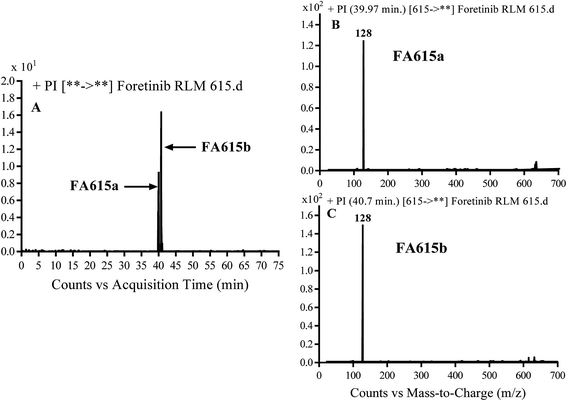 |
| | Fig. 6 PI chromatogram of MIP at m/z 615 showing FA615a peak at 39.9 min and FA615b peak at 41.7 min (A), PI mass spectrum of FA615a (B), PI mass spectrum of FA615b (C). | |
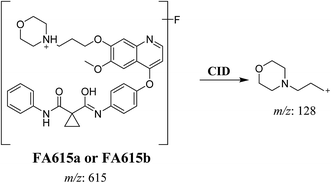 |
| | Scheme 6 Proposed CID of FA615a and FA615b. | |
3.3. Identification of in vitro foretinib reactive metabolites
Two methoxyl adducts and two cyano conjugates were detected in the case of incubation of foretinib with RLMs and 2.5 mM methoxylamine and 1.0 mM KCN, respectively.
3.3.1. Identification of FC658 cyano conjugate of foretinib. FC658 MIP appears as [M + H]+ (m/z 658) at 51.3 min in PI chromatogram (Fig. 7A). CID of parent ion at m/z 658 gave DIs at m/z 631.2, m/z 126 and 97.8 m/z (Fig. 7B). DI at m/z 631 represented an immediate elimination of a molecule of hydrogen cyanide. Compared to fragmentation pattern of foretinib, DI at m/z 126 proposed the addition of cyanide ion to morpholine ring as it represented an immediate elimination of a molecule of hydrogen cyanide. In bioactivation of similar morpholine containing drugs (cyclic tertiary amine ring),23,24 α carbon of the N atom of morpholine ring was proposed to be bioactivated and attacked by cyanide ion (Scheme 7).
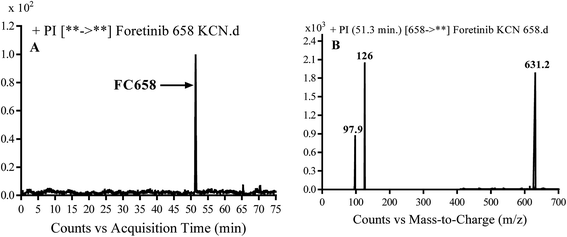 |
| | Fig. 7 PI chromatogram of MIP at m/z 658 showing FC658 peak at 51.3 min (A), PI mass spectrum of FC658 (B). | |
 |
| | Scheme 7 Proposed CID of FA658. | |
3.3.2. Identification of FC660 cyano conjugate of foretinib. FC660 MIP appears as [M + H]+ (m/z 660) at 51.0 min in PI chromatogram (Fig. 8A). CID of parent ion at m/z 660 gave DIs at m/z 633.2, m/z 126 and 97.8 m/z (Fig. 8B). The DI at m/z 633 represented an immediate elimination of a molecule of hydrogen cyanide and proposed the reduction of foretinib. The DI at m/z 126 proposed that the addition of cyanide ion at the activated α carbon of the N atom of morpholine ring (Scheme 8).
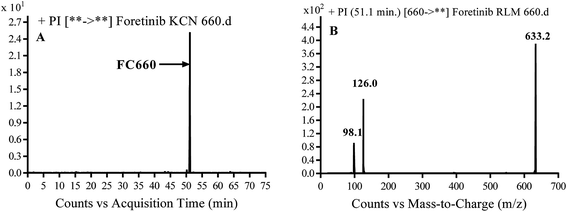 |
| | Fig. 8 PI chromatogram of MIP at m/z 660 showing FC660 peak at 51.1 min (A), PI mass spectrum of FC660 (B). | |
 |
| | Scheme 8 Proposed CID of FC660. | |
3.3.3. Identification of FM591 methoxylamine adduct of foretinib. FM591 MIP appears as [M + H]+ (m/z 591) at 51.5 min in PI chromatogram (Fig. 9A). CID of parent ion at m/z 591 gave DIs at m/z 532.0, m/z and 103.9 m/z (Fig. 9B). The DI at m/z 532 proposed the formation of oxime which is consistent with the other DI at m/z 103.9 (Scheme 9).
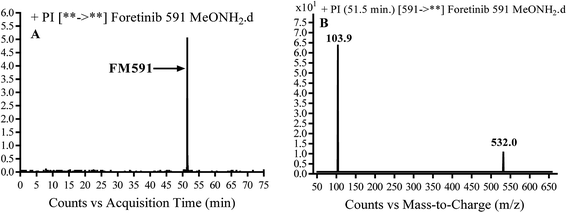 |
| | Fig. 9 PI chromatogram of MIP at m/z 591 showing FM591 peak at 51.5 min (A), PI mass spectrum of FM591 (B). | |
 |
| | Scheme 9 Proposed CID of FM591. | |
3.3.4. Identification of FM607 methoxylamine adduct of foretinib. FM607 MIP appears as [M + H]+ (m/z 591) at 37.2 min in PI chromatogram (Fig. 10A). CID of parent ion at m/z 607 gave DIs at m/z 506.0, m/z 327.1 and 102.2 m/z (Fig. 10B). The DI at m/z 506 proposed the formation of oxime and all metabolic reactions occurred in propyl morpholine ring. The DI at m/z 102 proposed hydroxylation of propyl carbon which is consistent with the other DI at m/z 327 (Scheme 10).
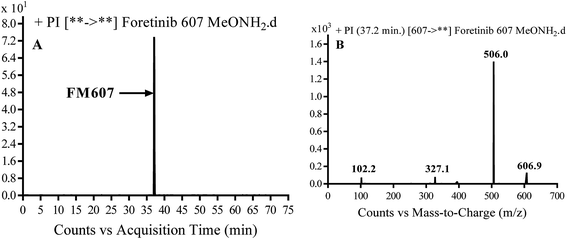 |
| | Fig. 10 PI chromatogram of MIP at m/z 607 showing FM607 peak at 37.2 min (A), PI mass spectrum of FM607 (B). | |
 |
| | Scheme 10 Proposed CID of FM607. | |
3.4. Proposed pathways of bioactivation of foretinib
The formation of FC558 and FC660 cyanide conjugates indicated that the formation of iminium intermediates in the morpholine ring. KCN is the perfect trapping agent for iminium.25 Hydroxylation of morpholine ring in foretinib then dehydration resulted in formation of iminium ions that are not stable but can be trapped by cyanide forming stable adduct that can be detected in LC-MS/MS (Scheme 11). The pathway of formation of iminium intermediate and foretinib bioactivation is previously described with cyclic tertiary amine containing drugs.21,22
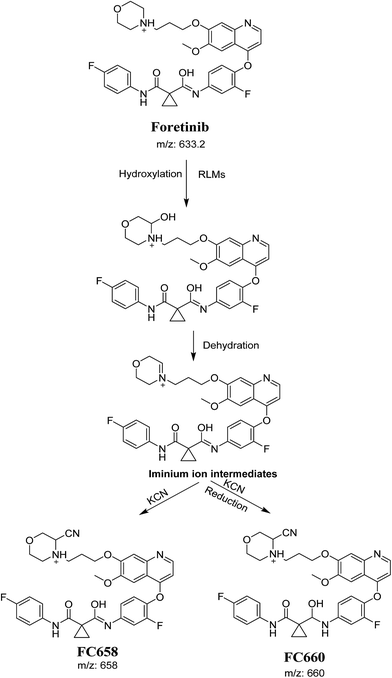 |
| | Scheme 11 Proposed pathway of the formation of iminium intermediates and trapping strategy. | |
The formation of FM591 and FM607 indicated that their aldehyde intermediates were generated in the metabolism of foretinib. The aldehyde (FM591) was generated by dealkylation and trapped with methoxylamine to form oxime FM607 was produced in two steps. Foretinib was first hydroxylated then underwent dealkylation to generate aldehyde which was trapped by methoxylamine to form oxime. Both oximes were stable and characterized using LC-MS/MS (Scheme 12). The pathway for formation of aldehyde was described with a morpholine group containing drugs.26
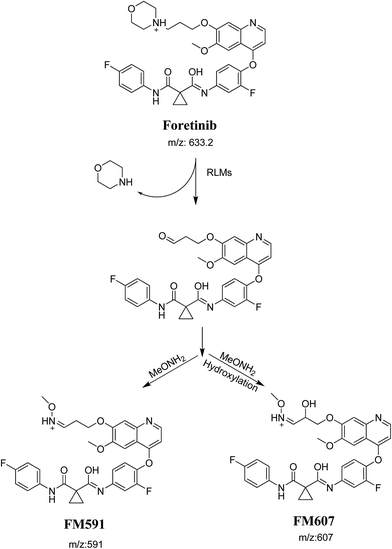 |
| | Scheme 12 Proposed pathway of the formation of aldehydes and trapping strategy. | |
4. Conclusions
Six phase I foretinib metabolites in addition to four potential reactive metabolites, two aldehydes and two iminium ions, were detected and the bioactivation pathways were proposed (Fig. 11). These reactive metabolites may be the reason of foretinib side effects as they are the first step in drug-induced organ toxicities.11,12 This study illuminates the way for further work in the foretinib development and approving to be used in the clinic.
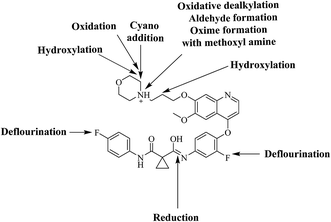 |
| | Fig. 11 Chemical structure of foretinib showing places of phase I metabolic reaction and bioactivation pathways. | |
Conflict of interest
The authors declare no conflict of interest.
Acknowledgements
“The authors would like to extend their sincere appreciation to the Deanship of Scientific Research at the King Saud University for funding this work through the Research Group Project No. RGP-1437-033.”
References
- C. Natoli, B. Perrucci, F. Perrotti, L. Falchi and S. Iacobelli, Curr. Cancer Drug Targets, 2010, 10, 462–483 CrossRef CAS PubMed.
- J. Schlessinger, Cell, 2000, 103, 211–225 CrossRef CAS PubMed.
- C. Özvegy-Laczka, J. Cserepes, N. B. Elkind and B. Sarkadi, Drug Resist. Updates, 2005, 8, 15–26 CrossRef PubMed.
- N. Steeghs, J. W. Nortier and H. Gelderblom, Ann. Surg. Oncol., 2007, 14, 942–953 CrossRef PubMed.
- Y. Kataoka, T. Mukohara, H. Tomioka, Y. Funakoshi, N. Kiyota, Y. Fujiwara, M. Yashiro, K. Hirakawa, M. Hirai and H. Minami, Invest. New Drugs, 2012, 30, 1352–1360 CrossRef CAS PubMed.
- D. Rayson, S. Lupichuk, K. Potvin, S. Dent, T. Shenkier, S. Dhesy-Thind, S. L. Ellard, C. Prady, M. Salim, P. Farmer, G. Allo, M.-S. Tsao, A. Allan, O. Ludkovski, M. Bonomi, D. Tu, L. Hagerman, R. Goodwin, E. Eisenhauer and P. Bradbury, Breast Cancer Res. Treat., 2016, 157, 109–116 CrossRef CAS PubMed.
- M. S. Hsieh, P. W. Yang, L. F. Wong and J. M. Lee, Oncotarget, 2016, 7, 36956–36970 Search PubMed.
- D. C. Evans, A. P. Watt, D. A. Nicoll-Griffith and T. A. Baillie, Chem. Res. Toxicol., 2004, 17, 3–16 CrossRef CAS PubMed.
- A. S. Kalgutkar, D. K. Dalvie, J. P. O'Donnell, T. J. Taylor and D. C. Sahakian, Curr. Drug Metab., 2002, 3, 379–424 CrossRef CAS PubMed.
- U. A. Boelsterli, Curr. Drug Metab., 2002, 3, 439–450 CrossRef CAS PubMed.
- S. R. Knowles, J. Uetrecht and N. H. Shear, Lancet, 2000, 356, 1587–1591 CrossRef CAS.
- C. Ju and J. Uetrecht, Curr. Drug Metab., 2002, 3, 367–377 CrossRef CAS PubMed.
- S. Ma and M. Zhu, Chem.-Biol. Interact., 2009, 179, 25–37 CrossRef CAS PubMed.
- A. F. Stepan, D. P. Walker, J. Bauman, D. A. Price, T. A. Baillie, A. S. Kalgutkar and M. D. Aleo, Chem. Res. Toxicol., 2011, 24, 1345–1410 CrossRef CAS PubMed.
- L. P. Masic, Curr. Drug Metab., 2011, 12, 35–50 CrossRef CAS PubMed.
- Z. Zhang, Q. Chen, Y. Li, G. A. Doss, B. J. Dean, J. S. Ngui, M. Silva Elipe, S. Kim, J. Y. Wu, F. Dininno, M. L. Hammond, R. A. Stearns, D. C. Evans, T. A. Baillie and W. Tang, Chem. Res. Toxicol., 2005, 18, 675–685 CrossRef CAS PubMed.
- B. K. Park, A. Boobis, S. Clarke, C. E. Goldring, D. Jones, J. G. Kenna, C. Lambert, H. G. Laverty, D. J. Naisbitt and S. Nelson, Nat. Rev. Drug Discovery, 2011, 10, 292–306 CrossRef CAS PubMed.
- S. Ma and R. Subramanian, J. Mass Spectrom., 2006, 41, 1121–1139 CrossRef CAS PubMed.
- A. Tolonen, M. Turpeinen and O. Pelkonen, Drug discovery today, 2009, 14, 120–133 CrossRef CAS PubMed.
- R. von Jagow, H. Kampffmeyer and M. Kinese, Naunyn-Schmiedebergs Arch. Exp. Pathol. Pharmakol., 1965, 251, 73–87 CrossRef CAS PubMed.
- A. A. Kadi, H. W. Darwish, M. W. Attwa and S. M. Amer, RSC Adv., 2016, 6, 72575–72585 RSC.
- S. M. Amer, A. A. Kadi, H. W. Darwish and M. W. Attwa, RSC Adv., 2017, 7, 4479–4491 RSC.
- L. P. Masic, Curr. Drug Metab., 2011, 12, 35–50 CrossRef CAS PubMed.
- N. Castagnoli Jr, J. M. Rimoldi, J. Bloomquist and K. P. Castagnoli, Chem. Res. Toxicol., 1997, 10, 924–940 CrossRef CAS PubMed.
- T. Rousu and A. Tolonen, Rapid Commun. Mass Spectrom., 2011, 25, 1382–1390 CrossRef CAS PubMed.
- X. Liu, Y. Lu, X. Guan, B. Dong, H. Chavan, J. Wang, Y. Zhang, P. Krishnamurthy and F. Li, Biochem. Pharmacol., 2015, 97, 111–121 CrossRef CAS PubMed.
|
| This journal is © The Royal Society of Chemistry 2017 |
Click here to see how this site uses Cookies. View our privacy policy here.  Open Access Article
 *ab
*ab
![[thin space (1/6-em)]](https://www.rsc.org/images/entities/char_2009.gif) 000 rpm, 10 min and 4 °C) was done to devoid of proteins. The supernatants were removed, evaporated and reconstituted in ACN/water and transferred to HPLC vial to be injected into Agilent 6410 LC-MS.21,22
000 rpm, 10 min and 4 °C) was done to devoid of proteins. The supernatants were removed, evaporated and reconstituted in ACN/water and transferred to HPLC vial to be injected into Agilent 6410 LC-MS.21,22

![[thin space (1/6-em)]](https://www.rsc.org/images/entities/char_2009.gif)
![[thin space (1/6-em)]](https://www.rsc.org/images/entities/char_2009.gif)


