 Open Access Article
Creative Commons Attribution 3.0 Unported Licence
Inserting AgCl@rGO into graphene hydrogel 3D structure: synergy of adsorption and photocatalysis for efficient removal of bisphenol A†
Fangyuan Chen,
Junxiu Zhao,
Weijia An,
Jinshan Hu,
Yinghua Liang and
Wenquan Cui *
*
College of Chemical Engineering, Hebei Key Laboratory for Environment Photocatalytic and Electrocatalytic Materials, North China University of Science and Technology, Tangshan 063210, P. R. China. E-mail: wkcui@163.com; Tel: +86 315 8805460
First published on 16th August 2017
Abstract
An AgCl@graphene (rGO) core–shell structure was fabricated and then loaded into reduced graphene oxide hydrogel (rGH) to form AgCl@rGO-rGH by the chemical reduction method. The AgCl@rGO core–shell structure inhibited the aggregation of the AgCl particles and promoted the rapid transfer and separation of photogenerated electron–hole pairs. Moreover, the AgCl@rGO-rGH composite exhibited a high adsorption and photocatalytic degradation capacity for bisphenol A (BPA). Specifically, the degradation efficiency of BPA on AgCl@rGO-rGH-2 reached 93.7% under the synergy of adsorption and photocatalytic degradation, and the degradation efficiency of BPA reached 87.0% after five cycles of degradation, which demonstrated the great synergistic effect between graphene and AgCl. The degradation capabilities of AgCl@rGO-rGH were 6.4 and 2.8 times of pure AgCl and rGH on the synergistic degradation of BPA. In the continuous flow system, the degradation ratio of AgCl@rGO-rGH-2 remained 100% within the first 4 h under the synergy conditions. When the reaction time reached 9 h, the synergistic degradation ratio of BPA remained about 75.2%. It showed that AgCl@rGO-rGH-2 still has good degradation activity and long life in the mobile phase system.
1. Introduction
In recent years, self-assembled graphene hydrogel has been considered one of the most promising methods in the “bottom-up” nanotechnology and has subsequently become one of the most active areas of research in nanomaterials.1–3 Graphene composite hydrogels with three-dimensional porous structure possess many superior physical and chemical properties, such as high electronic and thermal conductivity, large theoretical surface area, great mechanical strength, and facile chemical functionalization.4,5 Since the macro-structure constructed with graphene nano modules contains continuously interconnected pores, the surface area of graphene hydrogel is 1–3 times of those of other types of graphene materials.6,7 Therefore, graphene hydrogels exhibit a high affinity to organic pollutants with dramatically enhanced adsorption capacity compared with the non-directional spread adsorption in graphene layers.8–10 In addition, 3D graphene hydrogel with mesoporous structure is very convenient to recycle and reuse, making this material ideal for adsorption purification.11Photocatalytic degradation12 and adsorption13 are two important means for removing toxic and harmful organic pollutants from water. In general, the photocatalytic oxidation reaction has very mild reaction conditions and complete mineralization. The adsorption process possesses various advantages, including simple operation procedure, convenient separation, and without secondary pollution.14 Consequently, these two approaches have significant practical applications in solving environmental issues, especially in the aspect of water pollution. However, these two methods suffer some drawbacks, such as relatively slow mineralization rate, difficulty in recovering the photocatalytic material, slow adsorption ratio, and low capacity of adsorption. As a result, none of these two approaches alone will be able to meet and address the needs of various practical applications in the technical and economic aspects.15–17
Recently, constructing graphene hydrogels with three-dimensional nanostructures has become a more common strategy to improve the properties of semiconductor compounds.18,19 For example, Sridhar Vadahanambi et al. successfully synthesized G-CNT-Fe2O3 hydrogel composite material using microwave-assisted in situ method. Their studies demonstrated that three dimensional structure of G-CNT-Fe2O3 could accelerate the diffusion of As(III) ions through the open pore network during the adsorption process, which led to a two-fold increase in the adsorption capacity of 3d G-CNT-Fe2O3 hydrogel compared with 2d G-Fe2O3.20 Similarly, Han et al. prepared CdS/P25/GH composite material via a one-step hydrothermal and self-assembly method. They discovered that CdS and P25 nanoparticles were anchored in the mesoporous network of graphene hydrogels densely, which shorted the photoproduction electron transfer path effectively and promoted the separation of the electron–hole. As a result, the photocurrent intensity of compound increased 2.6 and 3.6 times than those of CdS and P25, respectively.21 From these results, it is evident that the three-dimensional graphene hydrogel materials showed good prospects for applications in the field of adsorption and photocatalysis.
AgCl, an efficient photocatalyst, applied in combination with metal and photocatalytic characteristics of semiconductor, exhibits excellent photocatalytic performance. This property of AgCl has been confirmed by the studies from Huang etc.22,23 Under the visible light irradiation, Ag+ could be reduced to Ag0 readily. AgCl has significant advantages in the degradation of organic pollutants because of the significant plasmon resonance effect of Ag and the apparent response to visible light of AgCl.24 Limited by easy aggregation, instability, small surface area, and recycle difficulty, AgCl is not practical in actual application. In previous work, although the prepared AgCl-activated carbon sample improves the dispensability and possesses the adsorption–photocatalytic synergy function, the adsorption sites of porous activated carbon do not agree with the photocatalytic sites of Ag@AgCl, which results in instability of sample activity. Recently, semiconductor composite catalyst with core–shell structure has attracted increasing research attention because of its superior performance, high stability of the catalyst with shell protection, improved photocatalytic stability, etc.25 On the other hand, it is well established that graphene oxide (GO) or reducing graphene oxide (rGO) can accelerate electrons and holes separation process in the photocatalytic reaction, thus improving the photocatalytic performance of the catalyst.26–28
Therefore, in this work, AgCl@rGO-rGH was successfully prepared by compositing the graphene hydrogels with AgCl via a chemical reduction method. In this process, AgCl nanoparticles were anchored on the sheet of graphene oxide and formed a three-dimensional network structure with mass reduced graphene oxide. The prepared AgCl@rGO-rGH sample exhibited the characteristics of surface adsorption and photocatalytic degradation of adsorbed organic matters, thus achieving the adsorption and photocatalytic synergy. Moreover, the rGH spatial three-dimensional macroporous structure provides convenient conditions for the recycling of photocatalytic composite. In addition, the adsorption, photocatalytic degradation, and adsorption photocatalytic synergy of bisphenol A (BPA) on the AgCl@rGO-rGH were investigated to improve light removal efficiency and the degradation efficiency of the catalyst.
2. Experimental
2.1 Preparation of AgCl–rGH
GO prepared by Hummer's method and Vitamin C (VC) (GO![[thin space (1/6-em)]](https://www.rsc.org/images/entities/char_2009.gif) :
:![[thin space (1/6-em)]](https://www.rsc.org/images/entities/char_2009.gif) VC = 1
VC = 1![[thin space (1/6-em)]](https://www.rsc.org/images/entities/char_2009.gif) :
:![[thin space (1/6-em)]](https://www.rsc.org/images/entities/char_2009.gif) 10, mass ratio) was mixed and ultra-sounded for 6 h. The resulting mixture was heated at 95 °C for 1–2 hours. Then, the collected product was washed with distilled water after it was immersed in water for several hours to completely remove the excessive unreacted VC. After washed several times, the product was transferred to a beaker and stirred until it was smashed up. Subsequently, an appropriate amount of silver ammonia solution was added to the water mixture containing the prepared GO and stirred for 30 min, and then one equivalent of NaCl aqueous solution was added and stirred for additional 2 h. After the reaction, the resulting product was washed with deionized water several times and dried by vacuum freeze-drying.
10, mass ratio) was mixed and ultra-sounded for 6 h. The resulting mixture was heated at 95 °C for 1–2 hours. Then, the collected product was washed with distilled water after it was immersed in water for several hours to completely remove the excessive unreacted VC. After washed several times, the product was transferred to a beaker and stirred until it was smashed up. Subsequently, an appropriate amount of silver ammonia solution was added to the water mixture containing the prepared GO and stirred for 30 min, and then one equivalent of NaCl aqueous solution was added and stirred for additional 2 h. After the reaction, the resulting product was washed with deionized water several times and dried by vacuum freeze-drying.
2.2 Preparation of rGO wrapped AgCl graphene hydrogel composites
![[thin space (1/6-em)]](https://www.rsc.org/images/entities/char_2009.gif) :
:![[thin space (1/6-em)]](https://www.rsc.org/images/entities/char_2009.gif) VC = 1
VC = 1![[thin space (1/6-em)]](https://www.rsc.org/images/entities/char_2009.gif) :
:![[thin space (1/6-em)]](https://www.rsc.org/images/entities/char_2009.gif) 10, mass ratio) ultrasounded for 6 h, and heated at 95 °C for 1–2 hours. After the reaction, the resulting product was washed with deionized water several times and dried by vacuum freeze-drying. This sample was named AgCl@rGO-rGH-1. Preparation of less-layer GO wrapped AgCl graphene hydrogel composites was same as preparation of AgCl@rGO-rGH-1 except that a small amount of GO prepared by Hummer's method was ultrasounded for 6 h in pH = 10 buffer solution. This sample was named AgCl@rGO-rGH-2. The overall process for the fabrication of the AgCl–rGH, AgCl@rGO-rGH-1 and AgCl@rGO-rGH-2 is shown in Fig. 1.
10, mass ratio) ultrasounded for 6 h, and heated at 95 °C for 1–2 hours. After the reaction, the resulting product was washed with deionized water several times and dried by vacuum freeze-drying. This sample was named AgCl@rGO-rGH-1. Preparation of less-layer GO wrapped AgCl graphene hydrogel composites was same as preparation of AgCl@rGO-rGH-1 except that a small amount of GO prepared by Hummer's method was ultrasounded for 6 h in pH = 10 buffer solution. This sample was named AgCl@rGO-rGH-2. The overall process for the fabrication of the AgCl–rGH, AgCl@rGO-rGH-1 and AgCl@rGO-rGH-2 is shown in Fig. 1.
2.3 Photocatalyst characterization
X-ray diffractometry (XRD) was performed using a Rigaku D/MAX2500 PC diffractometer with Cu Kα radiation at an operating voltage of 40 kV and an operating current of 100 mA. The morphologies of the prepared samples were examined by transmission electron microscopy (TEM) using a Hitachi HT 7700 electron microscope operating at an accelerating voltage of 100 kV. High-resolution transmission electron microscopy (HRTEM) images were obtained using a JEM2100 field emission transmission electron microscope with an accelerating voltage of 200 kV. UV-vis light (UV-vis) diffuse reflectance spectra were recorded on a UV-vis spectrometer (Puxi, UV1901). Fourier transform infrared (FT-IR) spectra were collected using Bruker V70FTIR spectrometer in the frequency range of 4000–500 cm−1 with a resolution of 1 cm−1. X-ray photoelectron spectroscopy (XPS) was performed on a PHI 5300 ESCA system. The beam voltage was 3.0 kV, and the energy of the Ar ion beam was 1.0 keV. The binding energies were normalized to the signal for adventitious carbon at 284.8 eV. Electrochemical and photoelectrochemical measurements were performed in a three-electrode quartz cell with 0.1 M Na2SO4 electrolyte solution. A platinum wire was used as the counter electrode, and a saturated calomel electrode (SCE) was used as the reference electrode. Sample lm electrodes on ITO served as working electrodes. The photoelectrochemical experimental results were obtained with an electrochemical system (CHI-660D, China).2.4 Synergy of photocatalysis and adsorption in the degradation of BPA
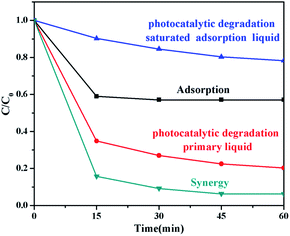
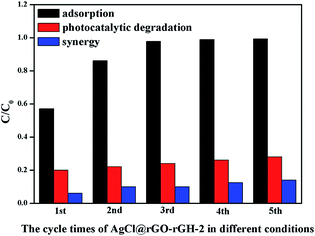
The stability test of AgCl@rGO-rGH-2: 0.1 g sample was added to, 100 mL 10 ppm BPA solution for recycling purification in different conditions, including adsorption, photocatalytic degradation saturated adsorption liquid and synergy of photocatalysis and adsorption for 60 min. The sample was not cleaned or dried in each recycle reaction. A 3 mL aliquot of the suspension mixture was taken at intervals and filtered with a filter membrane (0.45 μm) before the determination.
3. Result and discussion
3.1 Characterization of catalysts
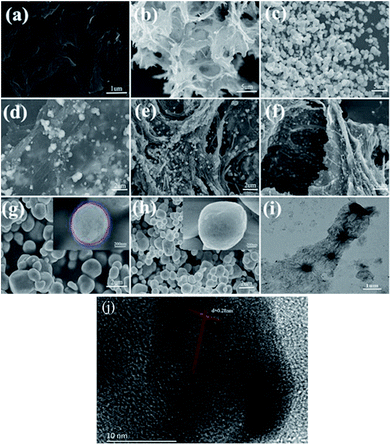
Fig. 3a–c showed the SEM images of GO, rGH, and AgCl, respectively. From these images, the morphology of GO exhibited a layer structure with a significant aggregation, which dramatically reduced the surface area of GO. In contrast, Fig. 3b reveals that rGH was composed of branches with honeycomb shapes and assembled lamella GO to three-dimensional net structure, thus providing more contact sites for AgCl nanoparticles. AgCl was observed as spherical-like particles with particle size ranging from 1 to 3 μm, which is not well controllable and could aggregate easily.Fig. 3d–f display the images of AgCl–(5 wt%)rGH, AgCl@rGO-(5 wt%)rGH-1, and AgCl@rGO-(5 wt%)rGH-2, respectively, were prepared by different methods. AgCl–(5 wt%)rGH was prepared by the impregnation method. Fig. 3d indicates that Ag and AgCl nanoparticles scattered disorderly on graphene layer surface or interlamination, in which AgCl particles had a relatively large size of approximately 400 nm while the size of Ag particles was in the range of 10 to 50 nm. Because the AgCl generation process is after the formation of graphene hydrogels, the morphology and particle size of AgCl are not controlled. Different than AgCl–(5 wt%)rGH, AgCl@rGO-(5 wt%)rGH-1 and AgCl@rGO-(5 wt%)rGH-2 were prepared by the chemical reduction method. Since the AgCl particles in these two materials were pre-coated with small amounts of GO, the structure of AgCl@GO core–shell and the morphology and stability of the AgCl were controlled to some degree. When a significant amount of GO and AgCl@GO mixed, the pre-coated AgCl could not only avoid the excessive reduction by VC but also control the neighboring graphene hydrogels by extrusion effect. As a result, as the film of AgCl and main skeleton structure of composite material, GO played a key role in controlling morphology, space filling, direction, and supporting effect.29,30
Fig. 3g and h show the SEM images of AgCl@GO treated with different methods. Fig. 3g shows SEM image of AgCl@GO-1, in which GO was only subjected to the ultrasonic treatment. It was observed that almost each AgCl particle was coated with a thin film. The thickness of the film was determined to be about 20–30 nm according to the inset in Fig. 3g. GO in AgCl@GO-2 was treated by alkali (pH = 10) and ultrasonic treatments.31 As shown in Fig. 3h, this combined treatment not only reduced the size of GO shell but also separated GO layers and reduced the amount of GO adhered on the surface of the AgCl. From the inset in Fig. 3h, GO was hard to be observed on the surface of the AgCl. Therefore, the shading effect of graphene could be significantly reduced, and the photocatalytic degradation performance of composite material AgCl@GO-2 could be dramatically improved. Fig. 3i displays the TEM image of the precursor of AgCl@GO-2, in which the sample dispersed evenly with a size of approximately 300 nm. Fig. 3j of indicated the lattice spacing of AgCl (0.28 nm) is good agreement with the crystal planes for the (2 0 0) face. In addition, AgCl and rGH are in close contact from the Fig. 3j.32
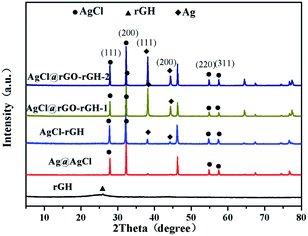
Fig. 4 displayed the XRD patterns of rGH, AgCl, AgCl–rGH, AgCl@rGO-rGH-1, and AgCl@rGO-rGH-2. The characteristic peak of rGH was clearly observed at 24.8°. The diffraction peaks at 27.9°, 32.3°, 54.8°, and 57.5° corresponded to (111), (200), (311), (222) crystal planes of AgCl, respectively.32 The diffraction peaks at 38.1° and 44.0° corresponded to (111) and (200) crystal planes of Ag, respectively. As shown in Fig. 4, the characteristic peaks of AgCl in all composites' hydrogels composites were clearly observed, which demonstrated that all the methods for the preparation of the composite were successful. However, it was found that the characteristic peaks of Ag in the sample prepared by the chemical reduction method exhibited stronger intensity, which is attributed to the excessive VC in this preparation procedure. On the other hand, compared with rGH, the characteristic peak of rGH at 24.8° was not observed in all prepared composites, which is due likely to the existence of a large amount of AgCl that fill the space of rGH and to a minor content of rGH. Quantitative analysis and purity identification were confirmed by infrared spectra33 (Fig. S1†).
X-ray photoelectron spectroscopy (XPS) analysis of AgCl@rGO-rGH-2, GO, and rGH were carried out to reveal more detail information about their element compositions and chemical states.34 Fig. S2† presents the XPS survey spectra of AgCl@rGO-rGH-2, GO, and rGH, in which the carbon and oxygen functional groups of different composites were observed.35 C/O ratio obtained from XPS roses from 2.9 to 4.9 after being reduced (GO to rGH), and from 4.9 to 5.8 after joining AgCl (rGH to AgCl@rGO-(5 wt%)rGH-2), which demonstrates that the chemical reduction method is an effective reduction method, but also indicates that the addition of AgCl may deepen the degree of reduction.31,36 Fig. S2d† represents the Ag3d region of the AgCl and AgCl@rGO-(5 wt%)rGH-2. This may be due to that the addition of VC caused a part of the Ag+ reduction to form Ag0 in the formation of the complex, causing Ag3d of the composite shifted to a higher binding energy.37
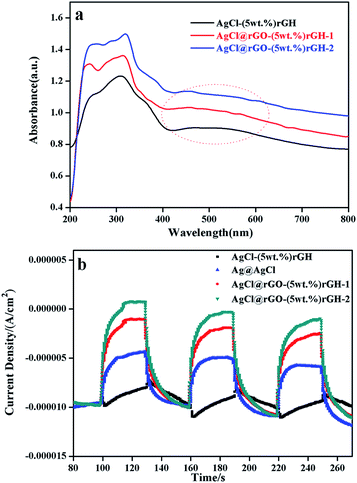
Fig. 5a displayed the UV-vis diffuse reflectance spectra of AgCl graphene hydrogels composites prepared by different methods. From the Fig. 5, these three composites had the same ratio of rGH, but all three curves in the figure appeared different degree of red shifts (AgCl–rGH is weaker, AgCl@rGO-rGH-1 and AgCl@rGO-rGH-2 are stronger). The reason for this phenomenon is that there is a certain amount of AgCl nanoparticles located on the exterior of AgCl–(5 wt%)rGH which is not loaded or coated on the rGH skeleton for AgCl–(5 wt%)rGH, resulting in the loss of a large part of AgCl nanoparticles and weakening the absorption of visible light. The samples of AgCl@rGO-rGH-1 and AgCl@rGO-rGH-2, AgCl nanoparticles are neater than the former because of the protection of rGO, making the composite materials inherit the properties of AgCl and have a strong response to visible light. In addition, since all three composite materials contained a large amount of Ag nanoparticles, they exhibited significant plasmon resonance effect.32 Fig. S3† showed the UV-vis diffuse map specific analysis of AgCl@rGO-rGH-2 composite materials containing different ratios of rGH. It was found that the light absorption of AgCl@rGO-rGH-2 increased with increasing ratio of rGH. However, the response range of visible light decreased from 540 to 420 nm, indicating that the shading effect of rGH is very strong, even the ratio of rGH is relatively low.
Fig. S4† showed the Raman spectra of AgCl@rGO-(5 wt%)rGH-2, GO, and rGH composites with an excitation of 524 nm laser light. These samples exhibited two strong peaks, which were ascribed to the disorder peak (D, centered at 1350 cm−1) and the graphitic peak (G, at 1580 cm−1).38 Compared with the ID/IG value of GO and rGH, the ID/IG value of AgCl@rGO-rGH-2 increased, suggesting that the AgCl@rGO-rGH-2 produced more defects in carbon structure.39 Which could be caused by the strong interactions between Ag and rGH, AgCl and rGH.33 This 2D-band has been widely used to identify the number of graphene layers. D + D′ and 2D was observed at 2900 cm−1 and 2700 cm−1. A sharp symmetric peak corresponds to less-layer graphene whereas broad peaks are associated with multi-layer grapheme.40,41 The in-plane crystallite size (La) can be calculated by Tuinstra–Koenig (TK) relation42 (eqn (S1)†). La of AgCl@rGO-(5 wt%)rGH-2, rGH, and GO were estimated to be 19.4, 18.1, and 16.4 nm, which is associated with increase of content of defects.43
To investigate the photoelectrochemical properties of these samples, a three-electrode electrochemical setup was used to measure the photocurrent response. Fig. 6 showed the transient photocurrent responses of pure AgCl, AgCl–rGH, AgCl@rGO-rGH-1, and AgCl@rGO-rGH-2. Among them, the photocurrent of AgCl@rGO-(5 wt%)rGH-2 was the highest, followed by the AgCl@rGO-(5 wt%)rGH-1. In addition, most of AgCl nanoparticles in AgCl–rGH are large and scatter on the surface of rGH. Consequently, the photoelectron transfer path in AgCl–rGH is longer than AgCl@rGO core–shell, and the photocurrent intensity of AgCl–rGH is the minimum. The photocurrent of rGH (5 wt%) prepared by impregnation method was smaller than that of monomer AgCl, which could be attributed to the adverse effect of AgCl–rGH composite on the separation of electrons and holes. Although these composites contain the same ratio of rGH, their photocurrent intensity varied considerably. The reason for this phenomenon is that the separation degree of photogenerated electron–hole pair in these composites is different due to their different structures.25,44 Compared with AgCl@rGO-rGH-1, the shell of AgCl@rGO-rGH-2 is thinner and the light transmission is higher because of the addition of ammonia during the preparation. For this reason, the photocurrent intensity of AgCl@rGO-rGH-2 is the highest among three materials. Fig. S5† showed a typical EIS of the prepared samples, which clearly indicates that the diameter of the arc radius on the EIS Nyquist plot of the AgCl@rGO-(5 wt%)rGH-1 and AgCl@rGO-(5 wt%)rGH-2 electrodes were much smaller than those of the AgCl–(5 wt%)rGH and AgCl electrodes under visible light irradiation. This result implied that the AgCl@rGO-(5 wt%)rGH-1 and AgCl@rGO-(5 wt%)rGH-2 photoelectrodes exhibited the fastest interfacial charge transfer and the most efficient separation of photogenerated charge carriers. Moreover, AgCl@rGO-(5 wt%)rGH-2 was treated with ammonia solution during the preparation process, which caused the rGH film to be separated to some degree. As a result, AgCl@rGO-(5 wt%)rGH-2 has a relatively smaller electric resistance and a shorter electron transfer path.45
3.2 Synergy of adsorption–photocatalysis activity
Whether can remove organic pollutants to a great extent is one of the most important indicators for purification activity of the composite material. Fig. 6 displays the removal ratio of BPA (10 ppm, 100 mL) by pure adsorption, photocatalytic degradation saturated adsorption liquid (which means that these photocatalysts are re-added to another 100 mL 10 ppm BPA and directly exposed to the light for photocatalysis after adsorption equilibrium), photocatalytic degradation primary liquid (which means that these photocatalysts are added to 100 mL 10 ppm BPA solution. Before the irradiation, the test solution was stirred in the dark for 30 min to reach the adsorption equilibrium and then exposed to the light. C0 in this represents the concentration at equilibrium, and adsorption–photocatalysis synergy with 0.1 g AgCl@rGO-(5 wt%) rGH-2. The degradation ratio by synergy function was 93.7%, which was greater than the sum rate (64.7%) of pure adsorption and photocatalytic degradation of primary liquid. This result fully demonstrated the superiority of synergy effect. It was also found that the photocatalytic degradation removal ratio of adsorption equilibrium liquid was 79.0%, whereas the removal ratio of the photocatalytic degradation primary liquid was 21.7% under the same conditions. This is mainly because the effect of adsorption of composites was not considered during the calculation of degradation removal ratio of adsorption equilibrium liquid. Although photocatalytic degradation experimental conditions were optimized, samples can inevitably adsorb BPA molecules when photocatalytic effect took place, thus increasing the adsorption quantity on the surface of the composite. Therefore, the actual photocatalytic degradation ratio is far less than 21.7%. The photocatalytic degradation ratio is only about 10.9% if we assume that the ratio of photocatalytic degradation and adsorption is 1![[thin space (1/6-em)]](https://www.rsc.org/images/entities/char_2009.gif) :
:![[thin space (1/6-em)]](https://www.rsc.org/images/entities/char_2009.gif) 1. Synergistic adsorption–photocatalytic degradation of pollutants to pollutants was adsorbed onto the surface of composites hydrogels at first, followed by degradation of pollutants, realized the synergistic effect of rapid adsorption enrichment and mineralization depth of oxidation. However, when the composites reached the adsorption equilibrium, photocatalytic degradation may be affected because the active sites are occupied.46,47
1. Synergistic adsorption–photocatalytic degradation of pollutants to pollutants was adsorbed onto the surface of composites hydrogels at first, followed by degradation of pollutants, realized the synergistic effect of rapid adsorption enrichment and mineralization depth of oxidation. However, when the composites reached the adsorption equilibrium, photocatalytic degradation may be affected because the active sites are occupied.46,47
Fig. 7a displayed saturated adsorption amount of BPA (10 ppm, 100 mL) by AgCl graphene hydrogel composite materials prepared by different methods, and an equivalent amount of AgCl (0.095 g), rGH (0.005 g). It can be seen from the Fig. 7a that the adsorption quantities of all materials except AgCl increased rapidly with increasing time, especially in the initial 10 minutes. After that, the adsorption qualities of all materials tended to saturation when the reaction occurred in 30 min. In addition, the saturated adsorption capacities of AgCl, rGH, AgCl–(5 wt%)rGH, AgCl@rGO-(5 wt%)rGH-1, and AgCl@rGO-(5 wt%)rGH-2 were 10.8%, 16.7%, 34.7%, 41.3%, 43.0%, respectively. This result could be attributed to the microporous structure of rGH that provides enough channels for the adsorption process, which ensure the adsorbate BPA to reach the interior of composite quickly, thus substantially reducing the saturated adsorption time.48 Compared to pure AgCl and rGH, the specific surface areas of all composites have a certain improvement, although they are prepared by different methods. The increased specific surface areas of AgCl@rGO-(5 wt%)rGH-1 and AgCl@rGO-(5 wt%)rGH-2 are ascribed to the interaction of AgCl and rGH. During the formation of these two composites, AgCl might provide more efficient adsorption sites on the surface of rGH but also separate the layers of rGH. Fig. 7b represented degradation of BPA by different materials. The adsorption reached equilibrium after 60 min, followed by light degradation. These results are consistent with Fig. 6 and 7a. AgCl@rGO-(5 wt%)rGH-1 and AgCl@rGO-(5 wt%)rGH-2 showed better degradation than other complexes.
Fig. 7c displayed the photocatalytic degradation of BPA (10 ppm, 100 mL) after the adsorption equilibrium on AgCl graphene hydrogel composite material prepared by different methods and an equivalent amount of AgCl (0.095 g). As shown in Fig. 7c, the AgCl@rGO-(5 wt%)rGH-2 degradation effect is best, AgCl@rGO-(5 wt%)rGH-1 followed, AgCl–(5 wt%)rGH and Ag@AgCl worst. For the composites AgCl@rGO-(5 wt%)rGH-1 and AgCl@rGO-(5 wt%)rGH-2, AgCl is wrapped by rGH tightly. The AgCl@rGO core–shell structure can not only increase the stability of AgCl by preventing the reduction of AgCl to Ag under visible light irradiation but also facilitate the transfer of electrons produced by AgCl to the surface of rGH thus shortening the electron transfer path, reducing the recombination probability of electron–hole pairs, and improving the photocatalytic activity. Compared to AgCl@rGO-(5 wt%)rGH-1, the rGH shell of AgCl in AgCl@rGO-(5 wt%)rGH-2 was treated with ammonia solution during the preparation process, which separated the rGH film to some degree. Therefore, the light transmission and the photocatalytic degradation of AgCl-core was better than those of AgCl@rGO-(5 wt%)rGH-1. In the case of composite AgCl–(5 wt%)rGH, most of the AgCl particles are anchored on the surface of rGH, whcih would convert to Ag nanoparticles under visible light irradiation. In addition, the AgCl size in AgCl–(5 wt%)rGH is bigger than those of AgCl@rGO-(5 wt%)rGH-1 and AgCl@rGO-(5 wt%)rGH-2, which results in a longer photoproduced electron transfer path in AgCl–(5 wt%)rGH, thus reducing the photocatalytic activity. For pure rGH, it does not have any photocatalytic activity because its opacity prevents the transmission of visible light.49
Fig. 7d displayed the synergistic degradation capability of BPA (10 ppm, 100 mL) on AgCl graphene hydrogel composite materials prepared by different methods and an equivalent amount of AgCl (0.095 g) and rGH (0.005 g). Although the adsorption capability of rGH is strong, it hardy transmits visible light. Therefore, the synergy of rGH is equivalent to the adsorption effect of rGH, and their synergistic degradation ratio was 33%. Since the adsorption capability of AgCl is weak, it depends on its excellent photocatalytic degradation capability to remove pollutants.32 For this reason, the synergy degradation ratio of AgCl must be close to its photocatalytic degradation ratio, which is consistent with the experimental results. Although the morphology and structure of AgCl–rGH are not very ideal due to the preparation method, AgCl–rGH composite possesses excellent adsorption and photocatalytic performance, including adsorption ratio of 35.6%, photocatalytic degradation ratio of 79.7%, and synergy degradation ratio of 85.1%.
Compared to AgCl–rGH, AgCl particles in AgCl@rGO-rGH-1 and AgCl@rGO-rGH-2 are protected by rGO during the preparation processes. The morphologies and structures of AgCl nanoparticles in AgCl@rGO-rGH-1 and AgCl@rGO-rGH-2 are better than those of AgCl–rGH, which results in their significant synergy effects. Since the rGO shell of AgCl is thinner in AgCl@rGO-rGH-2 than that of AgCl@rGO-rGH-1, the visible light is able to transmit more efficiently in AgCl@rGO-rGH-2. As a result, both the photocatalytic degradation and synergy degradation ratio of AgCl@rGO-rGH-2 are much better.
Fig. S6† showed the performance of different AgCl@rGO-(5 wt%)rGH-2 composites in the degradation of BPA from the water solution for the purpose of comparison of the adsorption and photocatalytic degradation and synergy performance. It turned out that the synergistic effects of different ratios of AgCl@rGO-rGH-2 composites are much higher than those of adsorption or photocatalysis only.
Fig. 8 showed the performance of the stability of AgCl@rGO-(5 wt%)rGH-2 with adsorption, photocatalytic degradation saturated adsorption liquid and synergy of photocatalysis and adsorption for 60 min. It was found that only adsorption reaction occurred in the composite, in which the first time adsorption ratio of BPA was 43.0% while the adsorption ratio tended to become zero after three cycles of reaction. This result implied that the adsorption sites were occupied by BPA that could not be further removed. When only photocatalytic degradation reaction occurred in the composite, the photocatalytic degradation ratio of pollutant were 79.8% and 72.1% for the first time and the last time, respectively, in which the variation is not very significant. In the adsorption–photocatalysis synergistic process, although the degradation ratio of BPA slightly decreased after each cycle run (from 93.7% to 87.0%), the final degradation ratio of 87.0% in adsorption–photocatalysis synergistic process was higher than the degradation ratio of 80.1% in the first run of photocatalytic degradation only process. These results indicated that adsorption as a means of treatment of environmental pollutants only adsorbs the target pollutants on the surface of composite materials, which cannot completely degrade the pollutants.50 In contrast, the degradation ratio of pollutants in the photocatalytic degradation reaction process did not change significantly after multiple reaction cycles. The degradation ratio only decreased by 8% after five cycles of reaction, which could be attributed to the reduction of bare AgCl particles in the composite to Ag particles under visible light irradiation. Consequently, the synergy of adsorption and photocatalysis significantly improved the reusability and maintained the performance of AgCl@rGO-(5 wt%)rGH-2 under continuous working conditions. In addition, a slight erosion of the composite is one of the reasons that degradation ratio reduced after multiple cycles of reaction.
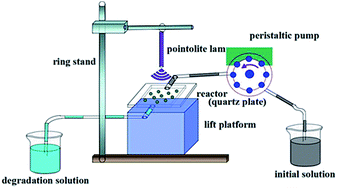
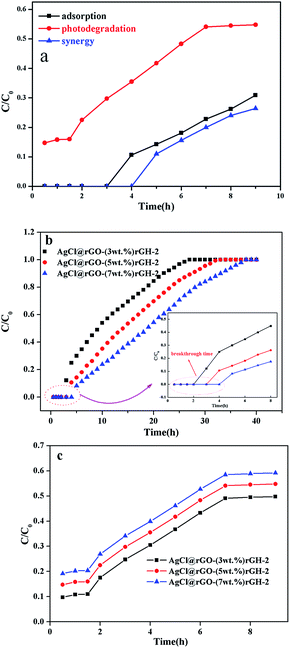
From a practical perspective, we examined the degradation activity of the composite in the continuous working conditions. The setup of mobile phase apparatus is shown in Fig. 2. Fig. 9a showed the degraded properties of 10 ppm of BPA solution by 0.5 g AgCl@rGO-(5 wt%)rGH-2 in liquid phase via simple adsorption, photocatalytic degradation, and adsorption–photocatalysis synergy. The degradation ratio of BPA was 100% within the first 3 h through the simple adsorption while the degradation ratio of BPA remained 100% within the first 4 h in the synergy process. After 9 h reaction, the BPA degradation efficiency started to stable at about 75.2%. From this result, the synergy composite is more favourable in the degradation of BPA. From this result, the synergy composite is more favorable in the degradation of BPA. Composite only in the process of synergy adsorbed BPA for 1 h more than in adsorption or photocatalytic degradation process, which also illustrated that adsorption played a significant role in the degradation of BPA.
Fig. 9b displayed the adsorption property of BPA (10 ppm) by different ratios AgCl@rGO-rGH-2 composites. As shown in Fig. 9b, the ratio of rGH in the composites significantly affected the breakthrough points of composites. In the presence of 3%, 5%, and 7% ratios of rGH, the breakthrough points of these composites were 2 h, 3 h, and 4 h, respectively. The AgCl@rGO-rGH-2 composite materials with 3%, 5%, and 7% ratios of rGH were completely saturated after 27 h, 33 h, and 38 h, respectively. These results showed that with increasing ratio of rGH, adsorption performance of composites enhanced significantly, and composites exhibited superior adsorption performance in the continuous flow conditions. Although the difference in the ratio of rGH in the composites is slight, the results of degradation performance varied markedly, which may be caused by the great specific surface of rGH.48 Fig. 9c displayed photocatalytic properties of BPA (10 ppm) by AgCl@rGO-rGH-2 with different ratios of rGH. It is worth noting that the composites reached the saturation absorption before the saturation photocatalytic degradation. Moreover, the photocatalytic performance improved with the decrease of rGH content from 7 to 3 wt%, which is associated with the shading effect of rGH. After 7 h, the photocatalytic degradation ratio of BPA remained constant, which could be caused by the reduction of AgCl to Ag in the composite. Based on the characterization and the analysis of the active data of the above photocatalysts, the possible mechanism of photocatalytic degradation was proposed. The possible photocatalytic degradation mechanism is that when Ag and AgCl are excited to produce electrons (e−) and holes (h+) when composite is irradiated by visible light. e− from Ag to AgCl and then to rGH,33 which could reacted with O2 to form ˙O2−. And ˙O2− and h+ could degrade BPA.51 Thus, e− and h+ can be effectively separated.
4. Conclusions
In summary, a novel AgCl@rGO-rGH with three-dimensional (3D) network structure was fabricated by the simple chemical reduction method. The SEM images of AgCl@GO core@shell composite showed that the prepared AgCl@rGO-rGH contained significant graphene oxide, which efficiently inhibited the reduction of AgCl particles to Ag particles, thus improving the efficient separation and transfer of photogenerated electron–hole pairs. Moreover, AgCl@rGO-rGH exhibited superb performance for the degradation of BPA from aqueous solutions under different conditions. The degradation efficiency of BPA on AgCl@rGO-rGH-2 reached 93.7% under the conditions of adsorption–photocatalysis synergy, which was mainly attributed to AgCl@rGO that significantly shortened the electron transfer path in the composite. Furthermore, after five cycles of degradation, the degradation efficiency of BPA reached 87%, while the adsorption performance tended to become zero after five cycles of degradation. After 9 h reaction, the BPA degradation efficiency started to stable at about 75.2%. The degradation activities of composites in static and continuous flow conditions demonstrated that AgCl@rGO-rGH-2 composite exhibited superior degradation activity and longer catalyst life in the continuous flow system.Conflicts of interest
There are no conflicts to declare.Acknowledgements
This work was financially supported by the National Natural Science Foundation of China (No. 51672081), Key Program of Natural Science of Hebei Province (B2016209375), Hebei Natural Science Funds for the Joint Research of Iron and Steel (B2016209348), Hebei Provincial Foundation for International cooperation (15391403D).Notes and references
- G. Mogilevsky, O. Hartman, E. D. Emmons, A. Balboa, J. B. DeCoste, B. J. Schindler, I. Iordanov and C. J. Karwacki, ACS Appl. Mater. Interfaces, 2014, 6, 10638–10648 CAS.
- J. J. Huang, W. X. Liu, L. Wang, X. M. Sun, F. W. Huo and J. F. Liu, Langmuir, 2014, 30, 4434–4440 CrossRef CAS PubMed.
- W. L. Yang, A. Lucotti, M. Tommasini and W. A. Chalifoux, J. Am. Chem. Soc., 2016, 138, 9137–9144 CrossRef CAS PubMed.
- J. C. Meyer, A. K. Geim, M. I. Katsnelson, K. S. Novoselov, T. J. Booth and S. Roth, Nature, 2007, 446, 60–63 CrossRef CAS PubMed.
- D. A. Reddy, J. Choi, S. Lee, R. Ma and T. K. Kim, RSC Adv., 2015, 5, 67394–67404 RSC.
- S. Nardecchia, D. Carriazo, M. L. Ferrer, M. C. Gutierrez and F. D. Monte, Chem. Soc. Rev., 2013, 42, 794–830 RSC.
- R. K. Upadhyay, N. Soin and S. S. Roy, RSC Adv., 2014, 4, 3823–3851 RSC.
- W. J. Liu, J. Y. Cai, Z. X. Ding and Z. H. Li, Appl. Catal., B, 2015, 174, 421–426 CrossRef.
- D. Kumar, A. Lee, T. Lee, M. Lim and D. K. Lim, Nano Lett., 2016, 16, 1760–1767 CrossRef CAS PubMed.
- Y. Zhuang, F. Yu, J. H. Chen and J. Ma, J. Environ. Chem. Eng., 2016, 4, 147–156 CrossRef CAS.
- Y. Shen, Q. Fang and B. L. Chen, Environ. Sci. Technol., 2014, 49, 67–84 CrossRef PubMed.
- D. Ravelli, D. Dondi, M. Fagnonia and A. Albini, Chem. Soc. Rev., 2009, 38, 1999–2011 RSC.
- J. Zhao, Z. Y. Wang, J. C. White and B. S. Xing, Environ. Sci. Technol., 2014, 48, 9995–10009 CrossRef CAS PubMed.
- P. N. Moza, K. Fytianos, V. Samanidou and F. Korte, Bull. Environ. Contam. Toxicol., 1988, 41, 678–682 CrossRef CAS PubMed.
- Z. Y. Sui, Y. Cui, J. H. Zhu and B. H. Han, ACS Appl. Mater. Interfaces, 2013, 5, 9172–9179 CAS.
- G. X. Zhao, L. Jiang, Y. D. He, J. X. Li, H. L. Dong, X. K. Wang and W. P. Hu, Adv. Mater., 2011, 2, 3959–3963 CrossRef PubMed.
- Y. Parent, D. Blake, K. Magrini-Bair, C. Lyons, C. Turchi, A. Watt, E. Wolfrum and M. Prairie, Sol. Energy, 1996, 56, 429–437 CrossRef CAS.
- W. J. Liu, J. Y. Cai and Z. H. Li, ACS Sustainable Chem. Eng., 2015, 3, 277–282 CrossRef CAS.
- D. A. Reddy, J. Choi, S. Lee, R. Ma and T. K. Kim, , RSC Adv., 2015, 5, 18342–18351 RSC.
- S. Vadahanambi, S. H. Lee, W. J. Kim and I. K. Oh, Environ. Sci. Technol., 2013, 47, 10510–10517 CAS.
- W. J. Han, L. Ren, L. J. Gong, X. Qi, Y. D. Liu, L. W. Yang, X. L. Wei and J. X. Zhong, ACS Sustainable Chem. Eng., 2014, 2, 741–748 CrossRef CAS.
- P. Wang, B. B. Huang, X. Y. Zhang, X. Y. Qin, H. Jin, Y. Dai, Z. Y. Wang, J. Y. Wei, J. Zhan, S. Y. Wang, J. P. Wang and M. H. Whangbo, Chem.–Eur. J., 2009, 15, 1821–1824 CrossRef CAS PubMed.
- P. Wang, B. B. Huang, X. Y. Qin, X. Y. Zhang, Y. Dai, J. Y. Wei and M. H. Whangbo, Angew. Chem., Int. Ed., 2008, 47, 7931–7933 CrossRef CAS PubMed.
- B. W. Ma, J. F. Guo, W. L. Dai and K. N. Fan, Appl. Catal., B, 2013, 130, 257–263 CrossRef.
- Y. Zhuang, J. H. Sun and M. Y. Guan, J. Alloys Compd., 2016, 662, 84–88 CrossRef CAS.
- Y. Li, W. Q. Cui, L. Liu, R. L. Zong, W. Q. Yao, Y. H. Liang and Y. F. Zhu, Appl. Catal., B, 2016, 199, 412–423 CrossRef CAS.
- X. Y. Pan and Z. G. Yi, ACS Appl. Mater. Interfaces, 2015, 79, 27167–27175 Search PubMed.
- X. Huang, X. Y. Qi, F. Boey and H. Zhang, Chem. Soc. Rev., 2012, 41, 666–686 RSC.
- Y. Y. Sun, W. H. Zhang, D. S. Li, L. Gao, C. L. Hou, Y. H. Zhang and Y. Q. Liu, J. Alloys Compd., 2015, 649, 579–584 CrossRef CAS.
- J. J. Yang, D. M. Chen, Y. Zhu, Y. M. Zhang and Y. F. Zhu, Appl. Catal., B, 2017, 205, 228–237 CrossRef CAS.
- D. Li, M. B. Muller, S. Gilje, R. B. Kaner and G. G. Wallace, Nat. Nanotechnol., 2008, 3, 101–105 CrossRef CAS PubMed.
- Y. H. Liang, S. L. Lin, L. Liu, J. S. Hu and W. Q. Cui, Appl. Catal., B, 2015, 164, 192–203 CrossRef CAS.
- P. Wang, T. S. Ming, G. H. Wang, X. F. Wang, H. G. Yu and J. G. Yu, J. Mol. Catal. A: Chem., 2014, 381, 114–119 CrossRef CAS.
- L. Liu, L. Ding, Y. G. Liu, W. J. An, S. L. Lin, Y. H. Liang and W. Q. Cui, Appl. Catal., B, 2017, 201, 92–104 CrossRef CAS.
- C. J. Miller, H. J. Yu and T. D. Waite, Colloids Surf., A, 2013, 435, 147–153 CrossRef CAS.
- Z. Y. Zeng, Z. Y. Yin, X. Huang, H. Li, Q. Y. He, G. Lu and F. Boey, Angew. Chem., Int. Ed., 2011, 50(47), 11093–11097 CrossRef CAS PubMed.
- S. T. Zhong, W. Jiang, M. Han, G. Z. Liu, N. Zhang and Y. Lu, Appl. Surf. Sci., 2015, 347, 21 CrossRef.
- N. Zhang, M. Q. Yang, S. Q. Liu, Y. G. Sun and Y. J. Xu, Chem. Rev., 2015, 115, 10307–10377 CrossRef CAS PubMed.
- M. Nawaz, W. Miran, J. Jang and D. S. Lee, Appl. Catal., B, 2017, 203, 85–95 CrossRef CAS.
- R. Ccorahua, O. P. Troncoso, S. Rodriguez, D. Lopez and F. G. Torres, Carbohydr. Polym., 2017, 171, 68–76 CrossRef CAS PubMed.
- S. S. Nanda, M. J. Kim, K. S. Yeom, S. S. An, H. Ju and D. K. Yi, TrAC, Trends Anal. Chem., 2016, 80, 125–131 CrossRef CAS.
- W. S. Si, W. Lei, Q. L. Hao, X. F. Xia, H. Zhang, J. Li and Q. H. Li, Electrochim. Acta, 2016, 212, 784–790 CrossRef CAS.
- J. J. Wu, D. Zhang, Y. Wang and B. R. Hou, J. Power Sources, 2013, 227, 185–190 CrossRef CAS.
- L. Liu, L. Ding, Y. G. Liu, W. J. An, S. L. Lin, Y. H. Liang and W. Q. Cui, Appl. Catal., B, 2016, 183, 133–141 CrossRef CAS.
- X. R. Hong, R. P. Gang, H. Jian, R. Fang, R. L. Zhen and S. Z. Feng, Carbohydr. Polym., 2016, 138, 222–228 CrossRef PubMed.
- J. J. Yang, D. M. Chen, Y. Zhu, Y. M. Zhang and Y. F. Zhu, Appl. Catal., B, 2017, 205, 228–237 CrossRef CAS.
- C. F. Mu, Y. Zhang, W. Q. Cui, Y. H. Liang and Y. F. Zhu, Appl. Catal., B, 2017, 212, 41–49 CrossRef CAS.
- Z. Y. Zhang, F. Xiao, Y. L. Guo, S. Wang and Y. Q. Liu, ACS Appl. Mater. Interfaces, 2013, 5, 2227–2233 CAS.
- M. Wen, M. Z. Cheng, S. Q. Zhou, Q. S. Wu, N. Wang and L. Y. Zhou, J. Phys. Chem. C, 2012, 116, 11702–11708 CAS.
- J. Wang, Z. M. Chen and B. L. Chen, Environ. Sci. Technol., 2014, 48, 4817–4825 CrossRef CAS PubMed.
- G. Q. Luo, X. J. Jiang, M. J. Li, Q. Shen, L. M. Zhang and H. G. Yu, ACS Appl. Mater. Interfaces, 2013, 5(6), 2161–2168 CAS.
Footnote |
| † Electronic supplementary information (ESI) available: Supplementary materials for FTIR images, XPS, UV-vis, etc. See DOI: 10.1039/c7ra06126a |
| This journal is © The Royal Society of Chemistry 2017 |


