 Open Access Article
Creative Commons Attribution 3.0 Unported Licence
Investigation on the self-assembled behaviors of C18 unsaturated fatty acids in arginine aqueous solution
Yuxian Wang a,
Ling Jiangb,
Qinke Shena,
Jian Shena,
Yuwang Hana and
Hongman Zhang*a
aCollege of Chemistry and Molecular Engineering, Nanjing Tech University, Nanjing 211816, China. E-mail: hmzhang@njtech.edu.cn; Fax: +86 5813 9216; Tel: +86 5813 9216
bCollege of Food Science and Light Industry, Nanjing Tech University, Nanjing 211816, China
First published on 25th August 2017
Abstract
In the field of drug delivery, there is growing concern over the self-assembly of fatty acids, since their structures and properties are similar to liposomes, which are characteristically nontoxic for humans, possess good biocompatibility and biodegradation, and are without immunogenicity. Changes in pH, temperature, concentration, molecular structure of the amphiphilic molecule, head group type and hydrocarbon chain length have significant effects on the self-assembled structures; however, the degree of unsaturation can also influence the self-assembled structures of fatty acids. The aggregation behaviors of the mixtures of arginine and three kinds of unsaturated fatty acids (UFAs, oleic acid, linoleic acid and linolenic acid) in aqueous solutions have been investigated. Phase transition from transparent micelles (L1 phase) to birefringent bilayer structures (Lα phase) occurred with increasing amounts of UFAs. However, the Lα phase was different for macro and micro structures. Oleic acid with only one double bond was regarded as less flexible and curved, but with higher stacking, leading to a gradual phase transition process from the vesicle phase to the stacked lamellar phase in the Lα phase region, which could be proved by cryogenic transmission electron microscopy (cryo-TEM) and polarizing microscopy observations combined with 2H-nuclear magnetic resonance (2H NMR) and rheological properties. The turbid vesicle phase with weak viscoelastic properties were only observed in linoleic acid and linolenic acid systems because UFAs with more than one double bond are easier to bend, indicating that highly curved vesicles are likely to form. Through the analysis of the proposed mechanism and FT-IR spectra, the synergistic effects of non-covalent interactions, including hydrogen bonding, electrostatic interaction, and hydrophobicity, were considered to be responsible for the aggregation behaviors. Finally, vesicles displayed their potential in encapsulating water-soluble model drugs such as calcein. The results show that drug-loaded vesicles could play a role in the potential applications in drug sustained delivery systems.
1. Introduction
The self-assembly of surfactants in solution has attracted extensive research interest both experimentally and theoretically over the past decade. The structures of these aggregates, including micelles,1,2 vesicles,3,4 bilayers,5,6 fibers7,8 etc., can influence the properties of surfactant solutions such as their solubilization ability for hydrophobic substances9 or their viscous and viscoelastic properties,10 and their performance in various applications. These self-assembled structures possess numerous applications in many fields, such as nanotechnology,10,11 environment12,13 and biomedicine.14,15In these times of sustainable development, in the search for environmentally safer surfactants researchers have turned their attention to renewable sources to replace conventional sources. Fatty acids are anionic surfactants that can be used to form catanionic surfactants by surface proton transfer in the presence of a base such as alkali metal hydroxide (NaOH and KOH) or amine components, which are supposed to be charged up by surface proton transfer.16 These fatty acids show great advantages, due to their availability in large amounts in nature and their biocompatibility, and are considered to be environmentally safer surfactants. Thus, many researchers began to focus on the self-assembly of fatty acids. Gebicki and Hicks17 mixed oleic acid and oleate together to observe the vesicles formed in aqueous solution through freeze-etched electron microscopy. Cistola18 concluded that fatty acid vesicles could be formed within a certain pH range, ca. 7–9. Walde19 reported that an unsaturated fatty acid (UFA), docosahexaenoic acid (DHA), was self-assembled into vesicles in dilute aqueous solution if the molar ratio of the neutral form of DHA to anionic DHA was kept between 1![[thin space (1/6-em)]](https://www.rsc.org/images/entities/char_2009.gif) :
:![[thin space (1/6-em)]](https://www.rsc.org/images/entities/char_2009.gif) 1 and 1
1 and 1![[thin space (1/6-em)]](https://www.rsc.org/images/entities/char_2009.gif) :
:![[thin space (1/6-em)]](https://www.rsc.org/images/entities/char_2009.gif) 3. However, long chain fatty acid salts that were formed from alkali metal hydroxide, such as NaOH and KOH, had a very low solubility in aqueous solution corresponding to a high Krafft point.20 On the contrary, the counter-ions in the presence of amines, such as tetraalkylammonium, showed a drastic increase in the solubility, compared to the alkali salt.21 Furthermore, ions of biological origin, such as choline and alkaline amino acids (lysine and arginine), have been used as counter-ions to disperse fatty acids because they exist in aqueous solution with different ionic states such as anionic, cationic and amphoteric, due to the amino groups and carboxyl groups.22–24 The self-assembled structures formed by these two kinds of biomaterials can greatly increase the solubility of fatty acids in aqueous solution by decreasing the Krafft point;16,25 on the other hand, the ion of biological origin itself provides a beneficial effect for biomedical applications.
3. However, long chain fatty acid salts that were formed from alkali metal hydroxide, such as NaOH and KOH, had a very low solubility in aqueous solution corresponding to a high Krafft point.20 On the contrary, the counter-ions in the presence of amines, such as tetraalkylammonium, showed a drastic increase in the solubility, compared to the alkali salt.21 Furthermore, ions of biological origin, such as choline and alkaline amino acids (lysine and arginine), have been used as counter-ions to disperse fatty acids because they exist in aqueous solution with different ionic states such as anionic, cationic and amphoteric, due to the amino groups and carboxyl groups.22–24 The self-assembled structures formed by these two kinds of biomaterials can greatly increase the solubility of fatty acids in aqueous solution by decreasing the Krafft point;16,25 on the other hand, the ion of biological origin itself provides a beneficial effect for biomedical applications.
Among the fatty acids, the unsaturated fatty acids (UFAs), such as oleic acid (C18:1), linoleic acid (C18:2), linolenic acid (C18:3), eicosapentaenoic acid (EPA, C20:5) and docosahexaenoic acid (DHA, C22:6), are parts of constructive components of cell membranes and of important physiological functions.26 The UFAs-based self-assembled vesicles are characteristic by nontoxicity for humans, good biocompatibility and biodegradation, and are without immunogenicity.27 They have been considered as promising carriers for drugs, food and cosmetics capsules, not only for their structures and properties similar to liposomes, which can entrap hydrophilic agents in their aqueous compartment and hydrophobic ones into their membranes,28 but also for the special physiological effects of UFAs.26 Analysis of natural membrane phospholipids from the pressure area measurements on fatty acid surface films suggested that the 12 to 22 carbon fatty acids would be suitable for the formulation of stable ufasomes.29 In fact, many research efforts have been focused on self-assembled behaviors with oleic acid as an anionic surfactant. Dowling30 developed gelatin gels containing oleic acid to create pH-sensitive nanosized vesicle-loaded gels. A vesicle-to-micelle transition occurred at higher pH and thus they could be widely applied in pH-controlled release in drug delivery systems. Berclaz31 used cryo-transmission electron microscopy (cryo-TEM) and dynamic light scattering (DLS) to investigate the matrix effect of oleic acid/oleate vesicles and mixed phosphocholine/oleic acid/oleate vesicles. Hao32 studied the phase behavior of salt-free cationic and anionic surfactant mixtures by mixing diethylenetriamine with oleic acid. In addition to the study of the physical and chemical properties, some researchers began to realize the application in drug delivery. Foziyah33 explored the potential of fatty acid vesicles for the topical delivery of fluconazole, which was prepared by film hydration method using oleic acid as a fatty acid principal component. Jiang34 used oleic acid as the biocompatible surfactant to react with drug molecules for the straightforward fabrication of catanionic vesicles.
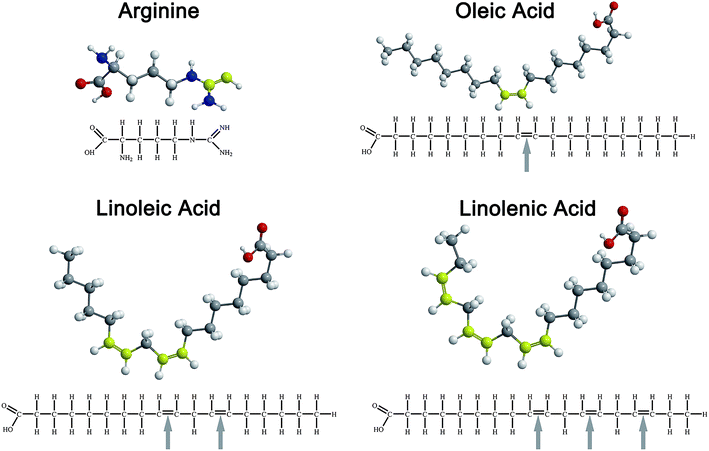
So far, most of the research work on UFAs has focused on the self-assembly behavior of oleic acid. Actually, due to differences in the numbers of double bonds in the molecular structure of UFAs, the geometry configuration of the molecule will present differences even with the same carbon-chain, such as oleic acid (C18:1), linoleic acid (C18:2) and linoleic acid (C18:3), as shown in Fig. 1, which will definitely influence the self-assembled behaviors of UFAs. Based on this, we systematically investigated the self-assembly of C18 UFAs in the mixture of arginine in aqueous solution, aiming at comparing the aggregation behaviors of these UFAs with different degrees of unsaturation, which result from the variation of molecular packing caused by the bending of double bonds. Meanwhile, the potential of the vesicles constructed by UFAs and arginine for drug delivery was preliminarily evaluated as well. The aim of this meaningful work is to provide basic information for developing a kind of biocompatible drug delivery system, not only to encapsulate either hydrophilic or hydrophobic drugs, but also to take the effects of both UFAs and amino acid in organisms.
2. Results and discussion
The aggregation behaviors of arginine (Arg) with C18 unsaturated fatty acids (UFAs) in aqueous solution were systematically investigated to study the influence of the degrees of unsaturation on self-assembly. This basic amino acid has one carboxyl group, one amino group and one guanidine group, and it can form a homogeneous and transparent solution in aqueous media due to the high hydrophilicity and solubility of the molecule. When fatty acids were added, they were deprotonated by the amino groups to form anionic species, hence, the solubilities of the fatty acids in aqueous media were greatly increased. Meanwhile, with the variation of fatty acid concentration, the different aggregation behaviors could be observed through the acid-based reaction and non-covalent interactions.2.1 Phase behavior of the Arg/UFAs/H2O system
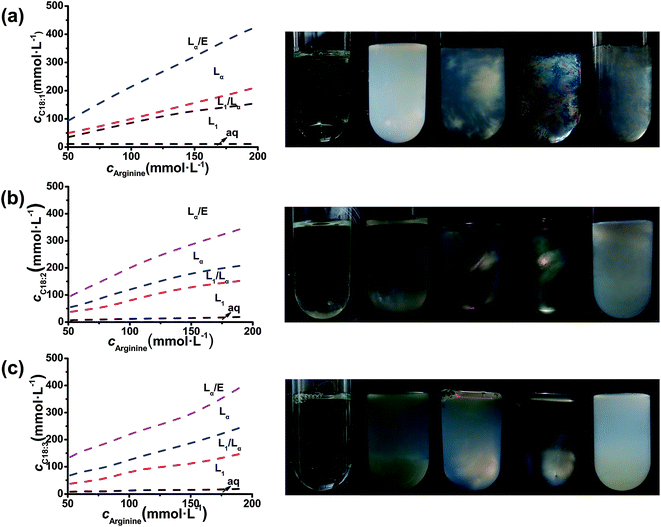
The phase behaviors of the Arg/UFAs/H2O system can be investigated at room temperature because they have lower melting points and exist as liquids, compared to the C18:0 saturated fatty acid (Table 1). As shown in Fig. 2, the curves on the left are the phase diagrams with the changing compositions. At a fixed concentration of Arg, with the addition of UFAs, the homogeneous L1 (micelles) phase solutions were formed at first, which was confirmed by the solubilization of Sudan II.36 The transparent micelles exhibited very good viscoelasticity. After the L1 phase region, the birefringent Lα (vesicles) phase occurred at the bottom of the solutions in the L1/Lα region, and extended to form single Lα phase solutions. Finally, the Lα/emulsion phase appeared with the excess of UFAs. Sometimes, a sponge phase could be observed after the vesicle phase in different fatty acid systems; it was found by Li et al.36 in the mixtures of octanoic acid and lysine solutions, which was confirmed by freeze fracture-transmission electron microscopy.| C18 UFAs | Structure and degrees of unsaturation | Melting point (°C) | Observed pKa35 |
|---|---|---|---|
| Steric acid | 18:0 | 54–57 | 10.0 |
| Oleic acid | 18:1; (cis)9 | 13–14 | 9.85 |
| Linoleic acid | 18:2; (cis)9,12 | −5 to −1 | 9.24 |
| α-Linolenic acid | 18:3; (cis)9,12,15 | −11 to −10 | 8.28 |
The photographs of typical samples with crossed polarizers (Fig. 2, right) exhibited the phase transition processes. At a fixed concentration of Arg at 100 mmol L−1, when the molar ratio (nArg![[thin space (1/6-em)]](https://www.rsc.org/images/entities/char_2009.gif) :
:![[thin space (1/6-em)]](https://www.rsc.org/images/entities/char_2009.gif) nUFAs) was below 1
nUFAs) was below 1![[thin space (1/6-em)]](https://www.rsc.org/images/entities/char_2009.gif) :
:![[thin space (1/6-em)]](https://www.rsc.org/images/entities/char_2009.gif) 1, the transparent L1 phase appeared, and then the slightly turbid bluish Lα phase was observed when the molar ratio was below 1
1, the transparent L1 phase appeared, and then the slightly turbid bluish Lα phase was observed when the molar ratio was below 1![[thin space (1/6-em)]](https://www.rsc.org/images/entities/char_2009.gif) :
:![[thin space (1/6-em)]](https://www.rsc.org/images/entities/char_2009.gif) 2, which showed a colorful birefringent texture. At higher UFA contents, the excess UFAs separated from the bulk aqueous solutions to form o/w emulsions. The Arg/UFAs/H2O systems with the different degrees of unsaturation, oleic acid, linoleic acid and α-linolenic acid, exhibited different birefringent textures. For the oleic acid system, the turbid and bright strips between crossed polarizers were observed at 150 mmol L−1, and then it changed to transparent and colorful patterns at 200 mmol L−1, indicating the changes in the microstructures in the Lα phase region. However, the colorful patterns for the other two systems did not appear at all; we only observed the weak birefringent texture after shaking the samples for the linolenic acid system. The results demonstrated that with the existence of more double bonds in the fatty acid, the less rich phase behavior appeared. This difference in phase transition caused by double bonds is related to the structure of UFAs (Fig. 1). The existence of one or more double bonds in the hydrocarbon chain in UFAs results in one or more “bends” in the molecule.37 The geometry of the double bond is almost always a cis configuration in natural fatty acids. The more double bonds the chain has in the cis configuration, the less packed it is. In other words, when a chain has many cis bonds, it becomes quite curved in its most accessible conformations. For example, oleic acid, with one double bond, has a “kink” in it, whereas linoleic acid, with two double bonds, has a more pronounced bend. α-Linolenic acid, with three double bonds, favors a hooked shape. Therefore, it seems that polyunsaturated fatty acids with more than one double bond form highly curved vesicles more easily, without further phase transition in the Lα phase region under the same conditions.
2, which showed a colorful birefringent texture. At higher UFA contents, the excess UFAs separated from the bulk aqueous solutions to form o/w emulsions. The Arg/UFAs/H2O systems with the different degrees of unsaturation, oleic acid, linoleic acid and α-linolenic acid, exhibited different birefringent textures. For the oleic acid system, the turbid and bright strips between crossed polarizers were observed at 150 mmol L−1, and then it changed to transparent and colorful patterns at 200 mmol L−1, indicating the changes in the microstructures in the Lα phase region. However, the colorful patterns for the other two systems did not appear at all; we only observed the weak birefringent texture after shaking the samples for the linolenic acid system. The results demonstrated that with the existence of more double bonds in the fatty acid, the less rich phase behavior appeared. This difference in phase transition caused by double bonds is related to the structure of UFAs (Fig. 1). The existence of one or more double bonds in the hydrocarbon chain in UFAs results in one or more “bends” in the molecule.37 The geometry of the double bond is almost always a cis configuration in natural fatty acids. The more double bonds the chain has in the cis configuration, the less packed it is. In other words, when a chain has many cis bonds, it becomes quite curved in its most accessible conformations. For example, oleic acid, with one double bond, has a “kink” in it, whereas linoleic acid, with two double bonds, has a more pronounced bend. α-Linolenic acid, with three double bonds, favors a hooked shape. Therefore, it seems that polyunsaturated fatty acids with more than one double bond form highly curved vesicles more easily, without further phase transition in the Lα phase region under the same conditions.
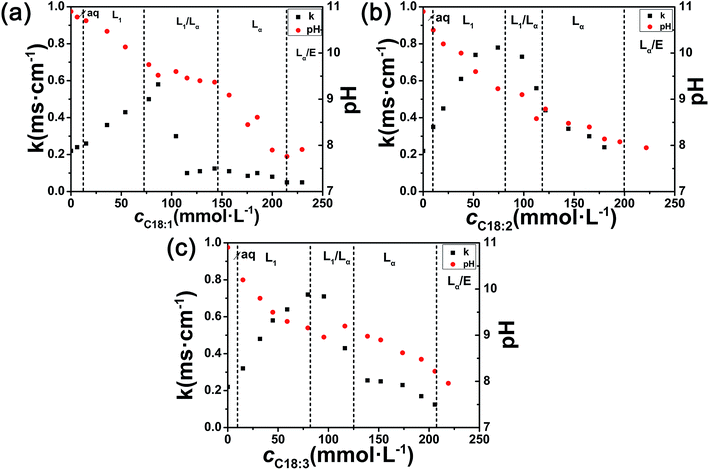
The phase transition could also be reflected by the changes in pH and conductivity presented in Fig. 3. It is well known that amino acids exist as zwitterions in aqueous solution within a certain range of pH.38 The Arg aqueous solution had a high pH value, ca. 11.0, showing a rather strong basicity. The pH decreased gradually with the continuous addition of UFAs, and reached a stable value below 8.0 at excess UFAs. Due to the acid–base reaction, these three Arg/UFAs/H2O systems had a similar pH value range (∼8–9) in the Lα region. At the same time, the tendencies for conductivity changes were similar among the three systems. The conductivity increased with the increase in UFAs concentrations in the L1 phase, because of the transition of Arg from zwitterionic form to cationic form and the increasing carboxylate ions with the addition of UFAs. It was worth noting that a sharp decrease in conductivity appeared in the L1/Lα two-phase region, which could be used to determine the phase boundary in the phase diagram. The reason might be ascribed to the formation of vesicles, for which the ions could be entrapped in the water layers and cores in vesicles, which could therefore weaken the conductivity capability. The conductivity maintained rather low values in the Lα phase, and finally reached a rather stable value. Compared to oleic acid, the conductivities of linoleic acid and linolenic acid were higher and the values reached 0.8 and 0.7 ms cm−1 almost at the same concentration, respectively, while the pH values were lower than oleic acid because of the lower pKa values. Interestingly, we found that for oleic acid, the L1/Lα region was wider, compared to linoleic acid and linolenic acid, while the Lα region was exactly the opposite, which corresponds to the phase diagrams (Fig. 2). All of the changes may also ascribe to the chemical and physical properties induced by the degrees of unsaturation.
In order to explain the different morphologies of self-assemblies of amphiphiles in aqueous solutions, a well-known theory called critical packing parameter (Pc) was proposed by Israelachvili et al.:39
 | (1) |
2.2 Microstructure observation
The samples in the birefringent Lα phase region were observed by polarizing microscopy and cryo-TEM. Typical pictures of the Lα phase are presented in Fig. 4 and we can clearly see the typical Maltese crosses, indicating the formation of lamellar structures.5 At a fixed concentration of Arg at 100 mmol L−1, the shape of the oleic acid vesicle at 150 mmol L−1 was a regular circle (Fig. 4a), revealing the formation of spherical vesicles, while for the 200 mmol L−1 sample, the vesicles were out of shape (Fig. 4b). This difference of aggregation structures was demonstrated by cryo-TEM observations, which is a powerful tool that enables an unambiguous observation of the surfactant self-assembled structure in their hydrated states.40 As shown in Fig. 4c and d, polydisperse vesicles with diameters from 100 nm to near 500 nm were clearly observed. It can be seen that most were unilamellar vesicles. The vesicles were likely to be slightly deformed, indicating the flexibility of the vesicle bilayers, which is often found in hydrocarbon surfactant systems.41 When the oleic acid concentration increased to 200 mmol L−1, we could not observe the microstructures because the thin films were hard to form when the excess solution was bolted with two pieces of filter paper, due to the high viscoelasticity of the system.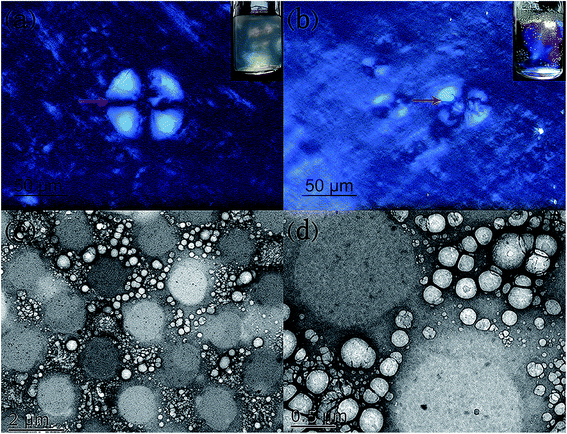 | ||
| Fig. 4 Typical polarized images (a and b) and cryo-TEM (c and d) images of the Lα phase with cArg = 100, c(C18:1) = 150 (a, c and d) and 200 (b) mmol L−1. | ||
2.3 Rheological properties
The viscosity properties of the Arg/UFAs/H2O system can be characterized by rheological properties. Steady and oscillatory shear experiments were performed to detect the changes in the microscopic structures. Fig. 5 illustrates the variation in viscosity via the shear rate at cArg = 100 mmol L−1. All of the samples' apparent viscosities decreased with the increase in shear rate. In the micelle region, the sample with cC18:1 = 60 mmol L−1 possessed rather low viscosity, which then increased by 10 times when the concentration reached 80 mmol L−1. This might be ascribed to the formation of worm-like micelles.42 Within the Lα phase region, the samples showed shear thinning behavior, which was typical for vesicle solutions.5 Moreover, with the increase in the oleic acid concentration, the viscosity increased. This might be ascribed to the increasing vesicles density, due to the formation of vesicles with the addition of oleic acid. With further addition of oleic acid, at cC18:1 = 210 mmol L−1, the viscosity did not change more because of the formation of the lamellar phase (Lαl).43 Linoleic acid and linolenic acid exhibited very low viscosities even at higher concentrations, which reflected the formation of small low-density vesicles.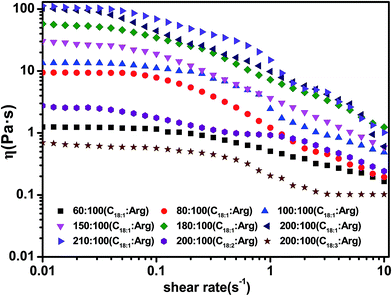 | ||
| Fig. 5 Viscosity changes with different concentrations and UFAs at cArg = 100 mmol L−1. T = 25.0 ± 0.1 °C. | ||
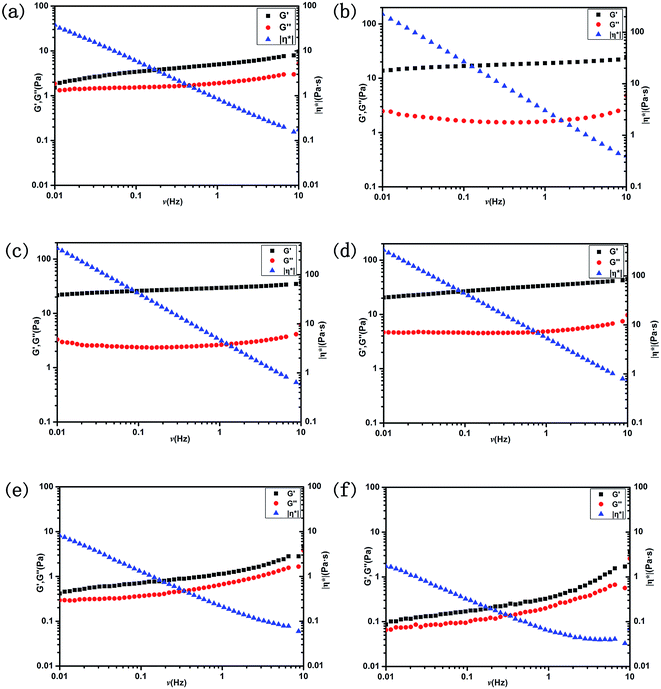
The viscoelastic properties for six typical selected samples were detected by dynamic rheological measurements. As shown in Fig. 6, the storage modulus (G′) and loss modulus (G′′), which were often used to describe whether the fluid was mainly dominated by viscosity or elasticity, were almost independent of the frequency within the range 0.01–10 Hz. However, the complex viscosity |η*| linearly decreased within the studied frequency range. The G′ was found to be higher than G′′, presenting an elastic dominant property. For the C18:1 system, in the L1 phase region (Fig. 6a), G′ and G′′ were in the same order of magnitude. In the Lα phase region (Fig. 6b–d), G′ was about an order of magnitude higher than G′′, which was the typical characteristic of vesicle solutions. With the increasing amount of C18:1, G′ and G′′ both increased, being consistent with the steady rheological results. For the polyunsaturated fatty acids (C18:2, C18:3) (Fig. 6e and f) at the concentration of 200 mmol L−1 in the Lα phase region, the results showed very low complex viscosity and modulus. Both G′ and G′′ were lower than 5 Pa and even lower than C18:1 in the L1 phase region, representing the rather low viscoelasticity. The difference in rheological properties can also be ascribed to the structures of UFAs. As described previously, the bending of double bonds can lead to the folding of molecules, which will affect the packing of the molecules, and thus impact the physical properties. By comparing the three fatty acids, oleic acid is considered to be less flexible, with higher stacking and less curvature leading to rather high viscoelasticity. In contrast, molecules with two or more unsaturations are more flexible and the membranes become more fluid-like, resulting in the formation of vesicles with higher curvature and lower viscoelasticity.
2.4 2H NMR
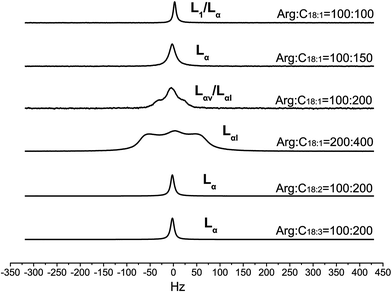
2H NMR experiments were carried out to study the anisotropy of the lamellar phase in aqueous solution at room temperature. The 2H NMR technology supplies the information about the motion averaged electric quadrupole couplings between the deuterium nuclei and the electric field gradients around the nucleus;44 this interaction is ascribed to the motion of D2O molecules and is sensitive to the interface of the surfactant assemblies.45 For a macroscopically anisotropic solution, D2O molecules at the anisotropic site experience a nonzero average of the quadrupole interaction, leading to a splitting of resonance, while for an isotropic environment, the interaction has a zero average due to the fast molecular motion and only a single sharp peak is obtained. Fig. 7 shows quadrupolar nuclear magnetic resonance spectra induced by the changes in concentrations and components. For oleic acid, when the Arg concentration was fixed at 100 mmol L−1, with the increase of the oleic acid concentration, the sharp peak (L1/Lα) gradually became wide (Lα), and finally a doublet quadrupole splitting was observed in the spectrum due to the long-range ordered anisotropic bilayer structure, which revealed the coexistence phase of vesicles and lamellar phase (Lαv/Lαl).46 In order to observe the 2H NMR spectra of single Lαl, we doubled the concentrations of Arg and oleic acid to 200 and 400 mmol L−1, respectively. Interestingly, an apparent doublet quadrupole splitting peak was observed, indicating the formation of lamellar structure.43 For linoleic acid and linolenic acid, the water molecules bounded at the interface of curved bilayers exhibited local anisotropy, but a long-range isotropy; only a single narrow peak was observed in the spectrum.2.5 Surface tension
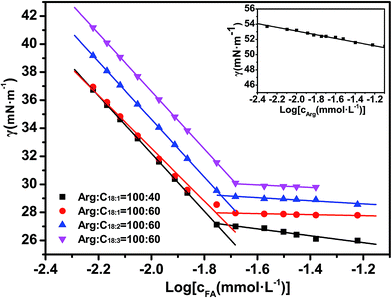
The change in hydrophobicity can be reflected by surface activity. The surface tensions of Arg–UFAs mixtures are shown in Fig. 8. The chosen samples were in the region of the L1 phase. The critical micelle concentration (cmc) and surface tension at cmc (γcmc) were identified to evaluate the efficiency and the effectiveness of surfactants to reduce the surface tension, respectively. Arg had a very poor surface activity, which was shown in the inset in Fig. 8. When fatty acids were added to Arg solution, both the cmc value and γcmc obviously decreased, indicating the enhancement of surface activity, which could be ascribed to the formation of electrostatic interactions and hydrogen bonding. When the molar ratio of Arg and oleic acid was increased from 100![[thin space (1/6-em)]](https://www.rsc.org/images/entities/char_2009.gif) :
:![[thin space (1/6-em)]](https://www.rsc.org/images/entities/char_2009.gif) 40 to 100
40 to 100![[thin space (1/6-em)]](https://www.rsc.org/images/entities/char_2009.gif) :
:![[thin space (1/6-em)]](https://www.rsc.org/images/entities/char_2009.gif) 60, the surface tension showed very little difference. However, the degrees of unsaturation played an important role in influencing the surface activity. In general, the hydrophobicity of the aliphatic chain will be weaker if the number of unsaturated bonds is higher; therefore, oleic acid molecules with only one double bond in the aliphatic chain had a small cmc (0.018 mmol L−1) and γcmc (27.87 mN m−1), which exhibited stronger hydrophobic properties, hence they were less soluble in aqueous solution. On the contrary, linolenic acid molecules that correspond to three unsaturated bonds had the highest cmc (0.021 mmol L−1) and γcmc (30.11 mN m−1), owing to the fact that they had the weakest hydrophobic property.
60, the surface tension showed very little difference. However, the degrees of unsaturation played an important role in influencing the surface activity. In general, the hydrophobicity of the aliphatic chain will be weaker if the number of unsaturated bonds is higher; therefore, oleic acid molecules with only one double bond in the aliphatic chain had a small cmc (0.018 mmol L−1) and γcmc (27.87 mN m−1), which exhibited stronger hydrophobic properties, hence they were less soluble in aqueous solution. On the contrary, linolenic acid molecules that correspond to three unsaturated bonds had the highest cmc (0.021 mmol L−1) and γcmc (30.11 mN m−1), owing to the fact that they had the weakest hydrophobic property.
2.6 Proposed mechanism
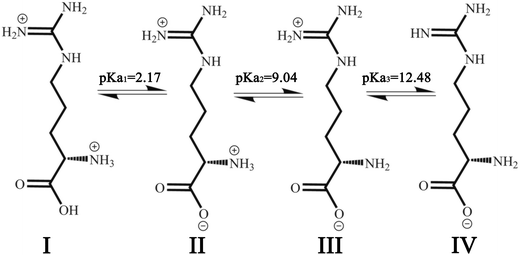
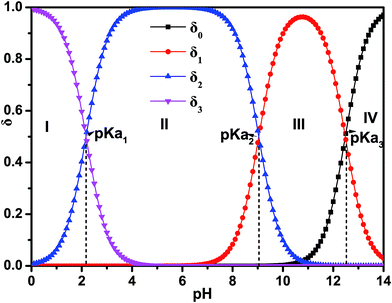
L-Arg can exhibit ionization not only at the amino-carboxylic groups, but also at the guanidinium portion.47 The degree of protonation can be changed with varying the acidity or basicity; thus, four different species can be available for L-Arg, as shown in Fig. 9. According to the three different dissociation constants of L-Arg, pKa1 (–COOH) = 2.17, pKa2 (–NH3) = 9.04, pKa3 (guanidine group) = 12.48,48 the distribution coefficient (δ) of L-Arg as a function of pH value in aqueous solution is calculated as follows:where the brackets “[ ]” refer to the concentrations of the corresponding components in the brackets. The distribution curves of L-Arg ionic states were drawn as in Fig. 10. It can be seen from the distribution curves that when the pH is below 2, L-Arg will exist as a totally protonated state (type I); when the pH is between 3–8, species II is the major form, which exists as zwitterions with a charge on the guanidinium group; species III shows no charge in the solution when the pH is up to 10–12; species IV only appears when the pH is higher than 13. In our Arg/UFAs/H2O system, species II could be observed because this species is the thermodynamically more stable species and thus has the highest probability to be present in aqueous solution under physiological conditions.
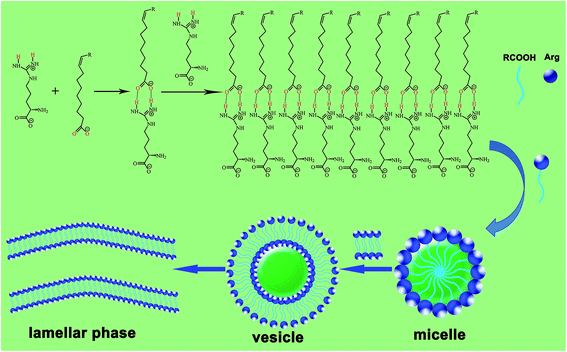
The Arg/C18:1/H2O system was chosen to illustrate the interactions between Arg and UFAs in the aggregation process. The proposed model for the interactions in aqueous solutions is shown in Scheme 1. In pure Arg solution, the guanidine group in the side-chain shows high alkalinity, existing in protonated species III in aqueous solution, and can easily form double hydrogen bonds with carboxyl acids. With the increase in oleic acid, the –NH2 group connected to the –COOH group is protonated by the H+ dissociated from fatty acids to form ion-pairs through the strong electrostatic interaction. Another hydrogen bond is considered to exist between oleic acid and deprotonated oleate anions. Finally, induced by the hydrophobicity of the hydrocarbon chains of fatty acids, micelles, vesicles and lamellar phase are formed with the change of composition. Therefore, the formation of the self-assembled structures is mainly driven by the synergistic effects of electrostatic interaction, hydrogen bonding and hydrophobic interaction.
FT-IR spectroscopic studies were conducted to detect the hydrogen bonding in mixtures. Fig. 11 shows the FT-IR spectra of pure Arg solution (a), oleic acid (b), and ion-pair compounds formed from Arg and oleic acid (c). For the complex (curve c), firstly the stretching vibration band of –NH2 disappeared, which was located at 3430 cm−1 for Arg solution, instead of a new band at 3260 cm−1. It can be presumed that this broad band is the asymmetric stretching vibration of –NH3+. Two obvious peaks appeared at 1698 cm−1 and 1639 cm−1, respectively, corresponding to the –COOH stretching peak at about 1710 cm−1 (curve b) and the –COO− (curve a) stretching peak at 1650 cm−1. The hypsochromic shift of these two absorption peaks could be attributed to the formation of hydrogen bonding between the carboxyl group and guanidinium group (Scheme 1). All these characteristic absorption bands confirmed that Arg molecules accepted protons donated by oleic acid molecules, thus forming the ion-pair compounds through elastic electrostatic interactions and then the aggregates self-assembled by hydrogen bonding and hydrophobicity.
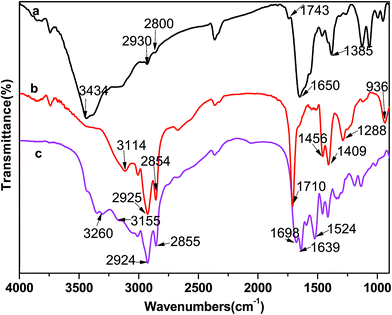 | ||
| Fig. 11 FT-IR spectra of Arg (a), oleic acid (b), ion-pair compounds formed from Arg and oleic acid (c). | ||
2.7 In vitro release study
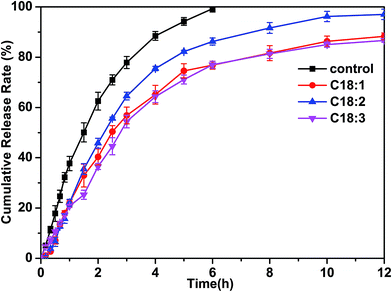
Vesicles are of technological interest for potential application in various areas such as the cosmetic industry, nanostructured systems and especially in drug delivery systems. Vesicles can simultaneously encapsulate hydrophilic drug molecules in the core of the vesicle and hydrophobic drugs in the hydrophobic membrane (Scheme 1). In order to investigate the effect of the drug release rate, we utilized vesicles formed from Arg/UFAs/H2O to encapsulate the water-soluble model drug, calcein, which is generally a fluorescent dye used for entrapment in drug delivery.49 The drug-release profiles of drug-loaded vesicles in the phosphate buffered solutions (PBS, pH 7.4) are shown in Fig. 12. It was observed that pure calcein (control) was rapidly released into the buffer, and reached about 90% within 4 hours. For drug-loaded vesicles, however, only 70% calcein was released for C18:2 and 60% for C18:1 and C18:3, when the molar ratio of Arg and oleic acid was 1![[thin space (1/6-em)]](https://www.rsc.org/images/entities/char_2009.gif) :
:![[thin space (1/6-em)]](https://www.rsc.org/images/entities/char_2009.gif) 1.5. Finally, the release rate was stabilized at 85% for C18:1 and C18:3. The results indicate that the vesicles displayed potential in encapsulating the water-soluble drug. As shown in Scheme 1, the vesicles bilayered membrane enclosed an aqueous core, and both water and drugs could be successfully entrapped within the vesicles. The hydrophilic drugs could be entrapped in the central aqueous core of the vesicles. Moreover, hydrophobic drugs can also be entrapped within the bilayered membrane. In this case, firstly, the drug molecules moved into the core of the vesicles and then moved out to the solution until they achieved dynamic equilibrium. Finally, the drug diffused from the dialysis bag into the buffer. Thus, the transport of the free drug molecules across the dialysis bag reduced the concentration of free drug, leading to the gradual release of drug molecules. The relatively slow release suggested that the model drug entrapment and its subsequent release were not largely influenced by time and could be easily applied in the pharmaceutical industry.
1.5. Finally, the release rate was stabilized at 85% for C18:1 and C18:3. The results indicate that the vesicles displayed potential in encapsulating the water-soluble drug. As shown in Scheme 1, the vesicles bilayered membrane enclosed an aqueous core, and both water and drugs could be successfully entrapped within the vesicles. The hydrophilic drugs could be entrapped in the central aqueous core of the vesicles. Moreover, hydrophobic drugs can also be entrapped within the bilayered membrane. In this case, firstly, the drug molecules moved into the core of the vesicles and then moved out to the solution until they achieved dynamic equilibrium. Finally, the drug diffused from the dialysis bag into the buffer. Thus, the transport of the free drug molecules across the dialysis bag reduced the concentration of free drug, leading to the gradual release of drug molecules. The relatively slow release suggested that the model drug entrapment and its subsequent release were not largely influenced by time and could be easily applied in the pharmaceutical industry.
3. Experiment section
3.1 Chemicals and materials
Oleic acid (C18:1) was purchased from Sigma (95%, AR). Linoleic acid (C18:2) was purchased from Wu Han Fortuna Chemical Co. Ltd. (95%, AR). α-Linolenic acid (C18:3) was purchased from J&K Chemical Reagent Co. Ltd. (97%, AR). Arginine (Arg) was purchased from Aladdin (98%, AR). All of the other reagents used in this work were of analytical grade and were used as purchased without further purification.3.2 Phase behavior study
Phase behavior was studied by visual inspection with the help of crossed polarizers. Sample solutions were prepared by adding different ratios of UFAs to arginine aqueous solution, and then stirring until all the fatty acid dissolved. All samples were frozen at −20 °C and then heated at 50 °C for at least 10 min. This process was repeated three times and the samples were finally stored at room temperature for 4 weeks.3.3 Surface tension measurements
Surface tension measurements were performed on a fully automated surface and interface tensiometer-A101 (Kino Company, USA) using the ring method at room temperature. The adopted method was dilution. Twenty milliliters of micelle solution were measured firstly, and then a known volume of water was added and stirred, and the concentration calculated. The time interval between each measurement was 5 min and the ring was fired after each test.3.4 Conductivity and pH measurements
Conductivity measurements were performed on a DDS-11A conductivity meter with a DJS-1 platinum-black electrode at room temperature. The pH value was determined on a PHS-25 pH meter with an E-201-9 glass electrode at room temperature after the measurement of conductivity.3.5 Rheological measurements
Rheological measurements were carried out on a Physica MCR 302 Rheometer with a cone-plate system (CP50-1). In steady shear experiments, the shear rate was typically increased from 0.01 to 10 s−1. In oscillatory measurements, an amplitude sweep at a fixed frequency of 1 Hz was performed prior to the frequency sweep in order to ensure the selected stress was in the linear viscoelastic region. The rheometer was connected to the water bath for controlling the temperature (25.0 ± 0.1 °C), and the samples were equilibrated for 5 min before every measurement.3.6 Cryogenic-transmission electron microscopy (cryo-TEM) observations
The vesicle phase solution with low viscosity was determined by cryogenic transmission electron microscopy (cryo-TEM). The samples were prepared in a controlled-environment vitrification system (Gatan, USA) at room temperature under 90% relative humidity. During the process, a micropipette was used to load 1 μL of solution onto a copper grid coated with carbon film. The excess solution was bolted with two pieces of filter paper, resulting in the formation of very thin films suspended on the mesh holes. After 10 s, the samples were quickly plunged into liquid ethane cooled by liquid nitrogen. The vitrified samples were transferred to a cryogenic specimen holder (Gatan 626), and then examined with a Tecnai 12 TEM operated at 120 kV.3.7 Polarizing microscopy observations
Polarized observations were performed by a Leica DM RXL (LEICA, Germany) microscope. Several drops of solution were placed into a glass trough, which was covered by another glass slide to avoid solvent evaporation.3.8 2H NMR measurements
2H NMR spectra were recorded on a Bruker Avance 400 spectrometer equipped with pulse field gradient module operating at a deuterium frequency of 61.4 MHz in a 9.4 T magnetic field, and were controlled by Bruker Topspin 2.0. The samples were prepared in D2O, and were placed in 5 mm NMR tubes left at 25.0 ± 0.1 °C for 4 weeks for equilibration. Spectra were obtained by Fourier transform using a single pulse sequence, without field frequency lock.3.9 Spectral measurements
Infrared spectra were recorded on a Fourier transform infrared spectrometer (Thermo Scientific Nicolet iS50, Thermo Fisher Scientific Inc., KBr beamsplitter) with a resolution of 2 cm−1 at room temperature. Samples were freeze dried before testing.3.10 Calcein entrapment experiments
The water soluble model drug, calcein (0.5 mg mL−1), was dissolved in 50 mmol L−1 arginine solution, and then drug-loaded vesicles were obtained in the presence of different amounts of UFAs (150 mmol L−1) by stirring for 12 hours at room temperature. The unloaded free drug was removed by dialysis using a dialysis membrane bag with molecular weight cut-off of ∼3500 Da according to a reported procedure.50 The dialysis membrane bag of 5 mL drug-loaded vesicles was immersed in 500 mL of phosphate buffer solution (PBS) and dialyzed at room temperature with 200 rpm of stirring. Fresh PBS (3 mL) was added 6 times in 2 hours (20 min each). For calcein release experiments, 1.0 mL drug-loaded vesicles were sealed in a dialysis membrane bag, and incubated at 37.0 ± 0.5 °C in 50 mL PBS at pH = 7.4, which is similar to the pH of human blood. The solution was continuously stirred at 100 rpm. At selected time intervals, 1.0 mL of solution was withdrawn from the release media and replaced by the same amount of fresh buffer. The solution was assayed by a UV spectrophotometer at a wavelength of 495 nm, which is the typical absorbance peak of calcein. For comparison, the release of the pure calcein in the release medium was also investigated.4. Conclusion
In summary, the self-assembly properties, phase behavior and potential application of biological molecules, arginine and three different UFAs, were investigated in detail. The results clearly demonstrate that the degree of unsaturation has a significant effect on the self-assembled structures. Oleic acid, with one double bond, exhibited rich phase behavior—the phase transition from the vesicle phase to stacked lamellar phase in the Lα region, which was proved by cryogenic transmission electron microscopy (cryo-TEM) and polarizing microscopy observations combined with 2H-nuclear magnetic resonance (2H NMR). The rich phase transition could not be observed in polyunsaturated fatty acid systems because polyunsaturated fatty acids always exist in a cis conformation naturally, and are susceptible to bending and kinking, preventing the cis-fatty acids from packing closely together. Thus, higher curvature vesicles were formed with the increase in double bonds, which was reflected in the rheological properties. All of these self-assembled structures (micelles, vesicles and lamellar phase) were formed in the presence of synergetic effects of electrostatic interactions, hydrogen bonding, and hydrophobicity. Finally, the drug release behavior results indicated that drug-loaded vesicles were formed through Arg/UFAs/H2O spontaneously, rather than by mechanical processes like liposomes, exhibiting sustained drug release properties. Considering the applications of amino acids and unsaturated fatty acids in many fields, we hope the results from the current study will have potential applications in drug delivery systems.Conflicts of interest
There are no conflicts to declare.Acknowledgements
This work was financially supported by the National Natural Science Foundation of China (No. 21176124 and U1603112).References
- T. Zemb, M. Dubois, B. Deme and T. Gulik-Krzywicki, Science, 1999, 283, 816–819 CrossRef CAS PubMed.
- J. Yu, X. Xie, X. Xu, L. Zhang, X. Zhou, H. Yu, P. Wu, T. Wang, X. Che and Z. Hu, J. Mater. Chem. B, 2014, 2, 2114–2126 RSC.
- M. Antonietti and S. Förster, Adv. Mater., 2003, 15, 1323–1333 CrossRef CAS.
- R. Goel, S. Gopal and A. Gupta, J. Mater. Chem. B, 2015, 3, 5849–5857 RSC.
- Z. Yuan, S. Dong, W. Liu and J. Hao, Langmuir, 2009, 25, 8974–8981 CrossRef CAS PubMed.
- M. Andersson, J. Jackman, D. Wilson, P. Jarvoll, V. Alfredsson, G. Okeyo and R. Duran, Colloids Surf., B, 2011, 82, 550–561 CrossRef CAS PubMed.
- Y. Nagai, L. D. Unsworth, S. Koutsopoulos and S. Zhang, J. Controlled Release, 2006, 115, 18–25 CrossRef CAS PubMed.
- S. E. Paramonov, H.-W. Jun and J. D. Hartgerink, J. Am. Chem. Soc., 2006, 128, 7291–7298 CrossRef CAS PubMed.
- V. I. Bhoi, S. Kumar and C. N. Murthy, Carbohydr. Res., 2012, 359, 120–127 CrossRef CAS PubMed.
- S. Song, A. Song, L. Feng, G. Wei, S. Dong and J. Hao, ACS Appl. Mater. Interfaces, 2014, 6, 18319–18328 CAS.
- S. Xu, A. Liu, Q. Chen, M. Lv, M. Yonese and H. Liu, Colloids Surf., B, 2009, 70, 124–131 CrossRef CAS PubMed.
- S. Ray, A. K. Das and A. Banerjee, Chem. Mater., 2007, 19, 1633–1639 CrossRef CAS.
- S. Song, H. Wang, A. Song and J. Hao, Chem.–Asian J., 2014, 9, 245–252 CrossRef CAS PubMed.
- R. A. Petros and J. M. DeSimone, Nat. Rev. Drug Discovery, 2010, 9, 615–627 CrossRef CAS PubMed.
- N. Nayak and K. R. R. Gopidas, J. Mater. Chem. B, 2015, 3, 3425–3428 RSC.
- A. L. Fameau and T. Zemb, Adv. Colloid Interface Sci., 2014, 207, 43–64 CrossRef CAS PubMed.
- J. M. Gebicki and M. Hicks, Nature, 1973, 243, 232–234 CrossRef CAS PubMed.
- D. P. Cistola, J. A. Hamilton, D. Jackson and D. M. Small, Biochemistry, 1988, 27, 1881–1888 CrossRef CAS PubMed.
- T. Namani, T. Ishikawa, K. Morigaki and P. Walde, Colloids Surf., B, 2007, 54, 118–123 CrossRef CAS PubMed.
- J. W. McBain, J. Am. Chem. Soc., 1928, 50, 1636–1640 CrossRef CAS.
- M. Jansson, A. Jönsson, P. Li and P. Stilbs, Colloids Surf., 1991, 59, 387–397 CrossRef CAS.
- M. Rosa, M. Rosa Infante, M. d. G. Miguel and B. Lindman, Langmuir, 2006, 22, 5588–5596 CrossRef CAS PubMed.
- B. Novales, A. Riaublanc, L. Navailles, B. H. Houssou, C. Gaillard, F. Nallet and J. P. Douliez, Langmuir, 2010, 26, 5329–5334 CrossRef CAS PubMed.
- A. Arnould, A. A. Perez, C. Gaillard, J.-P. Douliez, F. Cousin, L. G. Santiago, T. Zemb, M. Anton and A.-L. Fameau, J. Colloid Interface Sci., 2015, 445, 285–293 CrossRef CAS PubMed.
- R. Zana, Langmuir, 2004, 20, 5666–5668 CrossRef CAS PubMed.
- M. Asif, Chem. Int., 2015, 1, 118–133 Search PubMed.
- R. Buchiraju, S. Nama, B. Sakala, B. R. Chandu, A. Kommu, J. Kishore, B. Chebrolu, N. Yedulapurapu and D. Bosco, Res. J. Pharm., Biol. Chem. Sci., 2013, 4, 462–474 CAS.
- W. Gao, C.-M. J. Hu, R. H. Fang and L. Zhang, J. Mater. Chem. B, 2013, 1, 6569–6585 RSC.
- D. Patel, R. Jani and C. Patel, Syst. Rev. Pharm., 2011, 2, 72–78 CrossRef CAS.
- M. B. Dowling, J.-H. Lee and S. R. Raghavan, Langmuir, 2009, 25, 8519–8525 CrossRef CAS PubMed.
- N. Berclaz, E. Blöchliger, M. Müller and P. L. Luisi, J. Phys. Chem. B, 2001, 105, 1065–1071 CrossRef CAS.
- D. Zhao, H. Li, A. Song and J. Hao, Chin. Sci. Bull., 2009, 54, 3953–3957 CrossRef CAS.
- F. Zakir, B. Vaidya, A. K. Goyal, B. Malik and S. P. Vyas, Drug Delivery, 2010, 17, 238–248 CrossRef CAS PubMed.
- Y. Jiang, Y. Luan, F. Qin, L. Zhao and Z. Li, RSC Adv., 2012, 2, 6905–6912 RSC.
- J. R. Kanicky and D. O. Shah, J. Colloid Interface Sci., 2002, 256, 201–207 CrossRef CAS PubMed.
- G. Li, Y. Liu, W. Xu, A. Song and J. Hao, J. Phys. Chem. B, 2014, 118, 14843–14851 CAS.
- H. M. Roche, Proc. Nutr. Soc., 1999, 58, 397–401 CrossRef CAS PubMed.
- E. Canel, A. Gültepe, A. Doğan and E. Kilıç, J. Solution Chem., 2006, 35, 5–19 CrossRef CAS.
- J. N. Israelachvili, D. J. Mitchell and B. W. Ninham, J. Chem. Soc., Faraday Trans., 1976, 72, 1525–1568 RSC.
- H. Friedrich, P. M. Frederik and N. A. J. M. Sommerdijk, Angew. Chem., Int. Ed., 2010, 49, 7850–7858 CrossRef CAS PubMed.
- J. Hao and H. Hoffmann, Curr. Opin. Colloid Interface Sci., 2004, 9, 279–293 CrossRef CAS.
- Y. Zhang, H. Yin and Y. Feng, Green Mater., 2014, 2, 95–103 CrossRef.
- S. Song, Q. Zheng, A. Song and J. Hao, Langmuir, 2011, 28, 219–226 CrossRef PubMed.
- B. Medronho, S. Shafaei, R. Szopko, M. G. Miguel, U. Olsson and C. Schmidt, Langmuir, 2008, 24, 6480–6486 CrossRef CAS PubMed.
- C. E. Fairhurst, M. C. Holmes and M. S. Leaver, Langmuir, 1997, 13, 4964–4975 CrossRef CAS.
- R. Dong, Z. Zhong and J. Hao, Soft Matter, 2012, 8, 7812–7821 RSC.
- M. E. Morales, M. B. Santillán, E. A. Jáuregui and G. M. Ciuffo, J. Mol. Struct.: THEOCHEM, 2002, 582, 119–128 CrossRef CAS.
- J. McMurry, Organic Chemistry, Thomson Higher Education, Belmont, Chichester, 5th edn, 2007 Search PubMed.
- S. Ghosh, B. Ambade and A. Ray, Sci. Technol. Adv. Mater., 2013, 2, 1837–1846 CrossRef.
- J. Du, L. Fan and Q. Liu, Macromolecules, 2012, 20, 8275–8283 CrossRef.
| This journal is © The Royal Society of Chemistry 2017 |

