 Open Access Article
Upconversion luminescence enhancement and temperature sensing behavior of F− co-doped Ba3Lu4O9:Er3+/Yb3+ phosphors†
Songbin Liua,
Shuifu Liua,
Ming Zhoua,
Xinyu Ye *ab,
Dejian Houa and
Weixiong Youc
aSchool of Metallurgy and Chemistry Engineering, Jiangxi University of Science and Technology, Ganzhou 341000, P. R. China. E-mail: xinyye@yahoo.com
bNational Engineering Research Center for Ionic Rare Earth, Ganzhou 341000, P. R. China
cSchool of Material Science and Engineering, Jiangxi University of Science and Technology, Ganzhou 341000, P. R.China
First published on 25th July 2017
Abstract
A series of Ba3Lu4O9:Er3+/Yb3+ (EYBLO) phosphors co-doped with F− ions were synthesized by a simple solid-state reaction method. The results showed that the primary rhombohedral structure was maintained and the crystal lattice began to shrink when F− ions were introduced into the host matrix to occupy the O2− site. The agglomerations and the impurities (OH− and CO2) with higher phonon energy on the sample surface could be minimized and the sample crystallinity could be improved. Under 980 nm laser diode excitation, the green and red UC emissions of the EYBLO:0.4F− sample show nearly 5- and 7.5-fold enhancements in contrast to F−-free EYBLO. The upconversion luminescence can be finely tuned from yellow to red light to some extent by increasing F− concentration. Based on pump-power dependence and decay lifetime analysis, the energy level diagram was illustrated and the upconversion energy-transfer mechanism was discussed. The green and red emission enhancements are attributed to the modification of the local crystal field of Er3+ ions and reduction of crystal site symmetry. The cross-relaxation and back-energy-transfer processes play an important role to enhance the red/green UC emission intensity ratios. The fluorescence intensity ratio technique was employed to investigate the temperature sensing behavior of the synthesized phosphors. The temperature sensing properties can be enhanced by doping of F− ions, and the maximum sensitivity is found to be 44.57 × 10⁻⁴ K−1 at 523 K. It is promising to provide an alternative approach for enhancing UC luminescence and the temperature sensitivity in oxide matrixes and then obtain high-quality optical temperature-sensing materials by simply co-doping F− ions.
1. Introduction
Upconversion (UC) is a typically anti-Stokes emission process, which can convert long-wavelength excitation into short-wavelength light output by means of energy transfer and excited state absorption. Over the past decade, UC luminescence has attracted great attention in diverse research fields.1,2 In particular, rare earth (RE) ion-doped UC luminescence materials are one of the research hotspots in this area for their potential applications in biological imaging, compact solid state lasers, optical temperature sensors and solar energy conversion, etc.3,4 Owing to their abundant ladder-like energy levels and relatively long excited-state lifetimes, trivalent RE ions such as Er3+, Tm3+ or Ho3+ are usually selected as activators.5 However, one of the drawbacks of the above RE3+ ions is that they have low absorption cross-sections for 4f–4f transitions, which result in the low luminescence intensity for these transitions.6 Yb3+ ions are commonly used as sensitizers in UC luminescence materials due to their relatively large absorption cross-section at 980 nm, leading to efficient absorption of infrared (IR) or near-infrared (NIR) pump photons and subsequently transfer their harvest energy to neighboring activator ions.7 Although there exists an effective energy-transfer (ET) from Yb3+ to Er3+/Tm3+/Ho3+, the UC luminescence intensity of this type of material is still inadequate, which greatly limits their applications. Therefore, enhancing the UC luminescence intensity is one of the significant issues and great challenge for its actual application.Recently, many kinds of techniques were adopted to improve the UC emission intensity, such as changing the crystal phase of host materials,8,9 adding Nb to reduce phonon energy,10 incorporating impurities such as Li+, Zn2+ to modify the local crystal field around RE3+ ions,11–13 introducing core–shell structure,14 and crystal surface coating.15 It is well-known that the UC emission intensity of RE3+ doped phosphor is strongly dependent on their intra 4f–4f transition possibility.16 Therefore, UC emission intensity also could be enhanced by inhibiting non-radiative (NR) transition process by means of using a host material with low phonon energy, such as fluoride and sulfide matrixes.17 According to the energy-gap law, it is especially important for the UC luminescence processes are very sensitive to quenching by high-energy vibration.18 Moreover, F− ions can be doped into the matrices efficiently by substitution of O2− sites in the crystal lattice due to their similar electronic configuration and nearly same ionic radius.19,20 In down-conversion system, the influence of fluoride on f–f transition of Eu3+ was investigated, and the results showed that substitution of F− for O2− might reduce the magnitude of the phonon energy and quenched NR transition processes to enhance the luminescence intensity.21,22 In addition, Sun et al. reported that the replacement of OH− by F− can improve the luminescence intensity significantly, which may be caused by the decreased fluorescence quenching of activator ion.23 Compared with down-conversion system,21,22 there exist very few reports about the enhancement of luminescence by co-doped F− ions in upconversion luminescence material. Recently, Li et al.24 reported an efficient F− anion doping strategy to enhance upconversion luminescence in NaGd(MoO4)2:Yb3+/Er3+ nanophosphors, based on the Rietveld refinements and Judd–Ofelt analysis. The luminescence enhancement is due to the fact that the doping of F− augmented local crystal field strength, lowered site symmetry, and inhibited non-radiative transition of lanthanide activators.24
In various actual applications of UC luminescence, fluorescence-based optical temperature sensors have attracted much attention due to their peculiar characteristics: lower signal-to-noise ratio (SNR) and suitable for hazardous environments where are not possible for conventional thermocouple temperature detectors in oil refineries, coal mines and corrosive conditions.25,26 Among these applications, the temperature-dependent fluorescence lifetime and fluorescence intensity ratio (FIR) are regarded as very promising techniques for optical temperature sensors. The FIR technique based on the measurement of luminescence intensities from two thermally coupled levels of RE3+ ions is independent of signal losses and fluctuation in the excitation intensity and has the potential to improve measurement accuracy and resolution significantly.27,28 In addition, the Er3+ ions have been investigated extensively due to its green UC emissions originating from two thermally coupled levels 2H11/2 and 4S3/2.29 Therefore, it is meaningful for searching for a new Er3+-doped host materials and providing a practical method to enhance the sensitivity for high-quality optical temperature sensors. Moreover, no temperature sensing studies have been conducted on Er3+/Yb3+ co-doped and F− tri-doped Ba3Lu4O9 phosphor.
In our previous study, complex oxide-Ba3Lu4O9 was found to be a promising upconversion phosphor host. Er3+/Yb3+ co-doped Ba3Lu4O9 phosphors exhibited intense and color-tunable UC luminescence under the 980 nm laser diode (LD) excitation.30 The optimal Er3+/Yb3+ doping concentration and sintering temperature were confirmed to be Ba3Lu3.3Er0.1Yb0.6O9 at 1550 °C.30 Herein, we report an enhancement of UC luminescence and temperature sensing behavior of Ba3Lu4O9:Er3+/Yb3+ (EYBLO) phosphor by incorporation of F− ions. This research focuses on the influences of F− ions doping on structure, morphology, UC luminescence and temperature sensing behavior. In combination with pump-power dependence, decay lifetime and energy level diagram, the improvement mechanisms of UC emission intensity by introducing F− ions into EYBLO are investigated in detail. The FIR technique is employed to study the temperature sensing behavior.
2. Experimental section
2.1 Preparation
The Ba3Lu4−y−zEryYbzO9−x/2Fx (x = 0, 0.1, 0.2, 0.3, 0.4, 0.5, 0.6, y = 0.1 and z = 0.6) samples were prepared through a high-temperature solid-state reaction method. BaCO3 (A.R.), Lu2O3 (99.99%), Er2O3 (99.99%) and Yb2O3 (99.99%) were used as starting materials. For the purpose of without introducing impurity element, BaF2 was selected as fluorine source; BaF2 and BaCO3 were used as barium source at the same time. According to certain stoichiometric ratio, the chemicals were weighed accurately and ground thoroughly in an agate mortar with some alcohol. Then the mixture was dried in an oven under the temperature of 60 °C for 15 min. The dried mixture powers were reground for 45 min and transferred into alumina crucibles. The sintering is performed at a rate of 5 °C per min to the specific temperatures (1200–1650 °C) and kept for 6 h in air. After sintering, the powers were furnace-cooled naturally down to room temperature. Finally, the as-prepared powers were washed with deionized water three times and dried at 120 °C for 3 h in a drying box to obtain final phosphors.2.2 Characterization
The X-ray diffraction (XRD) measurements were performed by using a PANalytical X'Pert Pro diffractometer (Holland) with Cu Kα1 radiation (λ = 0.1540598 nm) operating at 40 kV and 40 mA to identify the structure and phase purity. All the XRD data within the range from 10° to 80° were recorded in a continuous scanning type with a scan step size of 0.01313°. The Fourier-transform infrared (FT-IR) spectra were obtained in the transmission mode on a Bruker (Karlsruhe, Germany) spectrophotometer in the range of 400–4000 cm−1. The samples were mixed with the potassium bromide (KBr) in 1![[thin space (1/6-em)]](https://www.rsc.org/images/entities/char_2009.gif) :
:![[thin space (1/6-em)]](https://www.rsc.org/images/entities/char_2009.gif) 100 mass ratio to get a transparent pellet. The X-ray photoelectron spectroscopy (XPS) was carried out on the Escalab 250Xi (Thermo scientific, America) system using a monochromatic AlKα (hν = 1486.6 eV) X-ray source operating at 15 kV. The spectra were obtained at ambient temperature with an ultrahigh vacuum. The binding energies were charge-corrected using the C 1s peak of graphite at 284.6 eV as a reference. The morphologies of the samples were analyzed by field-emission scanning electron microscope (FE-SEM, TESCAN MIRA3 LMH, Czech Republic) equipped with the energy dispersive spectrum (EDS). The UC emission spectra in the wavelength range of 500–750 nm was collected by using a FluoroLog-3 (HORIBA Jobin Yvon, France) spectrophotometer equipped with an NIR Photomultiplier (R928, Hamamatsu, Japan). An external power-controllable 980 nm semiconductor laser diode was selected as excitation pump source. In order to investigate the temperature dependence of the UC emission, the samples were placed in a temperature-controlled copper cylinder, and test temperature was increased from 293 to 573 K. The luminescence decay curves and NIR luminescence spectra were measured with a FLS980 (Edinburgh, England) spectrometer upon selective 980 nm excitation provided by an optical parametric oscillator (OPO). All the measurements were conducted at room temperature except for the temperature dependence of UC luminescence spectra test.
100 mass ratio to get a transparent pellet. The X-ray photoelectron spectroscopy (XPS) was carried out on the Escalab 250Xi (Thermo scientific, America) system using a monochromatic AlKα (hν = 1486.6 eV) X-ray source operating at 15 kV. The spectra were obtained at ambient temperature with an ultrahigh vacuum. The binding energies were charge-corrected using the C 1s peak of graphite at 284.6 eV as a reference. The morphologies of the samples were analyzed by field-emission scanning electron microscope (FE-SEM, TESCAN MIRA3 LMH, Czech Republic) equipped with the energy dispersive spectrum (EDS). The UC emission spectra in the wavelength range of 500–750 nm was collected by using a FluoroLog-3 (HORIBA Jobin Yvon, France) spectrophotometer equipped with an NIR Photomultiplier (R928, Hamamatsu, Japan). An external power-controllable 980 nm semiconductor laser diode was selected as excitation pump source. In order to investigate the temperature dependence of the UC emission, the samples were placed in a temperature-controlled copper cylinder, and test temperature was increased from 293 to 573 K. The luminescence decay curves and NIR luminescence spectra were measured with a FLS980 (Edinburgh, England) spectrometer upon selective 980 nm excitation provided by an optical parametric oscillator (OPO). All the measurements were conducted at room temperature except for the temperature dependence of UC luminescence spectra test.
3. Results and discussion
3.1 Structure and morphology
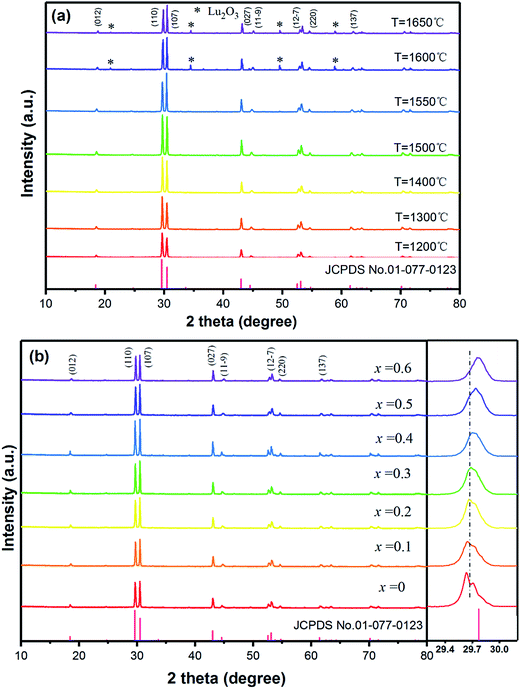
The Ba3Lu4O9 (BLO) crystal belongs to a rhombohedral structure with space group R3 (no. 146),31 and cell parameters of a = b = 0.603 nm, c = 2.4753 nm. The XRD patterns of F− ions co-doped Ba3Lu4O9:Er3+/Yb3+ (EYBLO) prepared at various temperatures are shown in Fig. 1(a). All patterns of the samples sintered below 1550 °C match well with the standard reference of Ba3Lu4O9 (JCPDS No. 01-077-0323) and no impurity diffraction peaks are observed. However, when the temperature exceeds 1550 °C, the second phase Lu2O3 begins to appear. Meanwhile, the diffraction peaks become markedly weaker instead of sharper and stronger from 1200 °C to 1500 °C. In addition, an interesting phenomenon is observed in the figure. The strongest diffraction peak belongs to (110) crystal plane when the sintering temperature below 1550 °C and then shifts to the (107) crystal plane as the temperature rising. It may be due to the preferred orientation of crystal growth along different direction at various sintering temperatures.32Fig. 1(b) shows the XRD patterns of EYBLO co-doped with various F− (x = 0–0.6) ions. Within the range of experimental dopant concentration, all the observed diffraction peaks of F− co-doped samples are exactly assigned to the pure phase Ba3Lu4O9. The results imply that Er3+/Yb3+/F− tri-doped do not change the crystal structure of the host lattice. Comparing with the F−-free sample (x = 0), the intensities of diffraction peaks increase with increasing F− ions doping concentration, which indicates that sample crystallinity can be enhanced by incorporation of F− ions. When the doping concentration exceeds x = 0.4, the intensity of diffraction peaks decrease, which maybe result from the creation of surface defect by doping excessive F− ions. Meanwhile, the magnified patterns around the (110) diffraction peak of F− ions co-doped samples from 2θ = 29.2–30.2° is presented in the figure. Due to the same ionic valence state and similar ionic radius, the Lu3+ ions are substituted easily by Yb3+/Er3+ ions.30 It is obviously observed that the peak position corresponding to (110) slightly shifts towards the higher 2θ side with increasing F− ions concentration. The phenomenon can be ascribed that smaller radii of F− (0.133 nm, CN = 6) ions enter into the crystal lattice by occupying larger radius of O2− (0.140 nm, CN = 6) ions.18 It also indicates the successful doping of F− ions in the EYBLO lattice.
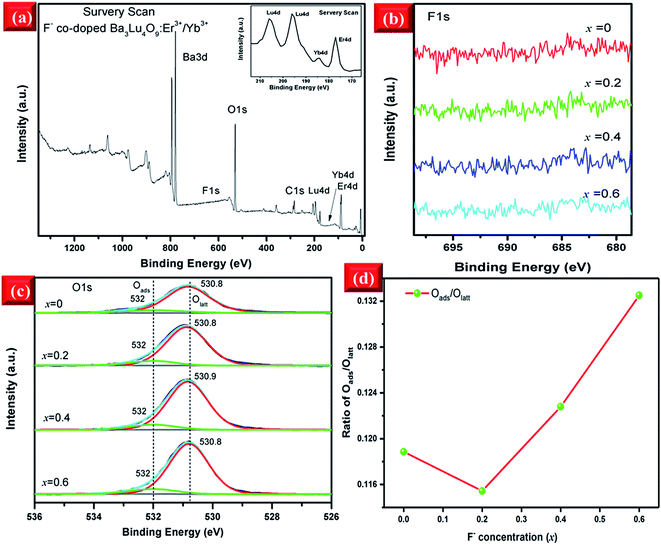
To investigate the chemical compositions of the F−-doped EYBLO samples, the XPS measurement was performed. All XPS data of elements were charge-corrected with respect to C 1s (≈284.6 eV). The survey scan of core binding energy (BE) of EYBLO:xF− (x = 0.4) sample is presented in Fig. 2(a). The XPS peaks show that the F−-doped EYBLO samples contain only Ba, Lu, O, Er, Yb and F and a trace amount of C. The C element is ascribed to the adventitious carbon from the XPS instrument itself. The inset is the magnified XPS spectrum to show the existence of Er 4d and Yb 4d. For the F−-free EYBLO sample, the high-resolution XPS spectrum of Ba 3d spectrum exhibits two peaks, 3d5/2 and 3d3/2 (from the spin–orbit splitting),33 located at 779.6 eV and 795.0 eV, respectively (ESI, Fig. S1(a)†). With increasing F− doping concentration, no shifts are observed in the peak positions of 3d5/2 and 3d3/2. Similarly, no move is found for the two peaks corresponding to Lu 4d, which have core BEs of ∼196.2 eV (3d5/2) and 206.0 eV (3d3/2),34 after F− ions incorporation (ESI, Fig. S1(b)†). These results confirm that the valence state of Ba and Lu elements maintain with the doping of F− ions. In addition, because of the lower doping concentrations of Er3+ and Yb3+, a comparatively low intensity was observed (ESI, Fig. S1(c and d)†). However, the F element is not detectable in the XPS spectrum (Fig. 3(b)) because of the low molar percent of F (about 0.1%). Meanwhile, the volatilization characteristics and light atomic mass of F bring some difficulties in detecting F− ions. Therefore, the XPS spectrum of O 1s are used as a probe to find out the evident of the substitution of F− for O2− and the changes of chemical surrounding environment of oxygen element.
Two deconvoluted peaks of O 1s regions are shown in Fig. 2(c). In the case of F−-free EYBLO sample, the main contribution peak located at ∼530.8 eV with FWHM ∼1.56 eV is from the surface lattice oxygen (Olatt), which could be substituted by F− ions on the surface.35 And the weak contribution peak centered at ∼532 eV with FWHM ∼1.83 eV is from the surface adsorption oxygen (Oads) physically absorbed on the surface.36 With increasing F− co-doping concentrations, the two peak positions and FWHM have slightly shifts of about 0.1 eV and 0.68 eV, respectively. The BE of O 1s increases with increasing F− ion doping content. The shift of the BE of the Olatt to the higher value could be interpreted as an increase of electronegativity (F− > O2−) on the surface because of the effective substitution of F− for O2−. Therefore, increasing of basic strength of the oxygen atoms results in the enhancement of the bond energy.37 So the variation tendency of O 1s BE can provide an evident that the O2− can be substituted successfully by F− ions. Meanwhile, the intensities of O 1s peaks keep declining monotonically with the increase of F− concentration, which can also explain indirectly that reduction of oxygen content is due to the effective substitution by F− ions. Further, the ratio of integrated peak areas of Oads and Olatt as a function of F− ions doped concentration are shown in Fig. 2(d). Compared with the F−-free doped sample, the ratio of Oads/Olatt of F− doped EYBLO:xF− (x = 0.2) is lower, which probably caused by the creation of oxygen ion vacancies and/or surface defects through the sample surface with the introduction of F− ions into the host matrix.26,38 Nevertheless, it begins to increase when the F− ions doping concentration exceeds x = 0.2. The substitution of F− for O2− can result in the reduction of the amount of Olatt and enlargement of Oads/Olatt ratio.
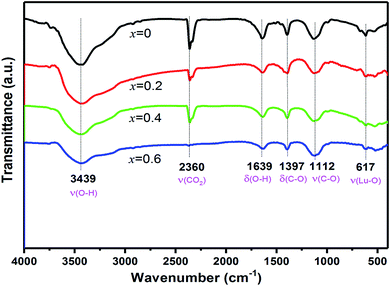
Fig. 3 shows the FT-IR spectra of EYBLO co-doped with various F− ions (x = 0–0.6). A broad peak at 3439 cm−1 and a weak peak at 1639 cm−1 originate from the stretching vibration and deformation of the OH− group of water, respectively, which may be generated directly from the air.39 Compared with F−-free doped EYBLO sample, the absorption bands of OH− group become weaker with adding F− ions. Peak at 2360 cm−1 is caused by the interference of CO2 in the air and the absorption nearly disappears by incorporation of F− ions. The phonon energies of the OH− group and CO2 are ∼1500 and ∼3350 cm−1, respectively. These higher energy phonon groups can be absorbed by the lattice surface to form the surface defects, which act as NR transition centers to quench the luminescence.40,41 The relative absorption intensities of these groups are reduced by doping F− into EYBLO samples, which indicates that higher phonon groups can be removed by incorporation of F− ions. Therefore, it decreases the quenching centers and increases the UC luminescence intensities. The absorption peaks at 1397 cm−1 and 1112 cm−1 can be assigned to the asymmetric stretching vibration and stretching vibration of C–O bond, respectively. Whereas the peak at 617 cm−1 is attributed to the characteristic stretching vibration of Lu–O bond.42 Such absorption peaks have similar intensities for all F−-doped and F− free samples, which indicates that the interaction of Lu–O bond seldom changed with doping F− ions.
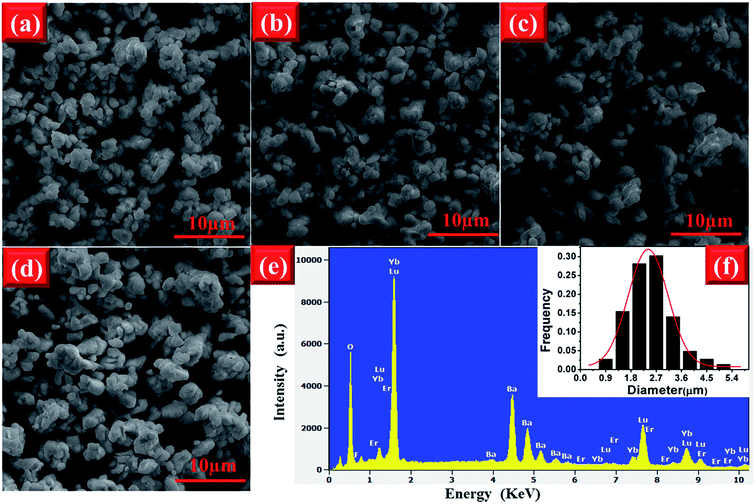
The morphology of phosphor materials is an important factor for luminescence properties. The FE-SEM images of the EYBLO co-doped with various F− (x = 0–0.6) ions are shown in Fig. 4. It is observed that the morphologies and average particle size of samples have not been affected by different concentrations of F− ions. Therefore, the luminescence enhancement of low content F− doping is not due to the improvement of the sample morphology. Similar phenomenon can also observed in other literature by different cation or anion doping.24,43 In addition, the EYBLO:0.4F− sample shows a narrow size distribution with average size of approximately 2.7 μm (Fig. 4(f)). Moreover, Fig. 4(e) shows the EDS spectra of EYBLO:0.4F− sample. The actual chemical compositions contains Ba, Lu, Er, Yb, O, and F elements. Because the diffraction peaks of BaF2 phase are not shown in the XRD patterns, the existence of F element in the spectra suggests that F− ions are successfully co-doped into the crystal structure.
In order to observe the distribution of the elements to confirm if the doped elements are uniformly dispersed in the host, the elemental mapping images of EYBLO:0.4F− sample were obtained by EDS measurement. Fig. 5(a) is the SEM image of the tested area, Fig. 5(b–f) exhibit the distributions of the different elements O, F, Lu, Er and Yb in the area, respectively. The EDS mapping results show that the F and O are uniformly distributed in the sample, which verifies that the O2− site might be successfully occupied by the F− via the high temperature solid-stated reaction. In addition, the distributions of Lu, Er and Yb elements are homogeneous, and homogeneous distribution of activator ions in the host can reduce the concentration quenching and promote the luminescence intensity.44,45
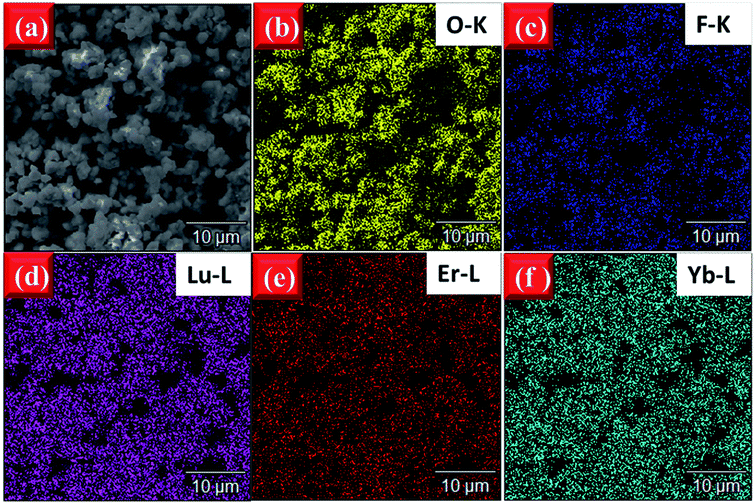 | ||
| Fig. 5 (a) SEM image of tested area and EDS element mapping of (b) O–K, (c) F–K, (d) Lu–L, (e) Er–L, (f) Yb–L of EYBLO:0.4F− samples sintered at 1500 °C. | ||
3.2 Upconversion luminescence
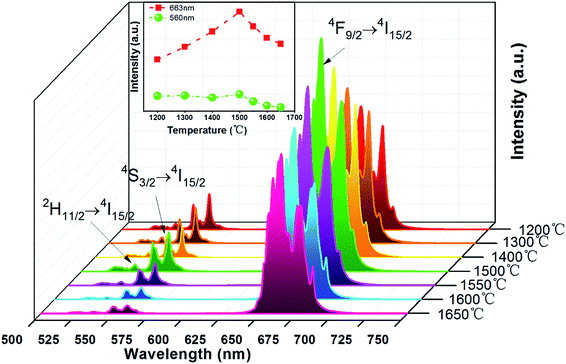
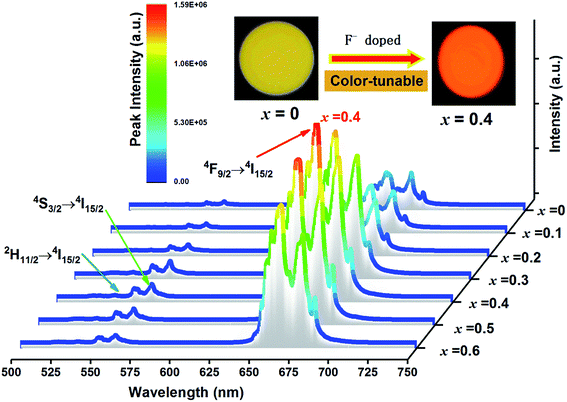
Fig. 6 shows the UC emission spectra of EYBLO:0.4F− sample sintered at various temperatures from 1200 °C to 1650 °C under the excitation of 980 nm LD. The inset of figure shows the emission intensity of green region (560 nm) and red region (663 nm) as a function of sintering temperature. It is obvious that the green and red emission intensities enhance with sintering temperature increasing up to 1500 °C. When the temperature exceeds 1500 °C, the UC luminescence intensity decrease monotonously. It may be caused by the occurrence of impurity phase Lu2O3 at higher sintering temperature.In order to determine the optimal doping concentration of F− ions, the dependence of the UC emission spectra on F− doping contents were studied at room temperature under 980 nm LD excitation. The variation of UC emission intensities of EYBLO:xF− samples (x = 0–0.6) are shown in Fig. 7. The UC spectra exhibit bright red emission with weak green emission. The intense red emission band centered at 663 nm is corresponding to the transition 4F9/2 → 4I15/2 of Er3+. Two relatively weaker green emission bands centered at 537 nm and 560 nm can be attributed to the 2H11/2 → 4I15/2 and 4S3/2 → 4I15/2 electronic transitions of Er3+, respectively. The spectra of all samples with different F− concentrations are similar in shapes of emission bands and peak positions, but differ in luminescence intensity. The inset of the figure shows the digital photographs of EYBLO:xF− samples (x = 0 and x = 0.4) using a Nikon digital camera with suitable color filters. The luminescence color shifts from bright tallow (F−-free doped EYBLO) to red light (EYBLO:0.4F−) to naked eye under 980 nm LD excitation. When the F− doping concentrations varied from x = 0 to x = 0.6, the UC emission color coordinates move from yellow region (0.5061, 0.4886) to red region (0.6228, 0.3743) (ESI, Fig. S2†). Therefore, the UC emission color can be finely tuned from yellow to red light to some extent by adjusting F− concentrations.
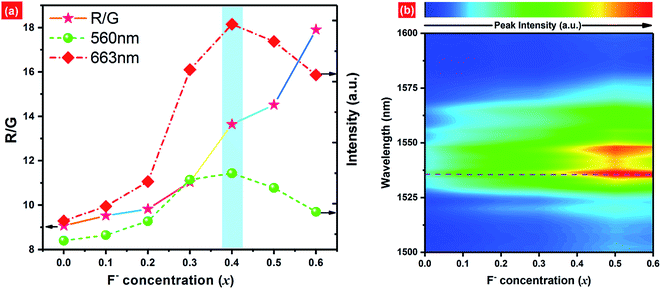
Fig. 8(a) shows the dependence of green emission (560 nm) and red emission (663 nm) intensities as well as Red/Green intensity ratio (R/G) on F− concentrations. As we can see, the red and green emission intensities show the similar trends to F− doping concentrations. Both emission intensities increase along with increasing F− contents first, and then reach a maximum at x = 0.4. When the F− concentration exceeds this threshold, the UC luminescence intensity decreases gradually. Compared with F−-free sample, it is observed that the UC red emission intensity of EYBLO:0.4F− sample is drastically increased by fold of 7.5, which is larger than 5 times enhancement for UC green emission. As demonstrated by the Raman spectra (ESI, Fig. S3†), the maximum phonon energy of Ba3Lu4O9 host matrix is almost identical to 1205 cm−1 for all samples. The results indicate that the lattice vibration mode, and thereby multi-phonon relaxation rate, has not been altered by further introduction of different F− ions. Therefore, the reduction of the phonon energy caused by F− doping is inadequate to explain the enhancement of UC luminescence intensity. The enhancement reason may be attributed to at least the following three aspects. First and the most obvious one is the modification of the local crystal field around the Er3+ ions in the host lattice.24,43,46 According to Laporte's parity selection rule, electric dipole 4f–4f transitions of lanthanide ions are forbidden due to the same parity of the 4f level. Just as discussed above, the incorporation of F− ions into the host matrix to occupy O2− site or enter interstitial sites would modify the local crystal field environment of Er3+ ions, lower site symmetry of the lanthanide activator ions and break the 4f–4f forbidden transitions to enhance the UC luminescence.16,26,39–41 Secondly, the flux effect of BaF2 could not be neglected and F− doping may also improve crystallinity and particle morphology of samples as discussed in the Fig. 4, which further enhances the UC luminescence. In addition, higher phonon energy groups also can be reduced by incorporation by F− ions, which contribute to the decrease of quenching center and increase of UC luminescence intensity. When continue to increase the F− doping contents, the UC emission intensity decreases gradually, which means that the radiative transition probability become decrease. In other words, the non-radiative transition probability increases with increasing F− content (x > 0.4) due to the creation of sample surface defects induced excessive F− ions.26
At the same time, the dependences of the emission intensity ratio of red and green (R/G) as a function of the F− concentration is presented in Fig. 8(a). The R/G keeps increasing monotonically from 9.069 to 17.907 with increasing F− contents from x = 0 to x = 0.6. The population of excited states 2H11/2/4S3/2 and 4F9/2 are all accomplished by NR transition from upper 4F7/2 level of Er3+ ions, then the electrons populated at above levels can relax radiatively to the ground state 4I15/2 to produce the green and red emission, respectively. The reason for R/G variation may be ascribed to the cross-relaxation (CR: 2H11/2 (Er3+) + 4I15/2 (Er3+) → 4I9/2 (Er3+) + 4I13/2 (Er3+)) between Er3+ ions or back-energy-transfer (BET: 4S3/2 (Er3+) + 2F7/2 (Yb3+) → 4I13/2 (Er3+) + 2F5/2 (Yb3+)) from Er3+ to Yb3+ ions to populate the 4I13/2 level of Er3+ ions.30,43,47,48 Then the ET process, 4I13/2 (Er3+) + 2F5/2 (Yb3+) → 4F9/2 (Er3+) + 2F7/2 (Yb3+), increases the population of the 4F9/2 level which eventually leads to produce more red emission and increase the R/G ratios. As we know, to substitute the O2− ions by smaller F− ions can induce the crystal lattice to shrink, leading to shorten the distances between adjacent Er3+ and Er3+ ions or and Yb3+ ions.49 Therefore, the rate of CR or BET processes can be accelerated with increasing F− doping concentration. Fig. 8(b) shows broad NIR luminescence spectra of EYBLO:xF− samples (x = 0–0.6) within the range of 1500–1600 nm under 980 nm LD excitation. The dominant NIR emission centered at 1536 nm is assigned to the 4I13/2 → 4I15/2 transition of Er3+. The dependence of NIR emission on the F− doping concentrations is different with those of the red and green emission. The NIR emission intensities increase continuously with the increase of F− doping concentrations. It is well-known that the luminescence intensity is dependent on the number of the electrons populated in the upper excited state and the relative radiative transition probability.50 These results strongly suggest that the number of the electrons populated in the 4I13/2 level can be accelerated by CR between Er3+ ions or BET process from Er3+ to Yb3+ ions to accomplish population.
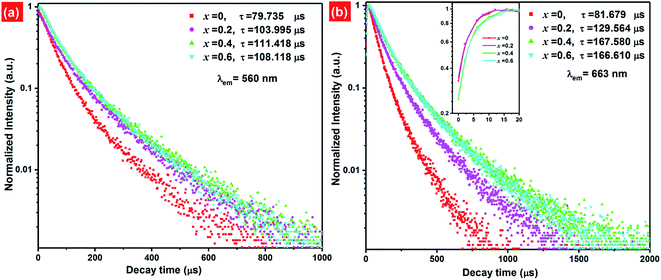
Fig. 9 presents the luminescence decay curves of 560 nm (4S3/2 → 4I15/2) and 663 nm (4F9/2 → 4I15/2) emissions of EYBLO:xF− samples with different F− doping concentrations under the excitation of 980 nm LD. Both the decay curves of green and red emissions show double exponential decay profiles, which fit well with second-order exponential decay mode, according to the following expression:51
 | (1) |
 | (2) |
The calculated average lifetime of Er3+ are determined to be 79.735, 103.995, 111.418, 108.118 μs and 81.679, 129.564, 167.580, 166.610 μs for 560 nm and 663 nm emissions of the F− concentrations (x = 0, 0.2, 0.4 and 0.6), respectively. It is evident that both the lifetime τ of 560 nm and 663 nm emissions increase with the increase of F− doping concentration, then decrease slightly. This variation tendency is in accordance with changes of emission spectra in Fig. 7. Generally, the lifetime of an excited state depends on the probability of depopulation (radiative and non-radiative) transitions of electrons from this excited state.50 The prolonged decay time of EYBLO:F− samples can be attributed to the modification of local crystal field of Er3+ ions.28,45,51 When appropriate F− ions were introduced into the host to occupy O2− sites, which given rise to the contraction of crystal lattice and hence lowered site symmetry. As more F− ions are introduced (x > 0.4), the lifetime begins to decrease slightly. It may be correlative with the sample surface defects induced excessive F− ions, which can act as the non-radiative transition centers to quench the luminescence. Meanwhile, there exists a luminescence rise for 663 nm red emission (inset of Fig. 9(b)) compared with the green one. Therefore, a rise time manifests that additional ET process, rather than stepwise excited-state absorption (ESA) process to enhance the red emission. In addition, the lifetime of 4I13/2 level is about several milliseconds and increase with the increase of F− ions concentrations (ESI, Fig. S4†). The decay lifetime results can provide experiment evidence that the number of the electrons populated in the of 4I13/2 level can be accelerated by CR or BET process, leading to accelerate population of the 4F9/2 level via ET3 process to produce more red emission. Therefore, this also coincides with the dependence of R/G on F− doping concentrations and explains why the R/G increases with increasing F− doping content.
3.3 Energy-transfer mechanism
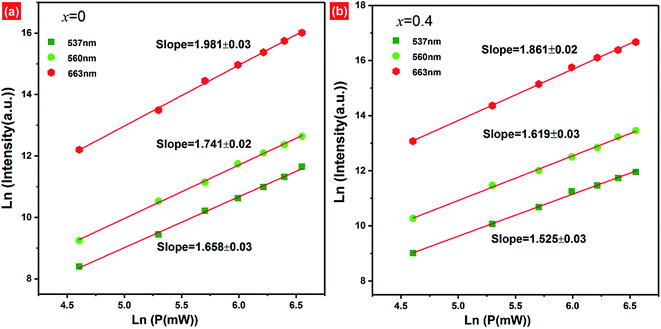
In order to better understand the possible UC luminescence mechanism, the dependence of the UC emission intensity on the pump-power of 980 nm LD is investigated. The pump-power of LD was varied from 100–700 mW. With the increase of pump-power, the UC emission intensity increases remarkably, which indicates that the UC processes have not reached saturation at lower pump-power excitation (ESI, Fig. S5†). For the unsaturated upconversion process, at relatively lower pump-power excitation, the number of photons required to populate the upper emitting levels can be well described as follows:52| Iup ∝ Pexn | (3) |
Based on the pump-power dependence of UC emission intensity, the partial energy level diagram of Er3+/Yb3+ and UC mechanism involved in green/red emission of F− co-doped EYBLO phosphor under 980 nm excitation are presented in Fig. 11. Because of relatively large absorption cross-section of Yb3+ ions around 980 nm, the ET process between Er3+ and Yb3+ plays a dominant role in the creation of UC luminescence. Firstly, the electrons at the ground state 2F7/2 of Yb3+ ions are excited to 2F5/2 level by absorbing 980 nm pump photon energy, and then 4I11/2 level of Er3+ is populated through ET1 process from the ground state 4I15/2. The electrons located at 4I11/2 level of Er3+ ions are further excited to 4F7/2 level via ET2 process to accomplish population. With the help in NR relaxation involving in lattice phonons, the electrons at 4F7/2 level undergo NR transition to populate the 2H11/2, 4S3/2 and 4F7/2 levels of Er3+ ions. The relatively weaker 537 nm and 560 nm green emissions are produced by the radiative transition (RT) from 2H11/2 and 4S3/2 level to the ground state 4I15/2 of Er3+, respectively. It is obvious that the green emission UC luminescence is a two-phonon process, which is in good accordance with the slope value in Fig. 10. In the case of red emission, the NR transition from 4F7/2 level is not the only way to populate the 4F9/2 level of Er3+. There exists another pathway of ET3 process to realize population of 4F9/2 level due to the UC red emission intensity increases more quickly than the green one when introduced F− ions into EYBLO sample. The electrons at the 4I11/2 level of Er3+ also can populate 4I13/2 level through NR transition. In addition, F− doping can lead to the contraction of crystal lattice and hence accelerates the CR process between Er3+ ions and BET process from Er3+ to Yb3+ ions, increasing the population of the 4I13/2 level which eventually leads to enhance the ET3 process to accomplish population of 4F9/2 level. The following expression can be used to give the brief description of the above the UC luminescence processes involved in green and red emissions:
| 4I15/2(Er3+) + 2F5/2(Yb3+) → 4I11/2(Er3+) + 2F7/2(Yb3+), (ET1) |
| 4I11/2(Er3+) + 2F5/2(Yb3+) → 4F7/2(Er3+) + 2F7/2(Yb3+), (ET2) |
| 4F7/2(Er3+) → 2H11/2, 4S3/2, 4F9/2(Er3+), (NR) |
| 2H11/2/4S3/2(Er3+) → 4I15/2(Er3+) + hνgreen, (RT) |
| 4I11/2(Er3+) → 4I13/2(Er3+), (NR) |
| 2H11/2 (Er3+) + 4I15/2 (Er3+) → 4I9/2 (Er3+) + 4I13/2 (Er3+), (CR) |
| 4S3/2 (Er3+) + 2F7/2 (Yb3+) → 4I13/2 (Er3+) + 2F5/2 (Yb3+), (BET) |
| 4I13/2(Er3+) + 2F5/2(Yb3+) → 4F9/2(Er3+) + 2F7/2(Yb3+), (ET3) |
| 4F9/2(Er3+) → 4I15/2(Er3+) + hνred, (RT) |
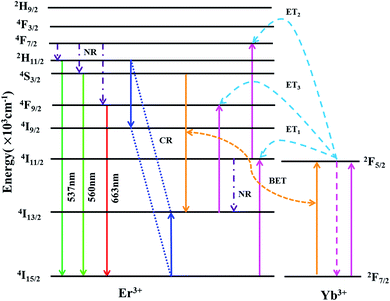 | ||
| Fig. 11 Partial energy level diagram of Er3+/Yb3+ and energy-transfer processes involved in the upconversion luminescence of F− co-doped EYBLO phosphor under 980 nm excitation. | ||
3.4 Temperature sensing behavior
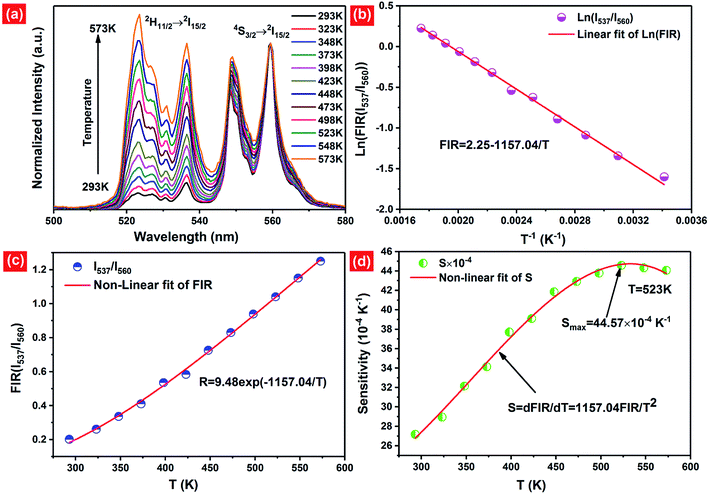
As mentioned above, in the case of Er3+ ions, UC emission bands centered at 537 nm and 560 nm are ascribed to the 2H11/2 → 4I15/2 and 4S3/2 → 4I15/2 transitions. Because of the small energy gap (700–800 cm−1) between the 2H11/2 and 4S3/2 levels of Er3+, the state of 2H11/2 may also be populated from 4S3/2 by thermal excitation and a quasi-thermal equilibrium occurs between the two coupled levels.25,53 In our as-prepared F− doped EYBLO samples, it is interesting to observe that the UC emission intensity ratio of the emission bands centered at 537 nm to 560 nm could change with the variable of external temperature. Therefore, it could be used as optical temperature sensor for the present UC phosphor material (EYBLO:F−). To investigate the temperature sensing behavior of as-synthesized phosphor, the FIR technique was employed. The green UC emission spectra of EYBLO:0.4F− sample under various temperatures from 293 to 573 K at an excitation power density of near 3 W cm−2 are shown in Fig. 12(a). In the present case, the low exciting power was utilized to reduce the heating effect caused by the excitation pumping source, and the emission spectra are normalized to the most intense emission peak at 560 nm. It is observed that the peak positions of the two UC emission bands of 2H11/2 → 4I15/2 and 4S3/2 → 4I15/2 barely change varied with temperature, whereas the FIR of the two emission bands obviously increase with the rise of temperature. According to the Boltzmann distribution, with thermalization of populations at two thermally coupled levels 2H11/2 and 4S3/2 of Er3+, the FIR of 537 nm and 560 nm green emission can be expressed as follow:54,55
 | (4) |
The monolog plot of the FIR of UC green emissions at 537 nm and 560 nm as a function of inverse absolute temperature in the range of 293–573 K is shown in Fig. 12(b). The linear dependence of the curve demonstrates the suitability of the phosphor in temperature sensing application. The experimental data could be fitted by a straight line with a slope of about 1157.04 and an intercept of about 2.25, respectively. The dependence of FIR of two green UC emissions on the absolute temperature is shown in Fig. 12(c). The FIR increases from 0.20 to 1.25 with increasing the temperature from 293 K to 573 K. The pre-exponential constant B value obtained using the above expression, is found to be near 9.48 according to the best curve fitting for the experiment data. As a consequence, the energy gap ΔE is evaluated to be about 801 cm−1. This slightly deviation of ΔE value from the actual value (700–800 cm−1) may be due to the fluctuations of the laser power and the absorption of the fluorescence by the host matrix during the recording of the spectra.48 In addition, for the practical application of an optical temperature sensor, the relative sensor sensitivity (S) is a very important reference parameter, which has been calculated using the following formula:54
 | (5) |
The calculated values of sensitivity S as a function of the absolute temperature are plotted in Fig. 12(d). At the temperature of 523 K, the sensitivity of F− doped EYBLO reaches its maximal value of about 44.57 × 10⁻⁴ K−1. Moreover, for the F−-free doped EYBLO sample, similar study about temperature sensing behavior was conducted (ESI, Fig. S6†). It can be seen that the sensitivity keeps increasing in our experimental temperature range, and the maximal value of about 42.26 × 10⁻⁴ K−1 is realized at the temperature of 523 K, which is lower than that of F− doped sample. The results indicate that the sensor sensitivity could be improved by incorporation of F− ions into the host lattice. It is worthwhile to compare the sensitivity results with the other Er3+–Yb3+ co-doped oxide UC materials for temperature sensing (ESI, Table S1†). Compare with other oxide UC materials, the temperature sensitivity of EYBLO:F− is located at a moderate level, but it remains stable at higher temperature ranges. The results demonstrate that Ba3Lu4O9 is a good host matrix for UC based phosphor, and F− doped EYBLO phosphor can be used in display device and as an excellent temperature sensor with high sensitivity and wide temperature ranges. In addition, this research may be extended to provide a practical method to enhance UC luminescence and temperature sensitivity in other high-quality optical temperature-sensing material by incorporation of F− ions.
4. Conclusions
In summary, F− ions co-doped Ba3Lu4O9:Er3+/Yb3+ phosphors were synthesized by a solid–state reaction method. By doping appropriate F− ions into the lattices, the content of higher phonon energy impurities (OH− and CO2) could be reduced and the sample crystallinity could be improved. The F− doping concentration and sintering temperature are optimized to be x = 0.4 and T = 1500 °C to get highest luminescence yield. The upconversion mechanism to produce green and red luminescence remains unchanged after incorporation of F− ions, and the involved upconversion process occurs comparatively easily to saturate in F− co-doped sample than the F−-free samples. Under 980 nm laser diode excitation, the EYBLO:0.4F− sample shows nearly 5- and 7.5-fold enhancements of green and red emissions compared with F−-free doped EYBLO, respectively. The enhancements of emission intensities are attributed to the fact that the substitution of O2− with F− can modify the local crystal field environment of Er3+ ions and lower its site symmetry, leading to break the 4f–4f forbidden transitions to enhance the UC luminescence. The red/green emission intensity ratios keep increasing monotonically with the F− contents due to that F− doping can lead to the contraction of crystal lattice and hence accelerate the CR (2H11/2 (Er3+) + 4I15/2 (Er3+) → 4I9/2 (Er3+) + 4I13/2 (Er3+)) process between Er3+ ions and BET (4S3/2 (Er3+) + 2F7/2 (Yb3+) → 4I13/2 (Er3+) + 2F5/2 (Yb3+)) process from Er3+ to Yb3+ ions, increasing the population of the 4I13/2 level which eventually leads to populate the 4F9/2 level. Meanwhile, the temperature sensing properties could be enhanced by incorporation of F− ions, and the maximum sensitivity is found to be 44.57 × 10⁻⁴ K−1 at 523 K. The results indicate that F− doped EYBLO phosphor can be used in display device as a temperature sensor with high sensitivity and wide temperature ranges.Acknowledgements
This project supported by the Natural Science Foundation of China (51304086, 11464017), the Natural Science Foundation of Jiangxi Province (20132BAB206020), the Science and Technology Research Plan of Jiangxi Education Department (GJJ14408), the Science and Technology Landing Plan for Colleges of Jiangxi Province(KJLD14045), Foundation of Science and Technology Pillar Program in Industrial Field of Jiangxi Province (20123BBE50075), Natural Science Funds for Distinguished Young Scholar of Jiangxi Province and the Program of Qingjiang Excellent Young Talents of Jiangxi University of Science and Technology.References
- F. Auzel, Chem. Rev., 2004, 104, 139–173 CrossRef CAS PubMed.
- F. Wang, R. Deng, J. Wang, Q. Wang, Y. Han, H. Zhu, X. Chen and X. Liu, Nat. Mater., 2011, 10, 968–973 CrossRef CAS PubMed.
- X. Li, F. Zhang and D. Zhao, Chem. Soc. Rev., 2015, 44, 1346–1378 RSC.
- M. Liu, M. Gu, Y. Tian, P. Huang, L. Wang, Q. Shi and C. Cui, J. Mater. Chem. C, 2017, 5, 4025–4033 RSC.
- S. Liu, X. Ye, S. Liu, M. Chen, H. Niu, D. Hou and W. You, J. Am. Ceram. Soc., 2017 DOI:10.1111/jace.14888.
- H. Dong, L. Sun and C. Yan, Chem. Soc. Rev., 2015, 44, 1608–1634 RSC.
- F. Wang and X. Liu, Chem. Soc. Rev., 2009, 38, 976–989 RSC.
- W. Niu, S. Wu, S. Zhang and L. Li, Chem. Commun., 2010, 46, 3908–3910 RSC.
- F. Wang, Y. Han, C. S. Lim, Y. Lu, J. Wang, J. Xu, H. Chen, C. Zhang, M. Hong and X. Liu, Nature, 2010, 463, 1061–1065 CrossRef CAS PubMed.
- A. S. Oliveira, M. T. de Araujo, A. S. Gouveia-Neto, A. S. B. Sombra, J. A. Medeiros Neto and N. Aranha, J. Appl. Phys., 1998, 83, 604–606 CrossRef CAS.
- D. Li, W. Qin, T. Aidilibike, P. Zhang, S. Liu, L. Wang and S. Li, J. Alloys Compd., 2016, 675, 31–36 CrossRef CAS.
- Y. Bai, Y. Wang, K. Yang, X. Zhang, G. Peng and Y. Song, J. Phys. Chem. C, 2008, 112, 12259–12263 CAS.
- S. Liu, M. Chen, S. Liu, H. Niu, X. Ye, D. Hou and W. You, Acta Opt. Sin., 2017, 37, 0616002 CrossRef.
- H. Guo, Z. Li, H. Qian, Y. Hu and I. N. Muhammad, Nanotechnology, 2010, 21, 125602 CrossRef PubMed.
- D. Li, B. Dong, X. Bai, Y. Wang and H. Song, J. Phys. Chem. C, 2010, 114, 8219–8226 CAS.
- Q. Cheng, J. Sui and W. Cai, Nanoscale, 2012, 4, 779–784 RSC.
- X. Chen, W. Zhang and Q. Zhang, Phys. B, 2011, 406, 1248–1252 CrossRef CAS.
- R. Yan and Y. Li, Adv. Funct. Mater., 2005, 15, 763–770 CrossRef CAS.
- Y. Huang, K. Jang, X. Wang and C. Jiang, J. Rare Earths, 2008, 26, 490–494 CrossRef.
- Z. Zhao, Y. Xu, M. Ji and H. Zhang, Electrochim. Acta, 2013, 109, 645–650 CrossRef CAS.
- J. Wang, X. Jing, C. Yan, J. Lin and F. Liao, J. Lumin., 2006, 121, 57–61 CrossRef CAS.
- X. Ye, Y. Luo, S. Liu, D. Hou, W. You and L. Xia, Chin. J. Lumin., 2016, 37, 1203–1212 CrossRef.
- R. Sun, K. Chen, X. Wu, D. Zhao and Z. Sun, CrystEngComm, 2013, 15, 3442–3447 RSC.
- A. Li, D. Xu, H. Lin, L. Yao, S. Yang, Y. Shao, Y. Zhang and Z. Chen, Phys. Chem. Chem. Phys., 2017, 19, 15693–15700 RSC.
- L. Li, C. Guo, S. Jiang, D. K. Agrawal and T. Li, RSC Adv., 2014, 4, 6391–6396 RSC.
- B. P. Singh, A. K. Parchur, R. S. Ningthoujam, P. V. Ramakrishna, S. Singh, P. Singh, S. B. Rai and R. Maalej, Phys. Chem. Chem. Phys., 2014, 16, 22665–22676 RSC.
- X. Wang, X. Kong, Y. Yu, Y. Sun and H. Zhang, J. Phys. Chem. C, 2007, 111, 15119–15124 CAS.
- Y. Tian, B. Tian, C. Cui, P. Huang, L. Wang and B. Chen, RSC Adv., 2015, 5, 14123–14128 RSC.
- J. Liao, L. Nie, Q. Wang, S. Liu, H. Wen and J. Wu, RSC Adv., 2016, 6, 35152–35159 RSC.
- X. Ye, Y. Luo, S. Liu, D. Hou and W. You, J. Alloys Compd., 2017, 701, 806–815 CrossRef CAS.
- J. Krüger and H. Müller-Buschbaum, Z. Anorg. Allg. Chem., 1984, 512, 59–64 CrossRef.
- M. Thirumoorthi and J. T. J. Prakash, Superlattices Microstruct., 2016, 89, 378–389 CrossRef CAS.
- X. Jia, Y. Zhou, J. Zheng, Y. Li, H. Zou and R. Xie, J. Alloys Compd., 2016, 688, 679–684 CrossRef CAS.
- Y. V. Yermolayeva, A. V. Tolmachev, M. V. Dobrotvorskaya and O. M. Vovk, J. Alloys Compd., 2011, 509, 5320–5325 CrossRef CAS.
- J. Yu, Y. Yang, R. Fan, D. Liu, L. Wei, S. Chen, L. Li, B. Yang and W. Cao, Inorg. Chem., 2014, 53, 8045–8053 CrossRef CAS PubMed.
- J. Yu, J. Yu, W. Ho, Z. Jiang and L. Zhang, Chem. Mater., 2002, 14, 3808–3816 CrossRef CAS.
- H. Lu, X. Yu, S. Yang, H. Yang and S. Tu, Fuel, 2016, 165, 215–223 CrossRef CAS.
- S. Saha, S. Das, U. K. Ghorai, N. Mazumder, B. K. Gupta and K. K. Chattopadhyay, Dalton Trans., 2013, 42, 12965–12974 RSC.
- Y. Bai, Y. Wang, G. Peng, K. Yang, X. Zhang and Y. Song, J. Alloys Compd., 2009, 478, 676–678 CrossRef CAS.
- K. Mishra, S. K. Singh, A. K. Singh and S. B. Rai, Mater. Res. Bull., 2013, 48, 4307–4313 CrossRef CAS.
- Z. Chen, T. Chen, W. Gong, W. Xu, D. Wang, Q. Wang and A. Srivastava, J. Am. Ceram. Soc., 2013, 96, 1857–1862 CrossRef CAS.
- Y. Gao, M. Fan, Q. Fang and F. Yang, New J. Chem., 2014, 38, 146–154 RSC.
- Q. Cheng, J. Sui and W. Cai, Nanoscale, 2012, 4, 779–784 RSC.
- S. H. Lee, H. Y. Koo, D. S. Jung, J. Han and Y. Kang, Opt. Mater., 2009, 31, 870–875 CrossRef CAS.
- P. Dai, X. Zhang, P. Sun, J. Yang, L. Wang, S. Yan and Y. Liu, J. Am. Ceram. Soc., 2012, 95, 1447–1453 CrossRef CAS.
- W. Yin, L. Zhao, L. Zhou, Z. Gu, X. Liu, G. Tian, S. Jin, L. Yan, W. Ren, G. Xing and Y. Zhao, Chem.–Eur. J., 2012, 18, 9239–9245 CrossRef CAS PubMed.
- D. Xu, C. Liu, J. Yan, S. Yang and Y. Zhang, J. Phys. Chem. C, 2015, 119, 6852–6860 CAS.
- D. Xu, H. Lin, A. Li, S. Yang and Y. Zhang, J. Mater. Chem. C, 2015, 3, 9869–9876 RSC.
- M. K. Mahata, T. Koppe, T. Mondal, C. Brusewitz, K. Kumar, V. Kumar Rai, H. Hofsass and U. Vetter, Phys. Chem. Chem. Phys., 2015, 17, 20741–20753 RSC.
- A. Li, D. Xu, Y. Zhang, H. Lin, S. Yang, Z. Chen and Y. Shao, J. Am. Ceram. Soc., 2016, 99, 1657–1663 CrossRef CAS.
- P. Li, Z. Wang, Z. Yang and Q. Guo, J. Mater. Chem. C, 2014, 2, 7823–7829 RSC.
- D. R. G. M. Pollnau, S. R. Lüthi and H. U. Güdel, Phys. Rev. B: Condens. Matter Mater. Phys., 2000, 61, 3337–3346 CrossRef.
- Y. Tian, Y. Tian, P. Huang, L. Wang, Q. Shi and C. Cui, Chem. Eng. J., 2016, 297, 26–34 CrossRef CAS.
- C. D. S. Brites, P. P. Lima, N. J. O. Silva, A. Millán, V. S. Amaral, F. Palacio and L. D. Carlos, New J. Chem., 2011, 35, 1177–1183 RSC.
- B. Dong, B. Cao, Y. He, Z. Liu, Z. Li and Z. Feng, Adv. Mater., 2012, 24, 1987–1993 CrossRef CAS PubMed.
Footnote |
| † Electronic supplementary information (ESI) available. See DOI: 10.1039/c7ra06054h |
| This journal is © The Royal Society of Chemistry 2017 |

