 Open Access Article
Preparation of low density amorphous poly(aryletherketone) foams and the study of influence factors of the cell morphology
Jiyong Zhao ab,
Zhipeng Wangac,
Honghua Wang*ac and
Guangyuan Zhou*a
aKey Laboratory of Polymer Ecomaterials, Changchun Institute of Applied Chemistry, Chinese Academy of Sciences, 5625 Renmin Street, Changchun, Jilin 130022, P. R. China. E-mail: gyzhou@ciac.ac.cn; wanghh@ciac.ac.cn
bUniversity of Chinese Academy of Sciences, Beijing 100049, P. R. China
cChangzhou Institute of Energy Storage Materials and Devices, Changzhou 213002, Jiangsu, P. R. China
First published on 25th July 2017
Abstract
Low-density foams of amorphous poly(aryletherketone) (PAEK) samples were prepared using supercritical carbon dioxide (ScCO2) as physical blowing agent. The samples exhibited a wide range of foaming temperature than crystal PAEK, leading to a more controllable fabrication process. An unusual relationship was observed between viscoelasticity and gel content under different molding times. The influence of gel content on foaming was explained using the nucleation and cell growth theories. In addition, the effects of processing parameters, such as temperature, pressure, and pressure release rate, were investigated. By controlling the gel content and processing parameters, foams with density under 0.1 g cm−3 were achieved.
1. Introduction
Polymeric foams are used in numerous applications because of their fine thermal conductivity, shock resistance, excellent strength-to-weight ratio, and high impact strength. With technological development, the demand for high-performance foams has increased particularly in high-temperature environments or in conditions requiring high mechanical strength. Thus, high-performance plastic foams have been an important research direction in the recent years. The method for improving the mechanical properties of traditional foams involves blending the plastics with additives, such as fibers and nanoparticles. However, these composite foams have limited applications at temperatures higher than 150 °C. Therefore, new types of foams must be developed to satisfy high-temperature conditions. Extensively studied high-performance foams include polymethacrylimide (PMI) foams,1–3 polyimide (PI) foams,4,5 polyetherimide (PEI) foams6,7 and polyphenylsulfone (PPS) foams,8,9 etc.Supercritical carbon dioxide (ScCO2) is an environment-friendly physical blowing agent. The main procedure of the foaming method is based on the following steps: (1) saturation of CO2 into the polymers at high pressure; (2) transformation of the polymer/CO2 mixture into supersaturated state by increasing the temperature or the releasing pressure and inducing nucleation; and (3) cell growth and fixing. The preparation of high-performance foams using ScCO2 as blowing agent has attracted increasing attention.10–13 PAEK is a type of high-performance plastic that exhibits excellent thermal, mechanical, and electrical properties and good corrosion resistance. According to the crystallization behavior, PAEK is divided into crystalline PAEK and amorphous PAEK. Wang et al.14 studied the foaming of crystalline PAEK by rapid-temperature-rise method and found that the appearance of the crystalline phase hindered CO2 diffusion and cell growth at foaming temperatures higher than 100 °C. As a result, non-uniform cell distribution was observed. Jiang et al.15 prepared low-density foams of crystalline PAEK near the melting point through rapid-pressure-release method. The crystalline phase inevitably emerged with cell growth, thereby restricting the expansion ratio. However, increasing the temperature reduced the melt strength, leading to cell coalescence. The narrow process window complicates the acquisition of uniform products, which is a common problem for crystalline polymers foaming. Therefore, amorphous PAEK is the preferred material for producing foams. Wang et al.16 synthesized amorphous PAEK by introducing an adamantyl group and produced porous PAEK films using CO2 as the blowing agent. Uniform microcellular and nanocellular foams can be synthesized by controlling the adamantyl group content and the foaming condition. The CO2 concentration increased with increasing content of the adamantyl group because of expanded free volume. Zhu et al.17 fabricated cross-linked PAEK foams (with a minimum cell size of 86 nm) by controlling the cross-linking degree. Herein, we have tried to deduce the relationship between stored elastic energy and cell nucleation rate and discussed the influence of the former on cell structures. Qi et al.18 synthesized PAEK containing thermally labile tert-butyloxycarbonyl, which can generate CO2 in situ using isobutene as the foaming agent. By simple thermal treatment, they produced close microcellular porous films. Most previous studies are focused on the preparation of microcellular or nanocellular foams or films with high density. However, preparation of low-density PAEK foams, which considerably differ from nanocellular foams, has been rarely investigated. Therefore, it is necessary to develop a type of amorphous PAEK foam with low density and also to study the influencing factors.
Herein, polyetherketone with cardo (PEK-C) was selected as the matrix polymer. Low-density PAEK foams were prepared using ScCO2 as the blowing agent. Factors influencing the final cell structures are also discussed in detail.
2. Experimental
2.1. Materials
Commercial PEK-C was obtained from Xuzhou Plastic Factory (Mw = 13.5 × 10⁴, PDI = 2.8, ρ = 1.3 g cm−3). Carbon dioxide with purity exceeding 99.99% was purchased from JuYang Company.2.2. Experiment procedure
PEK-C powder was compressed into plates in a vulcanizer under the pressure of 5 MPa and temperature of 360 °C for a certain time. Then, the mould was cooled in a cold vulcanizer under the same pressure until the temperature decreased to room temperature, and the plate was taken out afterwards. The thickness of the plates was about 3 mm.The prepared plate was placed in a self-made autoclave, which had been heated to the foaming temperature. CO2 was delivered via a syringe pump to a certain pressure. After saturation for a sufficient time, the pressure was released rapidly to ambient pressure (less than 1 s). Then, the foam was taken out quickly and fixed at room temperature.
2.3. Characterization
Dynamic mechanical analysis (DMA) was performed using a DMA + 450 instrument from Metravib Company. The DMA samples of 40 mm × 10 mm × 3 mm size were cut down from prepared plates. The test was carried out from room temperature to 300 °C with an oscillator frequency of 50 Hz.The gel content was calculated by the formula m2/m1, where m1 is the initial mass of the sample and m2 is the mass after reflux in a Soxhlet extractor using CHCl3 as solvent for 72 h at 70 °C.
The morphologies of the foams were characterized primarily via scanning electron microscopy (SEM). Foamed samples were cryofractured after immersion in liquid N2 for 10 min, sputter-coated with ∼200 A of gold, and viewed using a Hitachi XE-100 + EDAX SEM. The resulting micrographs were analyzed by Image Pro Plus to determine the average cell diameter and cell density. For statistical accuracy, more than 100 bubbles were tested in one image. The cell density N0 is determined by eqn (1):
 | (1) |
 ,
,  n is the number of cells on the SEM image, A is the real area of the image (cm2), and D is the cell diameter.
The densities of the foams were calculated by equation ρ = m/V, where m was measured using an analytical balance from TA Company, and V was measured using the Archimedes' principle.
3. Results and discussion
PEK-C is a typical amorphous PAEK, which has been industrialized. The rigid big cardo endows PEK-C with good solubility and high Tg (230 °C). Moreover, it is beneficial for higher CO2 solubility than crystalline PAEK because of the larger free volume, which is favorable for foamability. The relationship between foaming results and influencing factors was studied in detail as follows.3.1. Influence of molding time on PEK-C plates
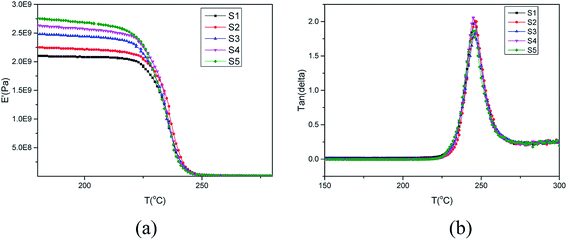
PEK-C crosslinking occurs to a certain extent during the molding process19–21 and the thermal oxidative crosslinking mechanism involved is shown in Scheme 1. As we can see, oxygen participates in the reaction and also bridges the phenylene rings in the main chains with the cardo groups. Table 1 lists the gel contents of PEK-C plates molded at 360 °C for different durations. The gel content increases from 5% to 57% when the molding time is prolonged from 7 min to 120 min. Moreover, the gel content increases rapidly at the beginning of the molding process, and the increase rate slows down under prolonged molding. Fig. 1 shows the storage modulus and loss tangent (tan![[thin space (1/6-em)]](https://www.rsc.org/images/entities/char_2009.gif) δ) of PEK-C samples produced under different molding times. The storage modulus of PEK-C samples increases with increasing molding time under the glass transition temperature (Tg). The modulus then tends to similar values with further increase in temperature. Fig. 1(b) also shows that PEK-C samples share a common Tg. Theoretically, Tg increases with increasing the crosslinking degree. The abnormal phenomenon observed in our experiments is uncommon. We suppose that the macromolecule chains form local crosslinking points, instead of a network structure. These points reduce the polymer solubility in the solvent, but the crosslinking degree is insufficient to affect the motion of the chain segment, resulting in the same Tg for all samples.
δ) of PEK-C samples produced under different molding times. The storage modulus of PEK-C samples increases with increasing molding time under the glass transition temperature (Tg). The modulus then tends to similar values with further increase in temperature. Fig. 1(b) also shows that PEK-C samples share a common Tg. Theoretically, Tg increases with increasing the crosslinking degree. The abnormal phenomenon observed in our experiments is uncommon. We suppose that the macromolecule chains form local crosslinking points, instead of a network structure. These points reduce the polymer solubility in the solvent, but the crosslinking degree is insufficient to affect the motion of the chain segment, resulting in the same Tg for all samples.
| S1 | S2 | S3 | S4 | S5 | |
|---|---|---|---|---|---|
| Molding time | 7 min | 15 min | 30 min | 60 min | 120 min |
| Gel content | 5% | 10% | 46% | 55% | 57% |
The influence of gel content on foaming result was investigated. PEK-C samples S1–S5 were saturated with CO2 at 12 MPa and 230 °C, 260 °C, or 290 °C. After 2 h of processing, pressure was released within 1 s and the foam was rapidly removed from the autoclave. At 230 °C, the foam density increases with increasing gel content. The average cell size increases from 2.9 to 11.6 μm with increasing gel content from 5% to 46% and decreases to 6.6 μm when the gel content is increased to 57%. The cell density decreases initially from 4.0 × 10¹⁰ to 1.6 × 10⁹ and then increases to 5.0 × 10⁹ thereafter. This phenomenon can be explained using the nucleation theory.
As Zhu17 described, for polymer matrix in temporary high-elastic state, the elasticity is a key factor that affects the nucleation. The free energy required to form nucleated bubbles is given by eqn (2):
 | (2) |
The energy barrier for nucleation and the rate of homogeneous nucleation are given by eqn (3) and (4), respectively:
 | (3) |
 | (4) |
Studies22,23 indicated that cells nucleate and grow in a quite short time at the start of the foaming process. According to time–temperature equivalence principle, the elasticity may increase with increasing gel content at temperatures above Tg in the dynamic process, although the modulus seems to be no difference for the samples as shown in Fig. 1(a). Therefore, the nucleation rate decreases with increasing gel content. Less cell nucleus is beneficial for cell growth as more gases can be used for single cell growth. Hence, the cell sizes of S1, S2, and S3 show an increasing trend. However, cell growth is limited by polymer elasticity; as such, the cell size decreases with increasing gel content for S3, S4, and S5. A similar phenomenon was observed between samples processed at 260 °C and 230 °C. When foaming temperature increased to 290 °C, serious cell coalescence and rupture was detected in S1. The gas escape eventually results in high foam density, large cell size, and low cell density (Fig. 2). Among samples with similar elasticity, the cell structures of S2, S3, S4 and S5 are the same (Fig. 3).
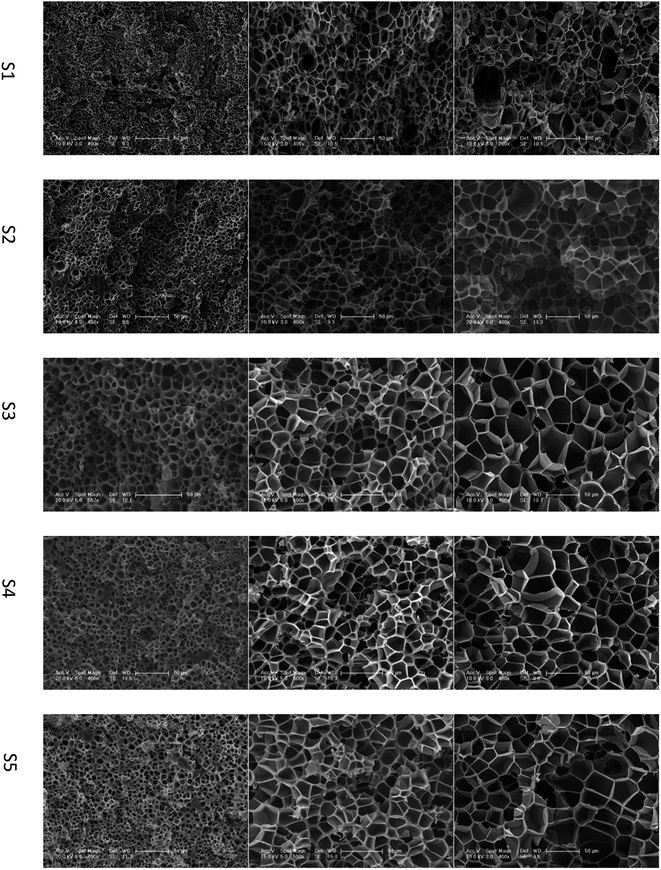 | ||
| Fig. 2 SEM images of PEK-C foams with different gel contents (saturation time: 2 h; pressure: 12 MPa). The scale bar for S1 at 290 °C is 100 μm, and the scale bar for the other samples is 50 μm. | ||
 | ||
| Fig. 3 Effect of gel content on (a) foam density, (b) average cell size, and (c) cell density of PEK-C foams (saturation time: 2 h; pressure: 12 MPa). | ||
3.2. Determination of saturation time
Sufficient CO2 sorption is an indispensable precondition for highly expanded foams and homogeneous cell distribution. Considering the limitations for accurate measurement of CO2 content at the foaming temperature, we used an indirect method to determine the saturation time. Fig. 4 shows the foaming result of samples (S5) at 230 °C under different absorbing times. After absorbing CO2 for 0.5 and 1 h, the samples show non-homogeneous morphologies in the cross section. The interior of the samples apparently failed to nucleate because of the non-homogeneous CO2 concentration. When the absorption time was increased to 2 h, a sample with homogeneous cell distribution was achieved. As shown in Fig. 4(c) and (d), the cell structure minimally changes as the absorption time extends to 3 h. Thus, we assume that CO2 is fully saturated within 2 h at 230 °C. The CO2 diffusion rate increases with increasing temperature and the samples easily obtain a homogeneous CO2 concentration at high temperatures. Hence, all samples in our experiments absorb CO2 in the autoclave for at least 2 h before the pressure-release.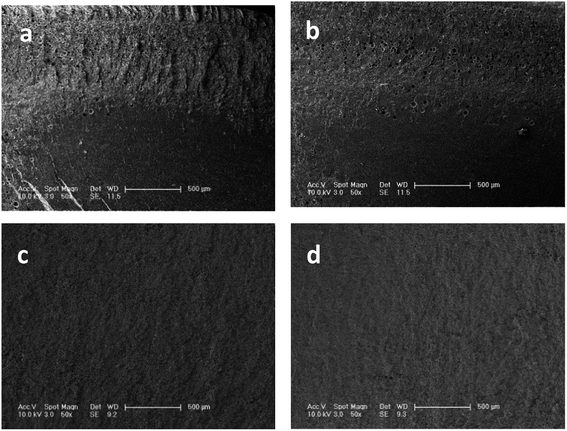 | ||
| Fig. 4 SEM images of PEK-C foams prepared at 230 °C after different absorption times: (a) 0.5 h, (b) 1 h, (c) 2 h, and (d) 3 h. | ||
3.3. Influence of foaming temperature
To investigate the influence of foaming temperature on the foam density and cell morphology, PEK-C plates (S2) were foamed in the temperature range of 230–300 °C after absorbing CO2 for 2 h at 12 MPa. As shown in Fig. 5, the foam density decreases with increasing the cell density as well as the temperature from 230 °C to 300 °C. In contrast, the cell size increases with increasing temperature. This finding can be explained by the fact that temperature affects the elasticity of the matrix polymer. The force of restricting cell growth weakens as a result of decreasing elasticity with increasing temperature, thereby promoting cell growth to obtain large cells and high expansion ratio. In addition, as the temperature increases to a certain extent, the elasticity decreases, leading to an inability to support cell growth. Consequently, cell coalescence occurs, and the cell size increases [Fig. 6(c)]. As the temperature continues to increase, cell coalescence occurs and reduces the expansion ratio as various amounts of gases escape [Fig. 6(d)]. The change of foam density is moderate at foaming temperature ranging from 270 °C to 300 °C. This wide processing window facilitates the preparation of desired foams compared to crystalline PAEK.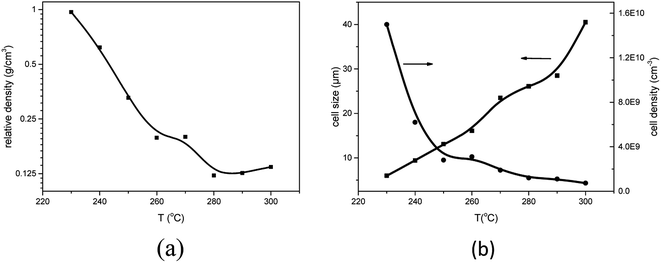 | ||
| Fig. 5 Effect of foaming temperature on (a) foam density, (b) average cell size and cell density for PEK-C (S2) foams (saturation pressure: 12 MPa). | ||
 | ||
| Fig. 6 SEM images of PEK-C foams (S2) prepared at 12 MPa and at different temperatures: (a) 230 °C; (b) 250 °C; (c) 280 °C; and (d) 300 °C (scale bar: 50 μm). | ||
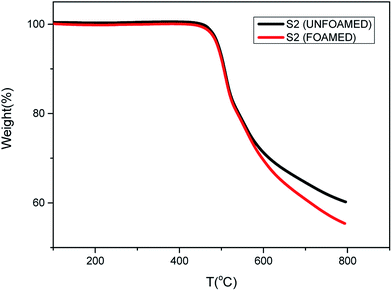
Fig. 7 shows the thermal properties of S2 before and after foaming at 280 °C and 12 MPa. The same initial decomposition temperature around 450 °C is observed, which means that PEK-C foams exhibit excellent thermal properties as PEK-C resins. However, at around 600 °C, the decomposition rate of foamed S2 becomes faster than unfoamed S2. This can be attributed to the porous structure and the large surface area of the foams.
3.4. Influence of foaming pressure
As studied by several researchers, the saturation pressure is definitely an important factor in the foaming process. Herein, PEK-C sample S3 was foamed under different pressure levels at a constant temperature (280 °C) to determine the influence of pressure on foaming. As shown in the SEM images in Fig. 8, the foam structure changes with increasing pressure. The cell size and foam density decrease with increasing pressure, whereas the cell density increases with pressure. This finding can be explained by the nucleation theory. At high pressure levels, C0 and ΔP shown in eqn (4) increase, resulting in high nucleation rate. The amount of cell nucleus formed in a given volume and time is greater as a result. According to the cell growth theory, the gas used for one cell growing is little and leads to a small cell size. At lower pressure levels, the energy barrier to nucleation is high, and the nucleation rate decreases. The distance between neighboring nuclei is longer; hence, the amount of gas used for single cell growth increases, and the interaction between two cells is small. These phenomena lead to cells with large sizes and low densities. The lowest density (0.142 g cm−3) is acquired at 16 MPa, which can be attributed to the high CO2 concentration (Fig. 9). | ||
| Fig. 8 SEM images of PEK-C foams (S3) prepared at 280 °C and different pressure levels: (a) 8 MPa; (b) 10 MPa; (c) 12 MPa and (d) 16 MPa (scale bar 100 μm). | ||
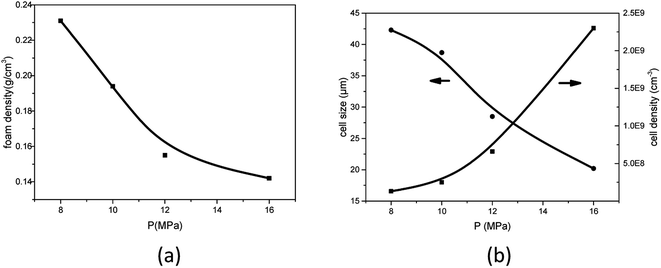 | ||
| Fig. 9 Effect of foaming pressure on (a) foam density and (b) average cell size and cell density for PEK-C (S3) foams (foaming temperature: 280 °C). | ||
3.5. Influence of pressure release rate
To discuss the influence of pressure release rate on the cell structure, we designed the following experiment. PEK-C samples were saturated with CO2 at 12 MPa and 290 °C. Pressure was released at different rates by controlling the valve, and then the foams were rapidly removed. Different release times of 1, 9.8, 28.5, and 47.6 s were used to reduce the pressure of 12 MPa to ambient pressure. Fig. 10 shows that the cell size increases remarkably with the increase of pressure release time, but the cell density decreases. Clearly, the nucleation rate decreases with decreasing the pressure release rate, which is similar to the analysis in Part 3.4. The distance between neighboring nuclei increases; as such, a large amount of gas is used for cell growth. Moreover, the interaction between cells weakens, thereby reducing cell rupture. These phenomena eventually lead to the formation of large cells. As shown in Fig. 11(a), the foam density decreases from 0.126 g cm−3 to 0.092 g cm−3 when the pressure release time increases from 1 s to 28.5 s. This finding can be attributed to reduced cell coalescence and gas escape. The foam density increases to 0.109 g cm−3 when the pressure release time is increased to 47.6 s because a low nucleation rate limits the expansion of polymer foams. Therefore, it is an efficient method to control the pressure release rate to improve the expansion ratio of foams for polymers, whose melt elasticity is not strong enough, and generate cell rupture or coalescence.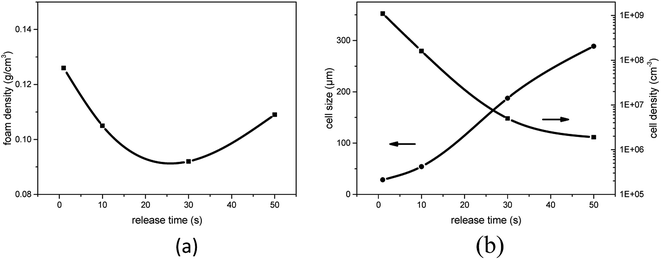 | ||
| Fig. 11 Effect of foaming pressure on (a) foam density and (b) average cell size and cell density for PEK-C (S2) foams (saturation pressure: 12 MPa; temperature: 290 °C). | ||
4. Conclusions
Low-density PEK-C foams were prepared using CO2 as the blowing agent through a pressure release process. Foams with density lower than 0.1 g cm−3 were obtained by controlling the processing parameters. The gel content, which was induced in the molding process, is discussed as an important factor of the cell structure. For samples with low gel content, high temperature and pressure led to cell coalescence and rupture, thereby increasing the foam density. Proper gel content could increase the melt elasticity and keep the cells unbroken. Moreover, the influence of processing parameters on the foaming results was also investigated. The foam density decreased with increasing saturation temperature and pressure. A wide foaming temperature window from 270 °C to 300 °C was observed for PEK-C foams with density below 0.2 g cm−3, which could be moderately controlled. In addition, appropriately extending the pressure release time could reduce cell coalescence and foam density. A study about the mechanical property of low density PEK-C foams will be carried out in future investigations.Acknowledgements
This study is supported by the National High Technology Research and Development Program (863 program, No. 2015AA033901) as well as the Jilin Province Science and Technology Program (20150203004GX).References
- Z. Y. Zhang, M. J. Xu and B. Li, J. Appl. Polym. Sci., 2017, 134, 44959–44967 Search PubMed.
- L. Zheng, X. X. Ma, Z. Q. Chen, F. Hu and X. M. Wu, CN201610678069.9, 2017.
- J. T. Siivola, S. Minakuchi and N. Takeda, J. Sandwich Struct. Mater., 2015, 17, 335–358 CrossRef CAS.
- J. W. Li, G. C. Zhang, Y. Yao, Z. X. Jing, L. S. Zhou and Z. L. Ma, RSC Adv., 2016, 6, 60094–60100 RSC.
- W. T. Zhai, W. W. Feng, J. Q. Ling and W. G. Zheng, Ind. Eng. Chem. Res., 2012, 51, 12827–12834 CrossRef CAS.
- H. Abbasi, M. Antunes and J. I. Velasco, Eur. Polym. J., 2015, 69, 273–283 CrossRef CAS.
- L. Cafiero, S. Iannace and L. Sorrentino, Eur. Polym. J., 2016, 78, 116–128 CrossRef CAS.
- V. Bernardo, J. Martín-de León and M. A. Rodríguez-Pérez, Mater. Lett., 2016, 178, 155–158 CrossRef CAS.
- Z. L. Ma, G. C. Zhang, Q. Yang, X. T. Shi, J. T. Li and X. L. Fan, Polym. Compos., 2016, 37, 2527–2540 CrossRef CAS.
- L. Sorrentino, M. Aurilia and S. Iannace, Adv. Polym. Technol., 2011, 30, 234–243 CrossRef CAS.
- L. Sorrentino, L. Cafiero and S. Iannace, Polym. Eng. Sci., 2015, 55, 1281–1289 CAS.
- Z. L. Ma, G. C. Zhang, X. T. Shi, Q. Yang, J. T. Li, Y. Liu and X. L. Fan, J. Appl. Polym. Sci., 2015, 132, 42634–42647 CrossRef.
- R. M. B. krause, N. F. A. van der Vegt and M. Wessling, Macromolecules, 2001, 34, 874–884 CrossRef.
- D. Wang, H. Gao, W. Jiang and Z. H. Jiang, J. Polym. Sci., Part B: Polym. Phys., 2007, 45, 2890–2898 CrossRef CAS.
- Z. H. Jinag, H. Wang, S. L. Zhang, W. C. Guo and G. B. Wang, CN201210500786.4, 2012.
- H. Wang, S. L. Zhang, B. J. Liu, W. C. Guo, G. B. Wang and Z. H. Jinag, Chem. J. Chin. Univ., 2013, 34, 1033–1035 CAS.
- S. S. Zhu, Z. Chen, B. Han, G. B. Wang, Z. H. Jiang and S. L. Zhang, RSC Adv., 2015, 5, 51966–51974 RSC.
- D. Qi, C. J. Zhao, L. Y. Zhang, X. F. Li, G. B. Li and H. Na, Polym. Chem., 2015, 6, 5125–5132 RSC.
- S. P. Liu and M. Li, HIET Journal, 1989, 12, 52–55 Search PubMed.
- Z. Y. Zhang and H. M. Zeng, Mater. Eng., 1993, 10, 5–8 Search PubMed.
- W. Zhang, J. Xu, Y. L. Yu, R. F. Zhang and T. L. Chen, Chin. J. Appl. Chem., 1991, 8, 77–79 CAS.
- Y. Li, Z. Yao, Z. H. Chen, K. Cao, S. L. Qiu, F. J. Zhu, C. C. Zeng and Z. M. Huang, Chem. Eng. Sci., 2011, 66, 3656–3665 CrossRef CAS.
- P. Zhang, X. J. Wang, Y. Yang and N. Q. Zhou, J. Appl. Polym. Sci., 2010, 118, 1949–1955 CAS.
| This journal is © The Royal Society of Chemistry 2017 |


