DOI:
10.1039/C7RA05864K
(Paper)
RSC Adv., 2017,
7, 38350-38359
A new adsorbent of Pb(II) ions from aqueous solution synthesized by mechanochemical preparation of sulfonated expanded graphite
Received
25th May 2017
, Accepted 24th July 2017
First published on 3rd August 2017
Abstract
In this study, sulfonated expanded graphite (SEG) was prepared through a mechanochemical method between EG, N,N-dimethylformamide, and a sulphur trioxide pyridine complex. XRD, XPS, FT-IR, BET, SEM-EDS, and zeta potentials were used to assess the characterizations of SEG. Thereafter, the effects of pH, adsorbent dosage, initial concentration, temperature, and contact time on adsorption performances were investigated. Results demonstrated that SEG shows superior adsorption properties to remove Pb(II) with high efficiency, and the removal capacity reached 325.12 mg g−1. The Langmuir model fit the equilibrium data better than either the Freundlich model or the Temkin model. Based on kinetic experiments, the adsorption of Pb(II) with SEG was perfectly described by a pseudo-second order kinetics model. According to thermodynamic parameters, the adsorption process was endothermic and spontaneous. Adsorption–desorption results showed a superior regeneration and cyclic performance of SEG as well. In addition, results of the adsorption mechanism indicated that the sulfonated functional groups played a significant role during the adsorption process.
Introduction
Nowadays with the rapid development of industries, heavy metal ions in industrial streams, wastewater, and soil are grave threats to aquatic and soil ecosystems.1–3 Therein, lead is recognized as one of the most common heavy metals.4 The social concerns of lead(II) ions in an aquatic environment are their toxicity and carcinogenicity as well as non-biodegradability in the food chain.5–7 Accumulated lead(II) can do great harm to the environment and to the health of humans and other organisms, even at low concentrations.8 Hence, it's of extreme importance and urgency to decrease concentrations of lead(II) ions in effluents. Until now, several advanced technologies and treatments for lead(II) ion removal have been applied including membrane separation, ion exchange, coagulation, reverse osmosis, and absorption.9–11 Among these methods, the adsorption technique has been considered for large scale applications due to its high efficiency, technical flexibility, and cost-effectiveness.12–14
Graphite is a type of allotrope carbon with the strongest stability, consisting of carbon layers linked by weak van der Waals.15,16 In consequence of its special structure, it is effortless for graphite to insert atoms, and even molecules with large groups, to produce graphite intercalation compounds (GICs). Expanded graphite (EG) is obtained by heating GICs at a high temperature with puffing along the crystallographic c-axis.17,18 EG is vermiform and porous; it also has particular properties such as network structure, eminent stability, developed specific surface, and good hydrophobicity,19–21 which make EG to have good absorption properties. Formerly, a number of chemically modified expanded graphites have been prepared for adsorption to remove various heavy metal ions and dyestuffs, such as MnO2 modified expanded graphite to remove Cr(VI)22 and oxidizing acid modified expanded graphite to remove methylene blue.23 Compared with these modified expanded graphites, sulfonated expanded graphite showed advantages of celerity, low cost, and an undemanding synthesis process.
The objective of this study was to apply mechanochemical preparation to synthesize sulfonated expanded graphite. Additionally, the effects of various experimental conditions were investigated, as well as adsorption behaviors through adsorption isotherms, kinetics, and thermodynamics studies. The mechanism was elucidated by using XRD, zeta potentials, XPS, BET, and FTIR techniques.
Experimental
Material and chemicals
Flaky graphite with an average size of 300 μm were obtained as flotation concentrates from Mozambique. Sulphur trioxide pyridine complex (SO3-Py) was purchased from Aladdin Chemistry Co., Ltd. (China); N,N-dimethylformamide (DMF) and absolute ethyl alcohol were obtained from Sinopharm Chemical Reagent Co., Ltd. (China). All regents were of analytical grade and used without further purification.
Sulfonated expanded graphite
Expanded graphite was prepared through a modified procedure based on previous literature reports.24,25 In brief, a mixture of concentrated nitric acid and acetic acid, was mixed with flaky graphite at a temperature of 50 °C for 1 h. Then the acid-treated graphite was washed to a neutral pH, and dried at 60 °C. The resulting expansible graphite was heated to 850 °C in a muffle furnace for just 30 seconds (its expansion volume could reach approximately 350 mL g−1).
Sulfonated expanded graphite (SEG) was synthesized by a mechanochemical method in wet conditions. First, 1 g EG was dispersed in 100 mL DMF with stirring for a while. Afterwards, 0.5 mmol SO3-Py was added to the solution. Then, the mixture was wet milled by using a planetary mill in a steel cylinder with steel balls of 20 mm diameter at 300 rpm for 2.5 h. Finally, the obtained black colored products were filtered and washed several times with absolute ethyl alcohol and dried at 60 °C for several hours in a vacuum oven.
Characterization
Surface morphology was examined using a JSM-IT300 scanning electron microscope (SEM) and an energy dispersive spectrometer (EDS) was used to analyze surface chemical compositions (JEOL, Tokyo, Japan). X-ray diffraction (XRD) patterns were determined by a D8 Advance model X-ray powder diffractometer (Bruker Corporation, Stuttgart, Germany) with Cu Kα radiation (λ = 0.15412 nm) recorded in the range of 2θ = 5–70°. Fourier transform infrared (FT-IR) spectra were recorded with a Nicolet IS-10 infrared spectrophotometer (Nicolet Corporation, Madison, USA) for analysis in the range from 400 to 4000 cm−1. Zeta potentials of SEG with possession of 5 × 10⁻³ mol L−1 NaCl at different pH values were determined with a Malvern Zetasizer Nano ZS90 (Malvern Instrument Corporation, Malvern, UK). X-ray photoelectron spectroscopy (XPS) was carried out on a VG Multilab 2000 spectrometer (Thermo Electron Corporation, Waltham, MA, USA), with the XPS spectra being corrected by the C 1s line at 284.6 eV. Specific surface areas of the samples were calculated by the Brunauer–Emmett–Teller (BET) method using an ASAP 2020M N2 adsorption–desorption apparatus (Micromeritics Instrument Corporation, Atlanta, USA).
Adsorption experiments
A batch of adsorption experiments were conducted in 250 mL conical flasks, each containing 100 mL Pb(II) ions solution. A standard solution of Pb(II) (100 mg L−1) was prepared by dissolving 0.1599 g Pb(NO3)2 in 1000 mL of deionized water. The adsorbent doses of SEG ranged between 0.01 g and 0.08 g. Experiments were performed at an initial metal concentration of 20 mg L−1 Pb(II) and pH = 5.59, with the mixture shaken in a controlled shaker at 150 rpm at 30 °C for 15 min. Afterwards, the adsorbents were separated from their solutions through filtration; in addition, amounts of remaining Pb(II) ion concentration were analyzed via an ultraviolet spectrophotometer at a wavelength of 575 nm, which is the maximum absorbance. The amounts of Pb(II) ions adsorbed at any time were calculated from their concentrations in solutions before and after adsorption. Removal efficiency and amount of Pb(II) adsorbed were calculated using the following equations:| |
 | (1) |
| |
 | (2) |
where qt (mg g−1) is the adsorbed amounts at any time; C0 and Ct (mg L−1) are the initial and final concentrations of Pb(II) ion in the solution, respectively. V (L) is the volume of the Pb(II) ions solution. Finally, m (g) is the amounts of adsorbents added into the solution.
Desorption and regeneration experiments
Desorption experiments were carried out with different eluents. At first, the adsorption experiments were completed and the spent adsorbents were separated through filtration. After that, the desorption treatment was conducted by adding spent adsorbent to 100 mL eluent with a high rate of stirring for 2 hours. Then, the Pb(II)-loaded adsorbent was washed thoroughly for the next cycle and the concentrate of Pb(II) at each step was measured by an ultraviolet spectrophotometer mentioned above. The desorption efficiency was calculated using the following equation:| |
 | (3) |
where Cr is the equilibrium concentration of Pb(II) in the solution after desorption.
Results and discussion
SEM images of EG
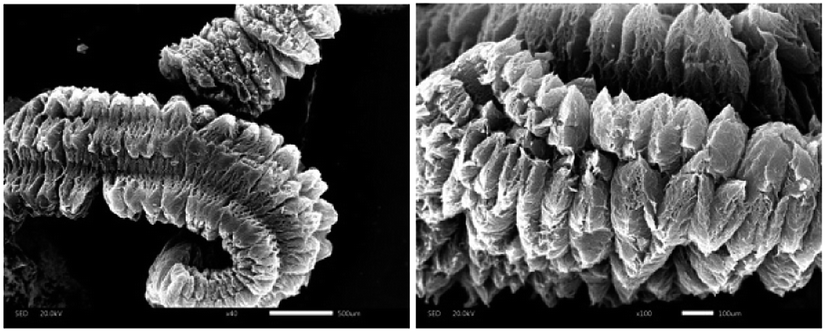
The SEM images of expanded graphite, the product of expansible graphite after puffing at a high temperature, are shown in Fig. 1. During the process of intercalation, nitrate and acetate ions of nitric acid and acetic acid took part in the reaction, entering into the carbon atoms layers, while nitrate and acetate ions would decrease as attributed to the high-temperature pyrolysis. With the vaporization between the graphite layers, expansible graphite turned into a fluffy product during the process of expansion. The photograph clearly shows the vermiform and porous appearance, and the chain structure is evident as well.
 |
| | Fig. 1 SEM images of EG. | |
Characterization of SEG
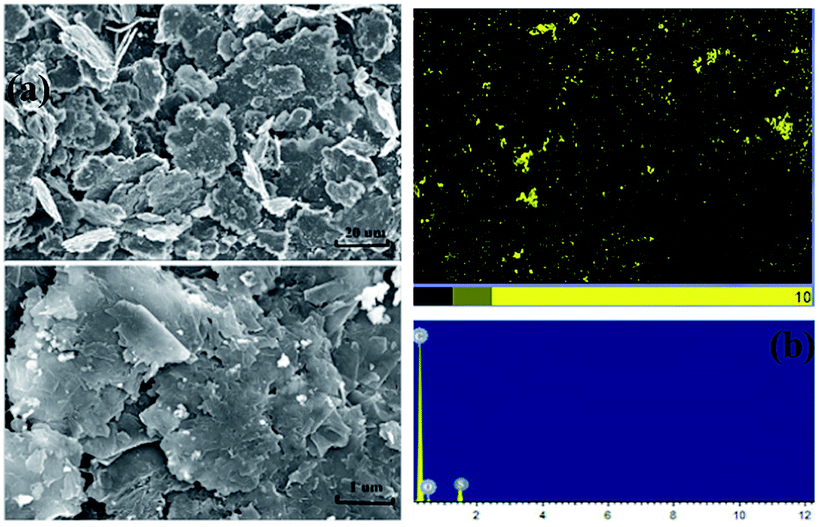
Fig. 2(a) shows the surface morphology of mechanochemically sulfonated expanded graphite by the milling process through SEM analysis. Compared with the large thick-massive particles of EG, the micrograph of SEG indicated a progressive increase in porosity and a remarkable decrease in the particle size after grinding with SO3-Py and DMF. Since surface porosity plays an important role in adsorption, the porous surface of SEG modified by formation of sulfonated functional groups was likely to promote the adsorption and diffusion of heavy metal ions, resulting in improved removal of Pb(II). As shown in Fig. 2(b), the S element distributed on its surface was present as well as in the corresponding EDS spectrum. Mass fractions at the SEG interface are as follows: C = 85.87%, O = 4.86%, S = 8.46% and N = 0.84%. Obviously, the C concentration is the highest, followed by S and O. The presence of S demonstrated that the combination of EG and SO3-Py resulted in sulfonated functional groups being attached on the surface for better adsorption performance.
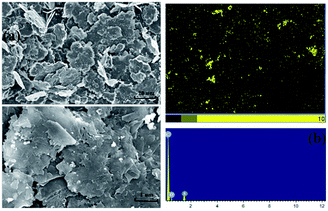 |
| | Fig. 2 SEM images of SEG (a) and EDS-mapping for the S (b) in the surface. | |
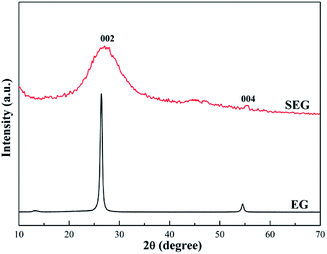
Fig. 3 shows the crystalline structure of the original and sulfonated expanded graphite as evidenced by XRD. EG shows a strong peak at 2θ = 26.41°, due to the diffraction of 002 planes. And beyond that, another relatively weaker peak appears at 2θ = 54.61°, resulting from the 004 planes diffracting. Compared with original expanded graphite, the pattern of SEG made an evident difference; plus a dominant and broad peak at approximately 2θ = 25.01° turned up. In addition, the correspondent peak intensity of sulfonated expanded graphite markedly decreased as a consequence of plentiful replacement superficial carbon atoms with sulfonic groups. Additional information that can be obtained from the pattern is the degree of graphitization, also called “the crystallinity of graphite”,26–28 which can be calculated through the equation:
| | |
d002 = 0.3440 − (0.3440 − 0.3354)r(2 − r)
| (4) |
where 0.3440 is the interlayer spacing of the fully disordered graphitic carbon (nm), 0.3354 is the interlayer spacing of the ideal graphite crystal (nm), and
d002 is the interlayer distance measured by XRD using the Bragg equation. The result for SEG was 58.49%, reduced significantly compared to that of EG, which was 88.02%. These findings revealed that the modification by sulfonated treatment could deconstruct the crystalline region and set free more carbon atoms to combine with oxygen atoms.
 |
| | Fig. 3 XRD patterns of EG and SEG. | |
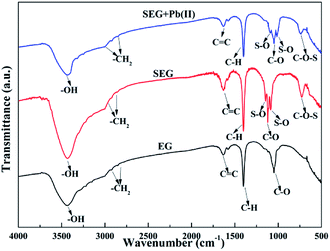
Fig. 4 presents the FT-IR spectra, which were applied to determine the main functional groups of SEG for elucidating the adsorption mechanism. The adsorption peaks at 3448.36 cm−1 found in each sample could correspond to the stretching vibrations of –OH from vapour and crystal water.29 Moreover, the bands at nearly 2950 and 2850 cm−1 might correspond to the –CH2 stretching vibrations, while the band at 1652.52 cm−1 could be attributed to the C![[double bond, length as m-dash]](https://www.rsc.org/images/entities/char_e001.gif) C stretching mode for both of EG and SEG.22,30 In addition, the peaks at 1400.83 cm−1 expressed the appearance of C–H in the –CH3 group, while those at 1116.58 cm−1 of SEG could result from the –CO stretching for the keto form and secondary alcohol.31,32 After the mechanochemical synthesis of SEG, two new strong adsorption peaks showed up at positions around 1235 and 1070.12 cm−1, which could be attributed to asymmetrical and symmetrical S–O stretching vibrations, and the peak located at approximately 729.10 cm−1 could be ascribed to symmetrical vibration of C–O–S distributed to C–O–SO3 groups.33 Thus, appearance of adsorption peaks due to the vibrations of S–O and C–O–S demonstrated that the bridging function of O atoms to combine SO3-Py and EG played an indispensable role.
C stretching mode for both of EG and SEG.22,30 In addition, the peaks at 1400.83 cm−1 expressed the appearance of C–H in the –CH3 group, while those at 1116.58 cm−1 of SEG could result from the –CO stretching for the keto form and secondary alcohol.31,32 After the mechanochemical synthesis of SEG, two new strong adsorption peaks showed up at positions around 1235 and 1070.12 cm−1, which could be attributed to asymmetrical and symmetrical S–O stretching vibrations, and the peak located at approximately 729.10 cm−1 could be ascribed to symmetrical vibration of C–O–S distributed to C–O–SO3 groups.33 Thus, appearance of adsorption peaks due to the vibrations of S–O and C–O–S demonstrated that the bridging function of O atoms to combine SO3-Py and EG played an indispensable role.
 |
| | Fig. 4 FT-IR spectra of EG, SEG and Pb(II)-loaded SEG. | |
Table 1 shows the surface atom concentrations of EG and SEG derived by XPS. The low concentrations of N could result from the entrance of nitric acid during the process to prepare EG, while the tiny amount of S should be attributed to an impurity not removed in the graphite. After mechanochemical modification, the concentration of S on the surface increased with a relatively large rise; on the contrary, the concentration of C decreased, indicating that the sulfonated modification made EG combine with –SO3 effectively.
Table 1 XPS-derived surface concentrations of EG and SEG
| Samples |
Atomic concentration of elements/% |
| C |
O |
N |
S |
| EG |
95.74 |
2.87 |
1.34 |
0.05 |
| SEG |
84.50 |
5.35 |
1.29 |
8.86 |
| Δ |
−11.24 |
2.48 |
−0.05 |
8.81 |
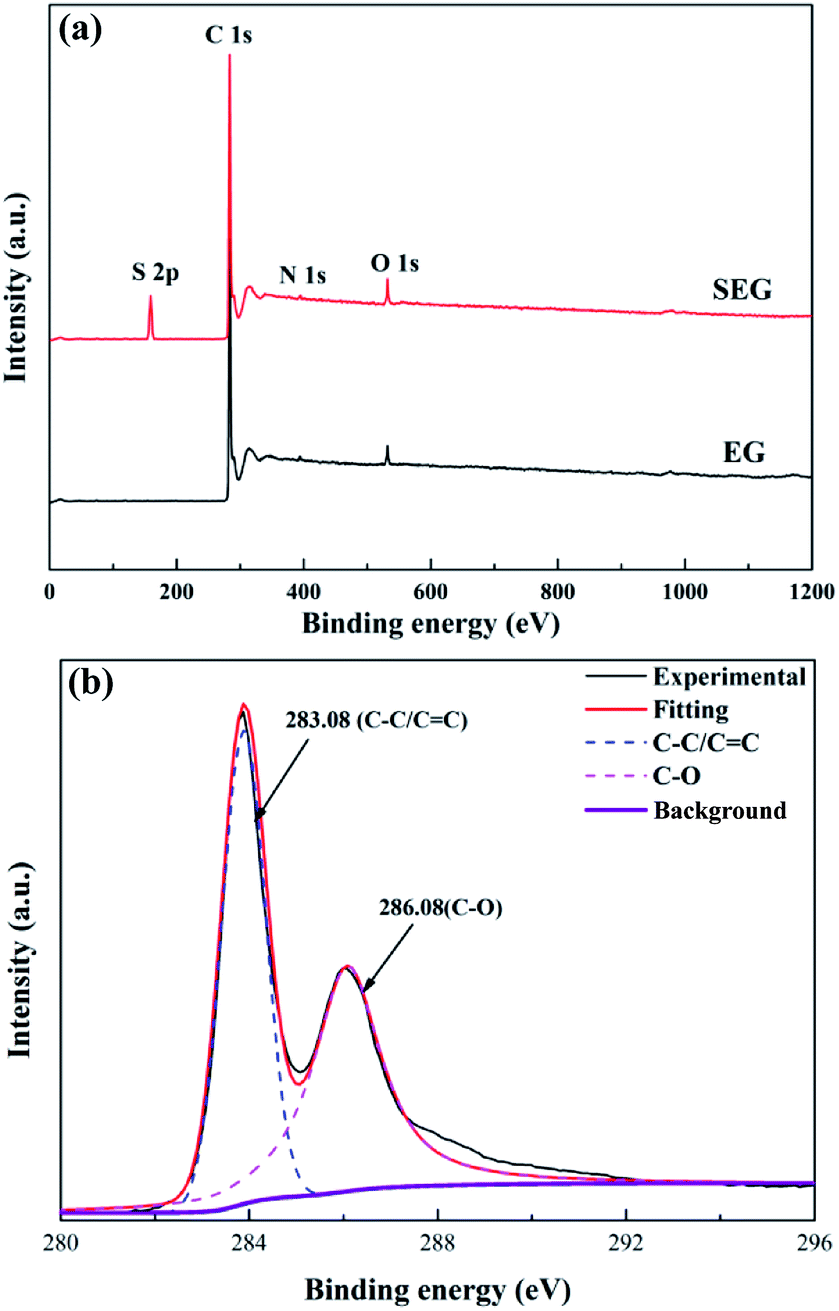
The XPS survey spectra of EG and SEG powder are presented in Fig. 5. Finding strong and dominant peaks centered at 283.08 eV of C 1s in the spectra of both EG and SEG indicated that the carbon element content is the greatest on the surface of them.34,35 Another peak, with a binding energy of 532.08 eV, belongs to O 1s and corresponds to C–O, whose content was second to that of C.36,37 In addition, a weak peak appeared at 398.7 eV due to the slight concentration of N on the surface.38 Differing from the peaks of C 1s, O 1s, and N 1s in EG, a new peak located at 159.08 eV appeared, which could refer to S 2p in SEG.39,40 Concurrently, the results also made it clear that the surface sulfur and oxygen element content definitely increased. The XPS spectra of C 1s could be attributed to C–C as well as C–O on the surface,41 and the S 2p spectrum could result from C–O–S or S–O groups surficially,39 which is consistent with the consequence of the FTIR spectra. In addition, the C 1s XPS spectrum of SEG (Fig. 5(b)) could be deconvoluted into two peaks attributed to C–C/CC in the aromatic rings as well as C–O. This demonstrated that the combination of SO3-Py and EG was attributed to the banding of S atoms belonging to SO3-Py and C atoms at the surface of EG through the anchor function of O atoms imported by high energy and heat during the process of mechanochemical modification.
 |
| | Fig. 5 Wide-scan XPS spectrum (a) and C 1s XPS spectrum (b) of SEG. | |
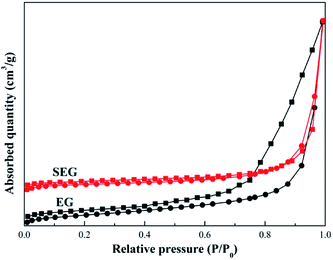
Fig. 6 indicates N2 adsorption–desorption isotherms of EG and SEG. Based on the Brunauer–Deming–Deming–Teller (BDDT) classification, the samples followed a type IV adsorption isotherm, consistent with graphitic materials.42 And at a high relative pressure (0.8–1.0), capillary condensation of N2 occurred, resulting in non-overlap on both adsorption and desorption curves. The structures of EG and SEG belonged to typically parallel walls with slit-type pores according to hysteresis on the curves.43 As obtained from the results, the specific surface area was 51.43 m2 g−1 for SEG, much greater than that of EG, whose surface area was just 37.68 m2 g−1, similar to the results of porous modified expanded graphite materials.44 The process of mechanochemical modification, in other words, was a process of steel balls striking solid materials. First, the ball milling process caused repeated fracture of EG, with a sustaining impact force in the planetary mill. This was followed by crashing; plentiful fresh surfaces were exposed, and more pores and channels could come into being inside the product, resulting in diminished particle size. Particle size distribution of SEG is presented in Fig. 7, showing a consequent increase in surface area, as well as pore volume and diameter,45,46 which also can be found in Table 2. In addition, for the modification process controlled in an appropriate time period, the phenomenon of agglomeration could be avoided; thus, fracturing of the solid would be produced continuously. In addition, the specific surface area increased and acquired more regions for sulfonated sites, which could lead to high efficiency and capacity of Pb(II) absorbed on SEG.
 |
| | Fig. 6 Nitrogen adsorption–desorption isotherm of EG and SEG. | |
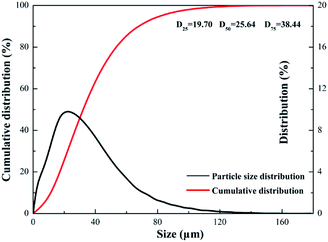 |
| | Fig. 7 Particle size distribution of SEG. | |
Table 2 Pore characteristics of EG and SEG
| |
Surface area (m2 g−1) |
Average pore volume (cm3 g−1) |
Average pore diameter (nm) |
| EG |
37.68 |
0.105 |
16.25 |
| SEG |
51.43 |
0.121 |
18.76 |
Adsorption study
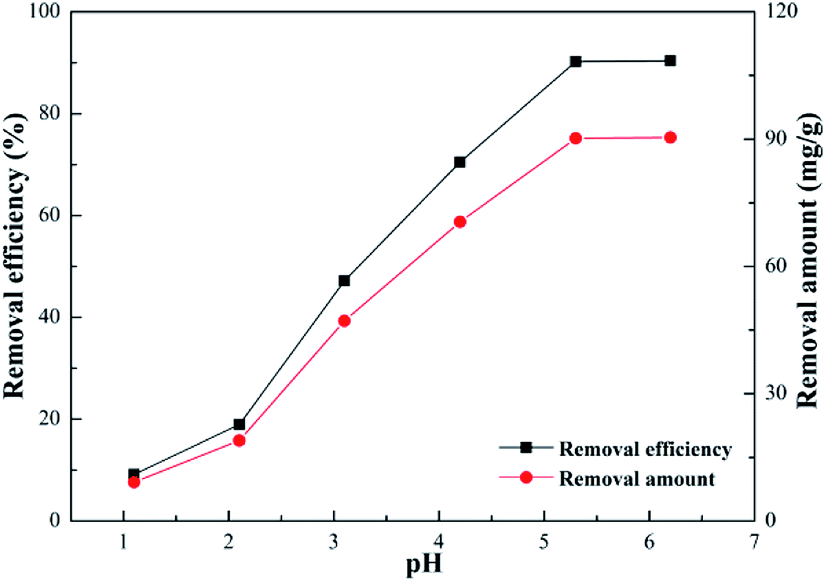
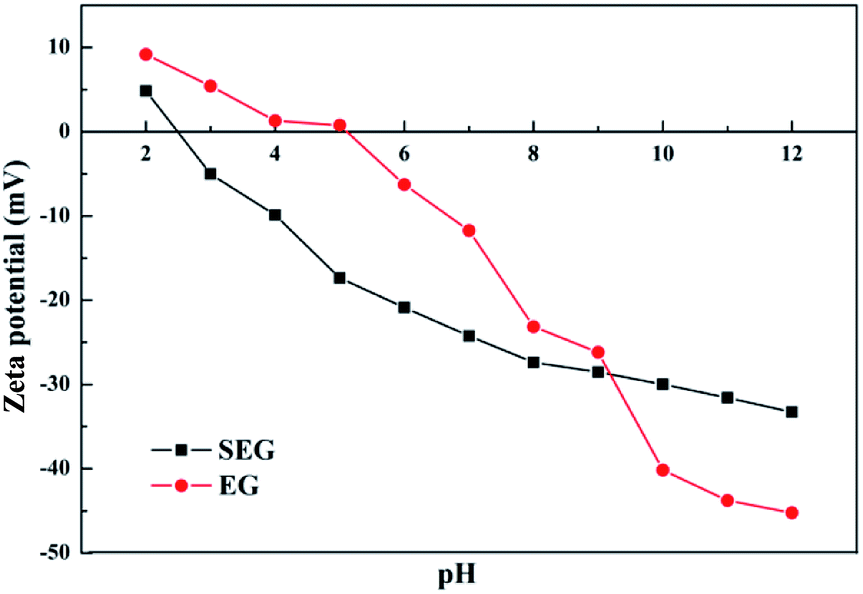
Effect of pH. The pH of a solution made a significant difference on the surface properties of the adsorbed heavy metal ions.47 The effect of pH on the removal efficiency of Pb(II) is illustrated in Fig. 8. When the pH increased the removal efficiency and amount both increased. The extremely low efficiency in acidic medium, where pH value was less than 3, is attributed to the fact that the surface of SEG possessed a positive charge, which can be noted in Fig. 9. The lower the pH, the higher the hydrogen ion concentration of the solution, which intensively competes with lead ions for the adsorption sites thus resulting in depressed adsorption capacity. In addition, the availability of –SO3 of SEG is reduced with a condition of low pH because of a right shift in the equilibrium equation.| | |
EG–SO3− + H+ → EG–SO3H
| (5) |
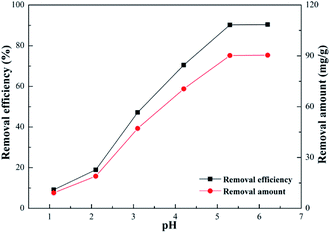 |
| | Fig. 8 Effect of pH on adsorption (Pb2+ concentration, 20 mg L−1; volume of Pb2+, 100 mL; SEG dose, 0.02 g; contact time, 30 min; temperature, 30 °C). | |
 |
| | Fig. 9 Zeta potentials. | |
As can be seen, the competitiveness of hydrogen ions with lead ions for adsorption sites would become weaker and weaker at higher pH levels. And when the pH was 5 to 6, the adsorption performance of Pb(II) was significantly improved with removal efficiency, reaching approximately 95%. Hence, the optimal pH for adsorption should be established at 5.59, which was the original pH value of the solution.
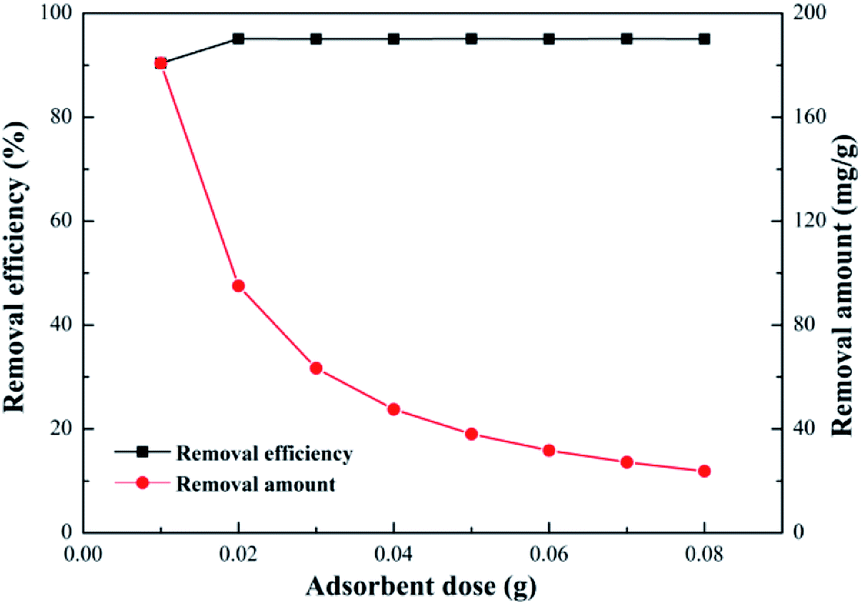
Effect of adsorbent dosage. Effect of SEG dosage on adsorption of Pb(II) was investigated in a range from 0.01 g to 0.08 g. It was known that the amount of adsorption sites per unit mass of SEG should remain constant, without relation to the total adsorbent mass; however, enhancement of adsorbent dosage in a settled volume could reduce available sites attributed to the decrease of the effective surface area.48 From Fig. 10, it was obvious that the removal efficiency increased with the augment of adsorbent loading, and plenty of adsorbent in the process would guarantee sufficient adsorption capacity to remove Pb(II) as much as possible. In addition, Pb(II) could be removed with an efficiency of approximately 95% even at a dosage as low as 0.02 g, which is attributed to the strong interaction between SEG and lead ions. With an increase of adsorbent amount, there was no further enhancement of Pb(II) adsorption, reaching a gradually diminished adsorption capacity less than 90 mg g−1. Meanwhile, removal efficiency maintained steady due to adsorption equilibration on Pb(II) at the initial concentration of 20 mg L−1.
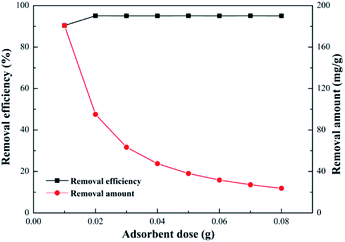 |
| | Fig. 10 Effect of adsorbent dose (Pb2+ concentration, 20 mg L−1; volume of Pb2+, 100 mL; pH of solution, 5.59; contact time, 30 min; temperature, 30 °C). | |
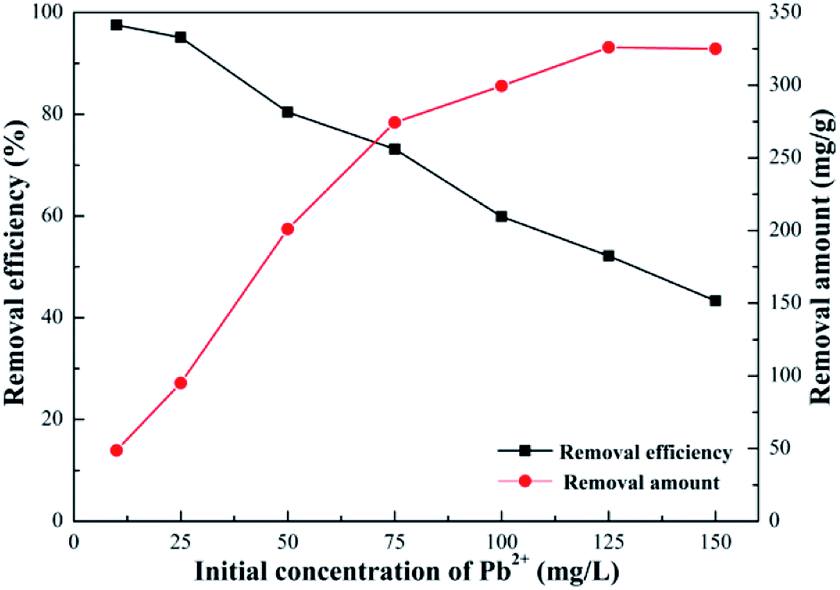
Effect of initial concentration. Effects of the initial concentration on adsorption of Pb(II) was investigated by changing it in a range between 10 and 150 mg L−1. What can be learned from Fig. 11 was that removal efficiency progressively decreased from around 95% to 43%, when the initial concentration of Pb(II) gradually increased. On the contrary, increasing initial concentration of Pb(II) could lead to augmenting the amount of adsorbed Pb(II). In general, high concentrations of reactants could result in a positive shift to the direction for products; thus, higher initial concentrations of Pb(II) promoted improved adsorption capacity. However, when Pb(II) concentration was greater than 125 mg L−1, the removal amount no longer changed, and the growth trend gradually slowed down, exhibiting the highest adsorption capacity of 325.12 mg g−1.
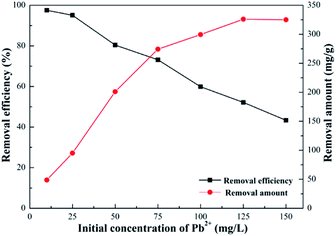 |
| | Fig. 11 Effect of initial concentrate of Pb2+ (volume of Pb2+, 100 mL; SEG dose, 0.02 g; pH of solution, 5.59; contact time, 30 min; temperature, 30 °C). | |
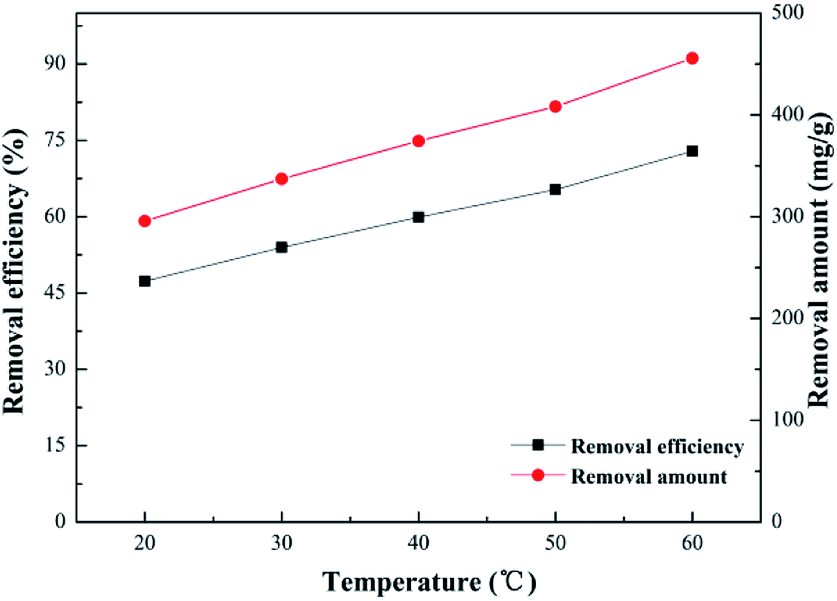
Effect of temperature. Effects of temperature on adsorption of Pb(II) was investigated by varying it from 20 to 60 °C. As shown in Fig. 12, with an increase of temperature, the removal efficiency increased by degrees, implying that the adsorption of Pb(II) was a spontaneous process of decalescence. And in the process of heating up, removal efficiency increased from 43.3% to almost 72.8%, with the highest adsorption capacity more than 450 mg g−1, indicating that increasing temperature might lead to an increase in available adsorption sites on the surface of SEG. In addition, the movement of molecules and ions contributing to the diffusion rate would be faster at higher temperatures, meaning that the adsorption equilibrium could be reached in a relatively short time. Nearly 325.12 mg g−1 of removal capacity was obtained even at an indoor ambient temperature of 30 °C.
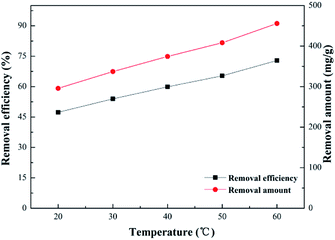 |
| | Fig. 12 Effect of temperature (Pb2+ concentration, 125 mg L−1; volume of Pb2+, 100 mL; SEG dose, 0.02 g; pH of solution, 5.59; contact time, 30 min). | |
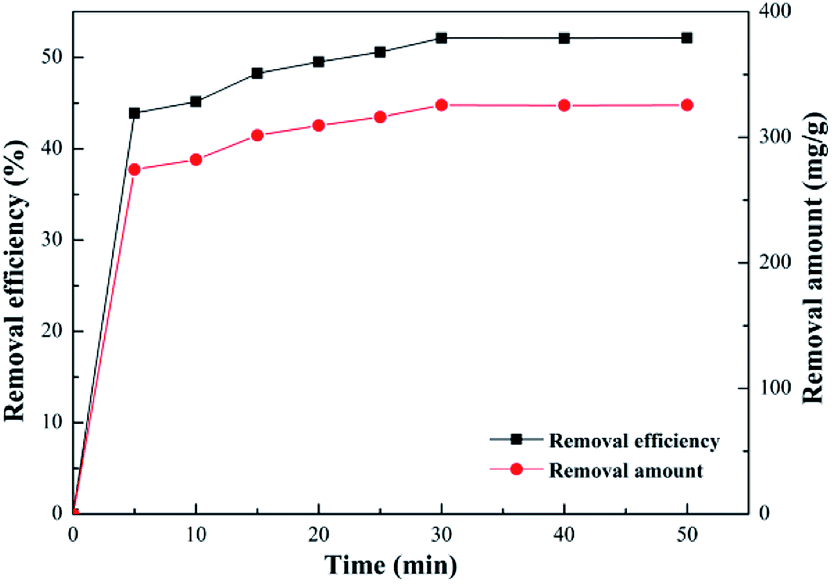
Effect of contact time. Effects of contact time on adsorption of Pb(II), which plays an important role in a cost-efficient adsorption system and is a vital parameter for adsorption capacity, was investigated by varying it in a range from 5 to 30 minutes. Fig. 13 illustrates that the removal efficiency of Pb(II) increased sharply at the beginning, and as the contact time increased, the trend became slower until it reached the condition of maximum equilibrium. Notably, the removal efficiency surged to approximately 43% in the first 15 minutes; nevertheless, it increased slowly with additional time, and achieved maximum capacity of 325 mg g−1 in 30 minutes. This result was ascribed to the available adsorption sites on the surface were sufficient initially, but the remaining adsorption sites decreased with time, and finally reached saturation capacity. In addition, a shorter contact time to achieve maximum removal efficiency than with many other reported adsorbent materials could be obtained because of graphite's properties.49
 |
| | Fig. 13 Effect of contact time (Pb2+ concentration, 125 mg L−1; volume of Pb2+, 100 mL; SEG dose, 0.02 g; pH of solution, 5.59; temperature, 30 °C). | |
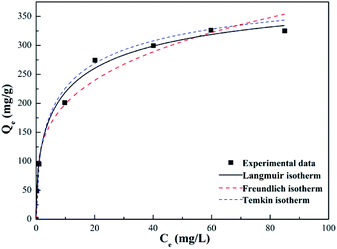
Adsorption isotherm
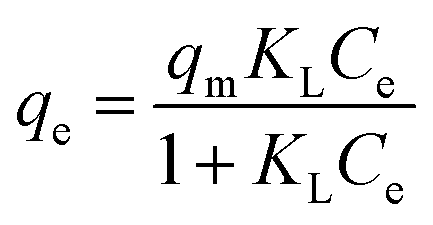
The Langmuir (eqn (6)),50–52 Freundlich (eqn (7))53,54 and Temkin isotherms (eqn (8))55,56 were applied to evaluate the equilibrium of the data.| |
 | (6) |
| |
qe = A + B![[thin space (1/6-em)]](https://www.rsc.org/images/entities/char_2009.gif) lnCe lnCe
| (8) |
where Ce is the equilibrium concentration of Pb(II) in solution (mg L−1), qe is the amount of Pb(II) adsorbed on the SEG (mg g−1), qm is the maximum amount of Pb(II) adsorbed per unit weight of SEG, and KL (L mol−1) represents the enthalpy of adsorption. KF (mol1−n Ln g−1) and nF are the Freundlich constants related to adsorption capacity and intensity, respectively. A (mg g−1) and B (J mol−1) are the Temkin constants.
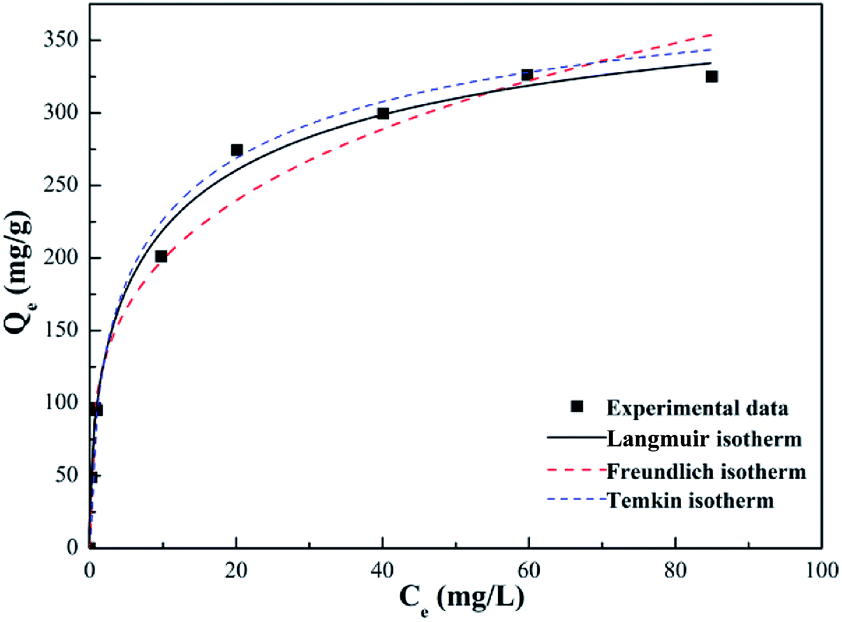
From Fig. 14 and Table 3, it was obvious that the Freundlich and Temkin models were not fit to describe the adsorption experiments due to the low R2 coefficients determined for them. On the contrary, the highest regression correlation of R2 = 0.996 reflected that the adsorption experimental data of Pb(II) absorbed on SEG was primarily suitable for the Langmuir model. Therefore, the maximum adsorption capacity (qm) of Pb(II) on SEG was calculated by using the Langmuir equation, which was approximately 333.33 mg g−1. Note the experimental result was 325.12 mg g−1, with only a 2.4% difference between the theoretical calculation and experimental value, indicating that they were in superb agreement considering system errors. These findings indicated that the adsorption process took place on a single layer, not a heterogeneous surface of SEG. In addition, the efficient adsorption could be closely linked to the presence of sulfonated functional groups on the surface.
 |
| | Fig. 14 Models of the Langmuir, Freundlich and Temkin isotherms for Pb(II) adsorption on SEG. | |
Table 3 Langmuir, Freundlich, and Temkin isotherm model constants and regression correlation coefficientsa
| Langmuir |
Freundlich |
Temkin |
| qe (mg g−1) |
KL (L mol−1) |
R2 |
KF (mol1−n Ln g−1) |
nF |
R2 |
A |
B |
R2 |
| The constants of the models were calculated from the slopes and intercepts of linear fitting of Ce, lnCe and lnCe versus Ce/qe, lnqe and qe, respectively, related to Langmuir, Freundlich, and Temkin equations. The regressions were obtained from the correlation coefficients of fitting equations calculated by the ratio of regression sum of squares occupied by the total. |
| 333.33 |
0.27 |
0.996 |
87.88 |
3.04 |
0.876 |
107.49 |
50.76 |
0.954 |
Adsorption kinetics
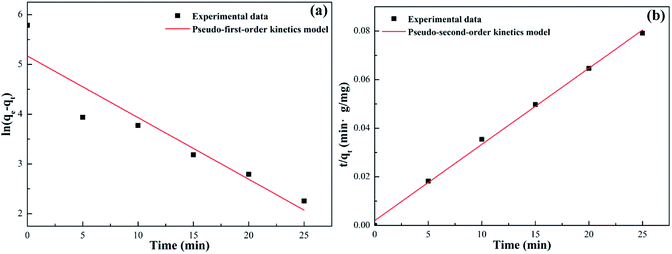
To investigate the effect of contact time and obtain the resulting kinetic parameters, adsorption kinetic experiments of Pb(II) on SEG were carried out. The kinetic parameters of Pb(II) adsorption on SEG were evaluated using pseudo-first-order (eqn (9)) and pseudo-second-order (eqn (10)) kinetic models.57,58 The kinetic models for describing the adsorption behavior are presented as follows:| | |
ln(qe − qt) = lnqe − k1 × t
| (9) |
| |
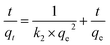 | (10) |
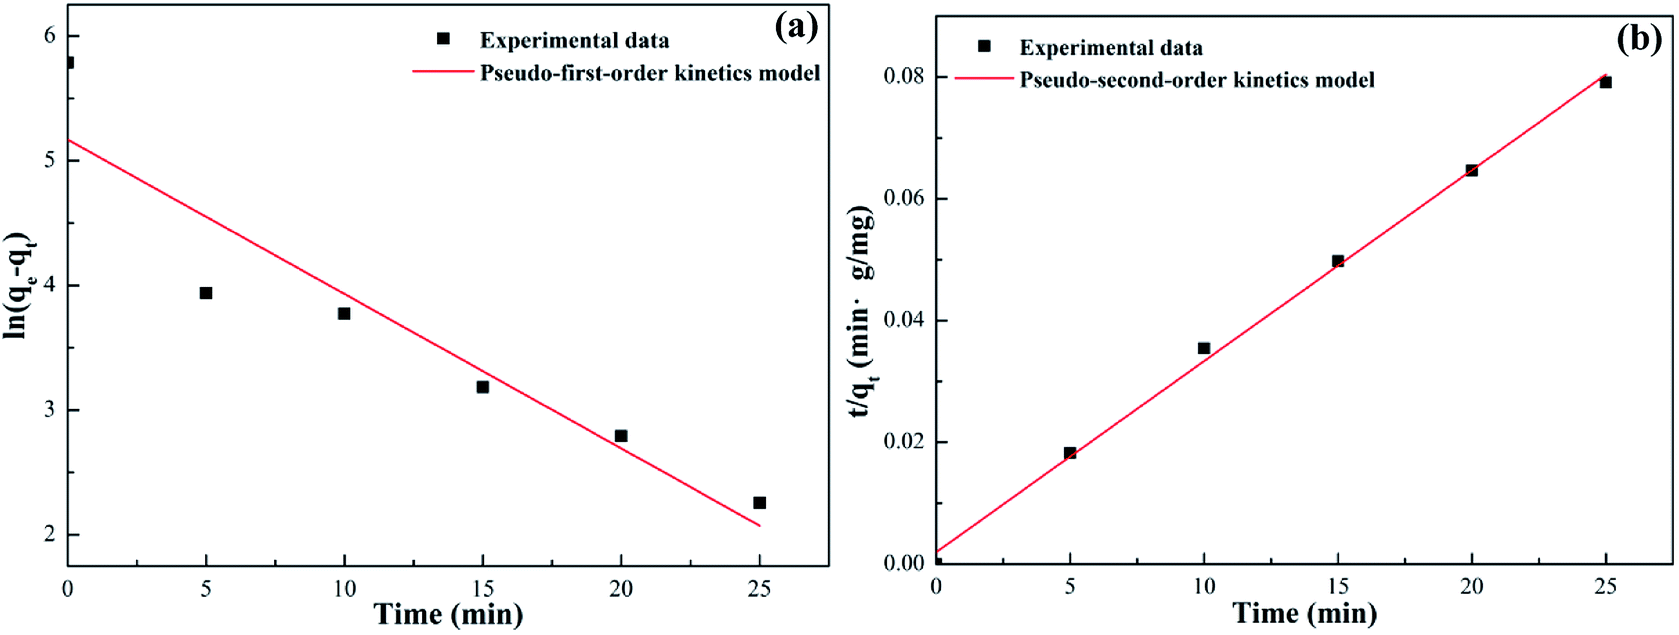
where k1 and k2 are the pseudo-first-order and pseudo-second-order rate constants, respectively, and qt and qe are the adsorption capacity of Pb(II) on SEG at a random and equilibrium time, respectively (Fig. 15).
 |
| | Fig. 15 Pseudo-first-order (a) and pseudo-second-order (b) adsorption kinetics models for Pb(II) adsorption on SEG. | |
Table 4 illustrates all the kinetic parameters obtained by linear fitting using the pseudo-first-order and pseudo-second-order models. The R2 correlation coefficients of the pseudo-first-order model was 0.882, implying that the pseudo-first-order model is not fit for the experimental kinetics data. However, the R2 coefficient of the pseudo-second-order model was greater than 0.99, indicating that the adsorption experiments could be well-described by the pseudo-second-order kinetic model. And based on that model, the calculated value of the equilibrium capacity was 328.95 mg g−1, in good accordance with the experimentally measured capacity of 325.12 mg g−1.
Table 4 Pseudo-first-order and pseudo-second-order kinetic parameters for Pb(II) adsorption on SEG
| qe(exp) (mg g−1) |
Pseudo 1st kinetics model |
Pseudo 2nd kinetics model |
| k1 (min−1) |
qe (mg g−1) |
R2 |
k2 (min−1) |
qe (mg g−1) |
R2 |
| 325.12 |
0.123 |
175.74 |
0.882 |
0.0045 |
328.95 |
0.999 |
Adsorption thermodynamics
To estimate the influence of temperature on adsorption, three basic thermodynamic parameters, enthalpy (ΔH0), entropy (ΔS0), and Gibbs free energy (ΔG0), were calculated using the following equations,59,60| |
 | (11) |
| |
 | (12) |
| | |
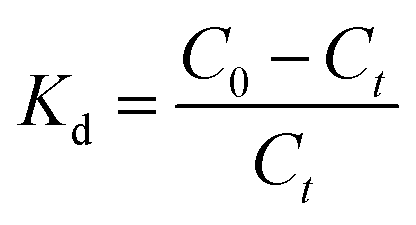
ΔG0 = −RTlnKd
| (13) |
where Kd is the adsorption equilibrium constant, T (K) is the temperature of the solution, and R is the ideal gas constant (8.314 J mol−1 K−1).
Table 5 lists the thermodynamic parameters of the adsorption experiments. From results of the thermodynamic parameters, the positive values of ΔH0 indicated that the adsorption process was endothermic, requiring an input of energy to combine Pb(II) with the sulfonated groups on the surface of SEG. Moreover, the value of ΔH0 was greater than 40 kJ mol−1, implying that the adsorption was a process of physisorption accompanied by chemisorptions.61 Also, the adsorption process is spontaneous due to the negative values of ΔG0 at different experimental temperatures. As for ΔS0, the positive value reflected an increase in randomness during the process of Pb(II) adsorption on SEG at the solid–liquid interface, suggesting a firm affinity existed between Pb(II) and the adsorbents.
Table 5 Thermodynamic parameters for Pb(II) adsorption on SEGa
| T/K |
ΔG0 (kJ mol−1) |
ΔH0 (kJ mol−1) |
ΔS0 (J mol−1 K−1) |
| Enthalpy and entropy were calculated from the slope and intercept of the Van't Hoff equation of ln(C0 − Ct)/Ct versus 1/T. The value of Gibbs free energy was calculated using eqn (13). |
| 293.15 |
−4.99 |
44.09 |
168.44 |
| 303.15 |
−7.46 |
| 313.15 |
−8.68 |
| 323.15 |
−10.16 |
| 333.15 |
−12.04 |
Desorption and regeneration
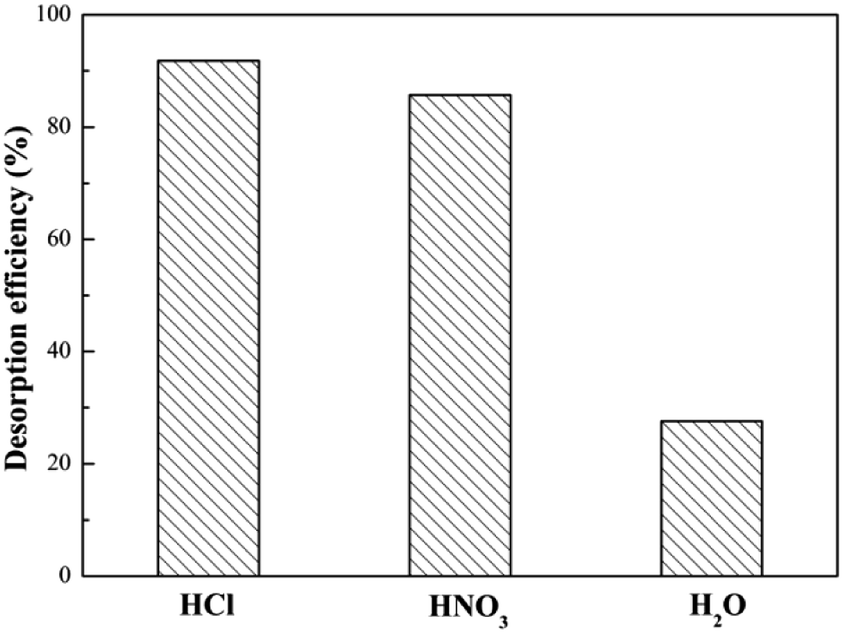
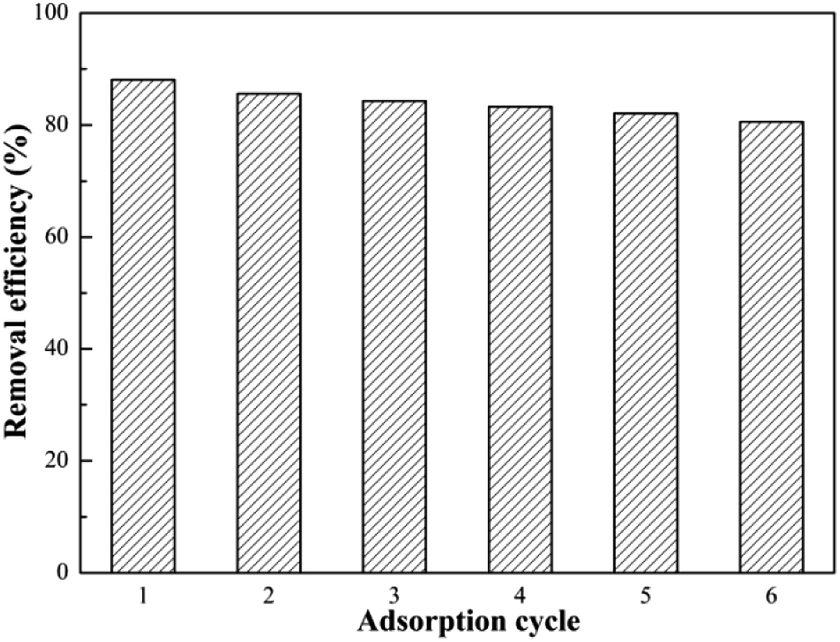
For an excellent adsorbent, high adsorption capability is one of the most significant parameter, but beyond that reusability is a vital factor to reduce overall costs for potential commercial applications. Thus, desorption of SEG is necessary for regeneration and to restore adsorption capacity. As mentioned in eqn (5), it could be effective for Pb(II) ions to be released from SEG by adding dilute acid. Therefore, a desorption experiment with Pb(II) was investigated using 0.1 M HCl, 0.1 M HNO3, and H2O for blank control as eluents. As shown in Fig. 17, the desorption efficiencies of Pb(II) released from spent SEG were 90.8%, 85.7%, and 27.6% using 0.1 M HCl, 0.1 M HNO3, and H2O, respectively. Both HCl and HNO3 solutions showed effective elution capabilities. Removal efficiency of Pb(II) on regenerated SEG reached 88.6% with the initial re-adsorption. Additionally, Fig. 18 shows that the removal efficiency for Pb(II) on SEG decreased only 9% after 6 cycles of adsorption–desorption, manifesting superior regeneration and recycle performance that would be important for extensive industrial applications.
 |
| | Fig. 16 Schematic diagram of SEG interacted with Pb(II). | |
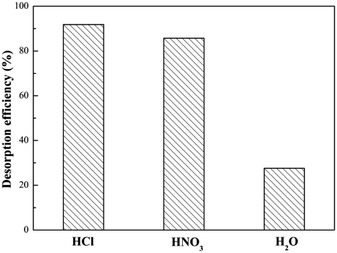 |
| | Fig. 17 Effect of eluent on the desorption efficiency of SEG (Pb2+ concentration 20 mg L−1; volume of eluent, 100 mL; Pb(II) loaded SEG dose, 0.02 g). | |
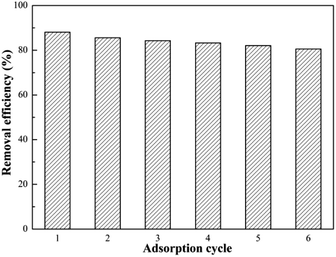 |
| | Fig. 18 Adsorption–desorption cycles of Pb(II) on SEG (Pb2+ concentration 20 mg L−1; eluent 100 mL of 0.1 M HCl). | |
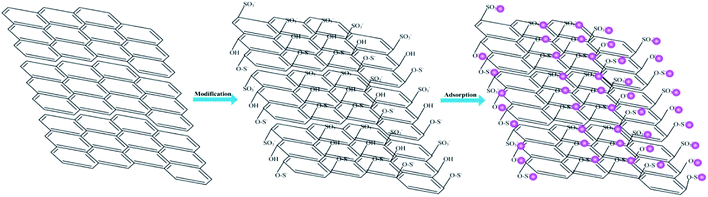
Adsorption mechanism
Fig. 4 shows the FT-IR spectrum of Pb(II)-loaded SEG. After adsorption, the dominant and broad peak shifted from 3448.36 cm−1 to 3435.29 cm−1, which might result from the complexation of Pb(II) with ionized –OH groups of “free” hydroxyl groups.62 And the apparent and sharp peaks located at 1235 and 1070.12 cm−1 shifted to 1219 and 1049 cm−1, respectively, which could be due to the combination of Pb(II) with S–O groups on the surface of SEG. In addition, the intensity of the peak at 729.10 cm−1 distinctly decreased, with a slight shift to 725.15 cm−1, which could be attributed to complexation between Pb(II) and C–O–S belonging to C–O–SO3 groups.33 According to analysis of FT-IR data, the schematic diagram of SEG interacted with Pb(II) as shown in Fig. 16, and the reactions on the surface of SEG could be presented as follows:| | |
EG–OH + Pb2+ → EG–OPb + H+
| (14) |
| | |
EG–O–S− + Pb2+ → EG–O–SPb+
| (15) |
| | |
EG–SO3− + Pb2+ → EG–SO3Pb+
| (16) |
Conclusion
Experimental results show that a novel promising absorbent with adsorption capacity of Pb(II) on SEG reaching 325.12 mg g−1 was successfully synthesized by a mechanochemical method.
The equilibrium data of Pb(II) adsorbed on SEG were compatible with Langmuir isotherms, and the adsorption process followed pseudo-second-order kinetics. Moreover, thermodynamic parameters indicated that the adsorption of Pb(II) onto SEG is an endothermic and spontaneous process that relies on physisorption accompanied by chemisorption. In addition, SEG was easily desorbed and repeatedly used as an efficient adsorbent.
The sulfonated functional groups located at the surface of SEG mainly participated in the complexation of Pb(II). This enhanced adsorption and removed Pb(II) from aqueous solution with high efficiency. Additionally, Pb(II) could combine with the hydroxyl groups at the edges of SEG as well.
Acknowledgements
The financial support for this work provided by the Fundamental Research Funds for the Central Universities (WUT: 2017zy073) is gratefully acknowledged.
References
- A. Stafiej and K. Pyrzynska, Sep. Purif. Technol., 2007, 58, 49–52 CrossRef CAS.
- A. S. Singha and A. Guleria, Int. J. Biol. Macromol., 2014, 67, 409–417 CrossRef CAS PubMed.
- S. Luo, X.-L. Xu, G.-Y. Zhou, C.-B. Liu, Y.-H. Tang and Y.-T. Liu, J. Hazard. Mater., 2014, 274, 145–155 CrossRef CAS PubMed.
- N. M. Mubarak, J. N. Sahu, E. C. Abdullah and N. S. Jayakumar, J. Environ. Sci., 2016, 45, 143–155 CrossRef PubMed.
- M. Machida, T. Mochimaru and H. Tatsumoto, Carbon, 2006, 44, 2681–2688 CrossRef CAS.
- Z.-H. Huang, X.-Y. Zheng, W. Lv, M. Wang, Q.-H. Yang and F.-Y. Kang, Langmuir, 2011, 27, 7558–7562 CrossRef CAS PubMed.
- U. Farooq, J. A. Kozinski, M. A. Khan and M. Athar, Bioresour. Technol., 2010, 101, 5043–5053 CrossRef CAS PubMed.
- K. Hąc-Wydro, I. Pałasińska and P. Miśkowiec, J. Mol. Liq., 2016, 219, 1071–1077 CrossRef.
- F.-L. Fu and Q. Wang, J. Environ. Manage., 2011, 92, 407–418 CrossRef CAS PubMed.
- M. Ghaedi, A. Shokrollahi, K. Niknam, E. Niknam, A. Najibi and M. Soylak, J. Hazard. Mater., 2009, 168, 1022–1027 CrossRef CAS PubMed.
- M. Soylak, Y. E. Unsal, N. Kizil and A. Aydin, Food Chem. Toxicol., 2010, 48, 517–521 CrossRef CAS PubMed.
- K. Cederkvist, P. E. Holm and M. B. Jensen, Water Environ. Res., 2010, 82, 401–408 CrossRef CAS PubMed.
- S. P. Singh and P. Bose, RSC Adv., 2017, 7, 27668–27677 RSC.
- Y.-F. Yang, Y.-L. Xie, L.-C. Pang, M. Li, X.-H. Song, J.-G. Wen and H.-Y. Zhao, Langmuir, 2013, 29, 10727–10736 CrossRef CAS PubMed.
- Y. Liu, L. Xu, J.-S. Liu, X.-Y. Liu, C.-H. Chen, G.-Y. Li and Y.-F. Meng, Chem. Eng. J., 2016, 285, 698–708 CrossRef CAS.
- T. Trevethan and M. I. Heggie, Comput. Mater. Sci., 2016, 113, 60–65 CrossRef CAS.
- A. Celzard, J. F. Mareche and G. Furdin, Carbon, 2002, 40, 2713–2718 CrossRef CAS.
- F.-Y. Kang, Y.-P. Zheng, H.-N. Wang, Y. Nishi and M. InagakI, Carbon, 2002, 40, 1575–1581 CrossRef CAS.
- X.-J. Yu, Y.-H. Zhang and X.-W. Cheng, Electrochim. Acta, 2014, 137, 668–675 CrossRef CAS.
- J.-H. Li, L.-L. Feng and Z.-X. Jia, Mater. Lett., 2006, 60, 746–749 CrossRef CAS.
- J.-H. Li, Q. Liu and H.-F. Da, Mater. Lett., 2007, 61, 1832–1834 CrossRef CAS.
- H.-Y. Jin, J. Yuan, H.-Y. Hao, Z.-J. Ji, M. Liu and S. Hou, Mater. Lett., 2013, 110, 69–72 CrossRef CAS.
- M.-F. Zhao and P. Liu, Desalination, 2009, 249, 31–336 Search PubMed.
- X. Chuan, D. Chen and X. Zhou, Carbon, 1997, 135, 311–313 CrossRef.
- K. Fukud, K. Kikuy, K. lsono and M. Yoshio, J. Power Sources, 1997, 69, 165–168 CrossRef.
- L.-H. Zou, B.-Y. Huang, Y. Huang, Q.-Z. Huang and C.-A. Wang, Mater. Chem. Phys., 2003, 82, 654–662 CrossRef CAS.
- S. Lim, S.-H. Yoon, I. Mochida and J.-H. Chi, J. Phys. Chem. B, 2004, 108, 1533–1536 CrossRef CAS.
- J.-L. Liu, J.-Q. Gao, J.-K. Cheng, J.-F. Yang and G.-J. Qiao, Diamond Relat. Mater., 2006, 15, 117–120 CrossRef CAS.
- J.-F. Shen, T. Li, Y. Long, M. Shi, N. Li and M.-X. Ye, Carbon, 2012, 50, 2134–2140 CrossRef CAS.
- W.-F. Chen, L.-F. Yan and P.-R. Bangal, Carbon, 2010, 48, 1146–1152 CrossRef CAS.
- C. Nethravathi and M. Rajamathi, Carbon, 2008, 46, 1994–1998 CrossRef CAS.
- Y.-X. Xu, H. Bai, G.-W. Lu, C. Li and G.-Q. Shi, J. Am. Chem. Soc., 2008, 130, 5856–5857 CrossRef CAS PubMed.
- C.-H. Dong, F.-L. Zhang, Z.-Q. Pang and G.-H. Yang, Carbohydr. Polym., 2016, 151, 230–236 CrossRef CAS PubMed.
- J.-X. Jin, H.-M. Gao, Z.-J. Ren and Z.-J. Chen, Minerals, 2016, 99, 123–132 CrossRef CAS.
- S. Yumitori, J. Mater. Sci., 2000, 35, 139–146 CrossRef CAS.
- A. Naveau, F. Monteil-Rivera, E. Guillon and J. Dumonceau, J. Colloid Interface Sci., 2006, 303, 25–31 CrossRef CAS PubMed.
- Y. Mikhlina, A. Karacharova, Y. Tomashevicha and A. Shchukarev, J. Electron Spectrosc. Relat. Phenom., 2016, 206, 65–73 CrossRef.
- R. Pietrzak, T. Grzybek and H. Wachowska, Fuel, 2007, 86, 2616–2624 CrossRef CAS.
- Y.-F. Cai, Y.-G. Pan, J.-Y. Xue, Q.-F. Sun, G.-Z. Su and X. Li, Appl. Surf. Sci., 2009, 255, 8750–8760 CrossRef CAS.
- G. U. von Oertzena, W. M. Skinnera and H. W. Nesbitt, Radiat. Phys. Chem., 2006, 75, 1855–1860 CrossRef.
- W.-P. Peng, H.-Q. Li, Y.-Y. Liu and S.-X. Song, J. Mol. Liq., 2016, 221, 82–87 CrossRef CAS.
- L.-N. Zhou, Z.-B. Yang, J. Yang, Y.-G. Wu and D.-S. Wei, Chem. Phys. Lett., 2017, 677, 7–12 CrossRef CAS.
- J.-M. Fang, J.-D. Xu, J.-H. Chen, X.-Y. Huang and X. Wang, Colloids Surf., A, 2016, 508, 124–134 CrossRef CAS.
- X. Wang, X.-J. Wang, J.-F. Zhao, J.-K. Song, L.-J. Zhou, J.-Y. Wang, X. Tong and Y.-S. Chen, Appl. Catal., B, 2017, 206, 479–489 CrossRef CAS.
- Y. H. Taufiq-Yap, C. K. Goh, G. J. Hutchings, N. Dummer and J. K. Bartley, J. Mol. Catal. A: Chem., 2006, 260, 24–31 CrossRef CAS.
- S. Wennie, W. Y. Ta and C. Siang-Piao, J. Alloys Compd., 2017, 695, 496–507 CrossRef.
- X.-T. Sun, L.-R. Yang, Q. Li, J.-M. Zhao, X.-P. Li, X.-Q. Wang and H.-Z. Liu, Chem. Eng. J., 2014, 241, 175–183 CrossRef CAS.
- W.-P. Peng, H.-Q. Li, Y.-Y. Liu and S.-X. Song, J. Mol. Liq., 2017, 230, 496–504 CrossRef CAS.
- T. Yao, Y.-G. Zhang, Y.-P. Xiao, P.-C. Zhao, L. Guo, H.-W. Yang and F.-B. Li, J. Mol. Liq., 2016, 218, 611–614 CrossRef CAS.
- B. H. Hameed, A. T. M. Din and A. L. Ahmad, J. Hazard. Mater., 2007, 141, 819–825 CrossRef CAS PubMed.
- K. Y. Foo and B. H. Hameed, Chem. Eng. J., 2010, 156, 2–10 CrossRef CAS.
- M. S. Atas, S. Dursun, H. Akyildiz, M. Citir, C. T. Yavuz and M. S. Yavuz, RSC Adv., 2017, 7, 25969–25977 RSC; V. K. Gupta, S. Agarwal, A. K. Bharti and H. Sadegh, J. Mol. Liq., 2017, 230, 667–673 CrossRef CAS.
- R. K. Singh, S. Kumar, S. Kumar and A. Kumar, J. Hazard. Mater., 2008, 155, 523–535 CrossRef CAS PubMed.
- Y.-H. Li, Z.-C. Di, J. Ding, D.-H. Wu, Z.-K. Luan and Y.-Q. Zhu, Water Res., 2005, 39, 605–609 CrossRef CAS PubMed.
- Y.-M. Ren, N. Yan, J. Feng, J. Ma, Q. Wen, N. Li and Q. Dong, Mater. Chem. Phys., 2012, 136, 538–544 CrossRef CAS.
- X.-M. Gao, Y. Dai, Y. Zhang and F. Fu, J. Phys. Chem. Solids, 2017, 102, 142–150 CrossRef CAS.
- Y. Liu, X.-T. Li, D.-D. Huang, Y.-F. Liu, H. Wang and D.-L. Di, Colloids Surf., A, 2017, 520, 166–172 CrossRef CAS.
- H. Wang, X.-Z. Yuan, Y. Wu, H.-J. Huang, G.-M. Zeng, Y. Liu, X.-L. Wang, N.-B. Lin and Y. Qi, Appl. Surf. Sci., 2013, 279, 432–440 CrossRef CAS.
- W. Konicki, M. Aleksandrzak, D. Moszyn and E. Mijowska, J. Colloid Interface Sci., 2017, 496, 188–200 CrossRef CAS PubMed.
- S. O. Akpotu and B. Moodley, J. Environ. Chem. Eng., 2016, 4, 4503–4513 CrossRef CAS.
- E. Wibowo, M. Rokhmat, Sutisna, Khairurrijal and M. Abdullah, Desalination, 2017, 409, 146–156 CrossRef CAS.
- W.-J. Peng, H.-Q. Li, Y.-Y. Liu and S.-X. Song, Appl. Surf. Sci., 2016, 364, 620–627 CrossRef CAS.
|
| This journal is © The Royal Society of Chemistry 2017 |
Click here to see how this site uses Cookies. View our privacy policy here. 
 Open Access Article
 This Open Access Article is licensed under a Creative Commons Attribution-Non Commercial 3.0 Unported Licence
 ab,
Lingyan Zhang*ab,
Yangshuai Qiu*ab and
Yunru Yuanab
ab,
Lingyan Zhang*ab,
Yangshuai Qiu*ab and
Yunru Yuanab