 Open Access Article
Catalytic effect of MnFe2O4 on dehydrogenation kinetics of NaAlH4–MgH2
Yihui Huanga,
Ping Li *a,
Qi Wanb,
Zhiwei Liua,
Wan Zhaoa,
Jun Zhanga,
Zhili Pana,
Li Xuc and
Xuanhui Qua
aInstitute for Advanced Materials and Technology, University of Science and Technology Beijing, Beijing 100083, China. E-mail: ustbliping@126.com; Fax: +86 10 62334311; Tel: +86 10 62333981
bChengdu Institute of Organic Chemistry Chinese Academy of Sciences, Chengdu 610041, China
cState Key Laboratory of Advanced Transmission Technology, Global Energy Interconnection Research Institute, Beijing 102209, China
First published on 10th July 2017
Abstract
The hydrogen desorption properties and decomposition processes of MnFe2O4-doped NaAlH4–MgH2 composites are investigated. The onset temperatures of three dehydrogenation steps of MnFe2O4-doped NaAlH4–MgH2 composites are 92, 116 and 115 °C lower than those of as-milled NaAlH4–MgH2. Furthermore, NaAlH4–MgH2 + 3 mol% MnFe2O4 displays good cycling stability at 300 °C and only a slight capacity loss after four cycles. The apparent activation energies estimated from the Kissinger analysis for NaAlH4- and MgH2-relevant decomposition are found to be 51.29 and 105.34 kJ mol−1, respectively. XRD and XPS results show that NaFeO2, Mg2MnO4 and the amorphous Mn/MnOx species as well as iron oxides contribute to enhancing the dehydrogenation performance of NaAlH4–MgH2.
1. Introduction
Hydrogen has attracted global attention as an alternative energy carrier with the aim of reducing society's reliance on fossil fuels.1 Large gravimetric and volumetric capacities are important for on-board hydrogen storage systems of hydrogen-powered fuel cell vehicles.2 Therefore, the efficient storage of hydrogen is a key technical issue that requires improvement before its potential can be realized for mobile applications.It is widely recognized that a major scientific and technological barrier to the commercialization and market acceptance of hydrogen as an energy carrier is the lack of a cheap, safe, and easily produced hydrogen storage material with suitable hydrogen generation kinetics.3 To date, significant efforts have been directed toward the development of a solid-state hydrogen storage system based on coordination hydrides and related materials, which have been considered as promising storage media owing to their high hydrogen contents and the reversibility of hydrogen uptake.4,5
Mg-based material has a high hydrogen storage capacity and good reversibility, and therefore it is an ideal option for hydrogen storage due to its abundant resources and cheap cost. The theoretical hydrogen storage density of a pure MgH2 system is 7.6 wt%.6 Nevertheless, the high decomposition temperature (>400 °C) and slow desorption/absorption kinetics have hindered the utilization of MgH2 in practical onboard applications. To resolve the deficiencies of MgH2 in terms of hydrogen storage, the hydrogen absorption and desorption properties were improved by many methods, such as nano-crystallization,7,8 catalyst doping4,9,10 and reactive hydride composites (RHC).11,12 Among them, the RHC method was proposed to modify the reaction process by adding a reactive additive.13 An attractive hydride composite of NaAlH4–MgH2 has been developed to improve the performance of MgH2 due to the low hydrogen desorption temperature and excellent cyclability of NaAlH4.14 It has been proven that an NaAlH4–MgH2 composite system enhanced dehydrogenation performance compared with ball-milled pure NaAlH4 and MgH2 alone.15,16 However, the sluggish kinetics in the NaAlH4–MgH2 system are another problem that needs to be solved. Additives, such as TiH2,17 TiF3,18 and Nb2O5,19 are effective in reducing the operating temperature and speeding up the reaction rate for hydrogen storage in NaAlH4–MgH2. In addition, oxides have been commonly reported to be an effective method of improving the hydrogen storage behaviors of ball-milled pure MgH2 and NaAlH4 alone.10,20 More interestingly, further enhanced dehydrogenation kinetics of MgH2 and NaAlH4 have been achieved by using ferrite oxides.10,14,20–22 It is speculated that the intermediate compounds formed in situ play a vital role in the hydrogen desorption process. Therefore, it is reasonable to assume that ferrite oxide would show great potential as a catalyst to promote the hydrogen storage performances of the NaAlH4–MgH2 system.
Based on the above discussions, in this work, MnFe2O4 nanoparticles prepared by an auto-combustion process are used as a catalyst to study the effect on the hydrogen storage performance of NaAlH4–MgH2 by high-energy ball milling. The catalytic effect on the hydrogen storage properties of NaAlH4–MgH2 composite is revealed by means of transmission electron microscopy (TEM) investigation.
2. Experimental
All reagents and solvent were commercially available and used in the as-received state without further purification. The starting materials used in this study of Fe(NO3)3·9H2O (≥95% purity) and Mn(NO3)2 (≥99% purity) were purchased from Acros Organics. The MnFe2O4 catalyst was prepared by the nitrate–citrate auto-combustion method, where Fe(NO3)3·9H2O and Mn(NO3)2 were dissolved in deionized water and mixed uniformly before adding the chelating agent citric acid. The pH value of the solution was adjusted to 7 by adding NH3·H2O. Then, the solution was stirred by magnetic stirrer at 60 °C to form a sol–gel, which was dried at 120 °C in a vacuum drying chamber. MnFe2O4 nanoparticles were obtained after the dry gel ignited in air and a self-propagation reaction (exothermic) followed completely. NaAlH4 (≥95% purity) was bought from Alfa Aesar, and MgH2 (≥99.5% purity) was obtained from Sigma Aldrich. The NaAlH4–MgH2 composite was prepared by ball milling, a 1![[thin space (1/6-em)]](https://www.rsc.org/images/entities/char_2009.gif) :
:![[thin space (1/6-em)]](https://www.rsc.org/images/entities/char_2009.gif) 1 molar ratio of NaAlH4 and MgH2 was added to 3 mol% of MnFe2O4 for 1 h under a high-purity argon atmosphere using a QM-3B high-energy mill (Nanjing Nan Da Instrument Plant, China) at a rotation rate of 1200 rpm. A quantity of 3 g of each mixture was loaded into a stainless steel vessel with a ball-to-powder weight ratio of 20
1 molar ratio of NaAlH4 and MgH2 was added to 3 mol% of MnFe2O4 for 1 h under a high-purity argon atmosphere using a QM-3B high-energy mill (Nanjing Nan Da Instrument Plant, China) at a rotation rate of 1200 rpm. A quantity of 3 g of each mixture was loaded into a stainless steel vessel with a ball-to-powder weight ratio of 20![[thin space (1/6-em)]](https://www.rsc.org/images/entities/char_2009.gif) :
:![[thin space (1/6-em)]](https://www.rsc.org/images/entities/char_2009.gif) 1. The stainless steel balls had diameters of 4 and 8 mm (mass ratio of ball = 1
1. The stainless steel balls had diameters of 4 and 8 mm (mass ratio of ball = 1![[thin space (1/6-em)]](https://www.rsc.org/images/entities/char_2009.gif) :
:![[thin space (1/6-em)]](https://www.rsc.org/images/entities/char_2009.gif) 1). To avoid excess heating of the stainless steel vessel, there were 10 min intervals between each 6 min milling process. All samples were transferred and mixed by handling in a glove box (Mikrouna, Super-750) with high-purity argon equipped with a recirculation system (O2 < 0.1 ppm and H2O < 0.1 ppm).
1). To avoid excess heating of the stainless steel vessel, there were 10 min intervals between each 6 min milling process. All samples were transferred and mixed by handling in a glove box (Mikrouna, Super-750) with high-purity argon equipped with a recirculation system (O2 < 0.1 ppm and H2O < 0.1 ppm).
The dehydrogenation experiments were measured by using a Sieverts-type pressure-composition-temperature (PCT) apparatus (General Research Institute for Nonferrous Metals, China), which mainly consisted of a reactor and pressure transducer. It was heated to 450 °C at a rate of 5 °C min−1 in a static vacuum under a hydrogen pressure of 0.1 MPa to measure the non-isothermal desorption when the 0.3 g sample was loaded. The isothermal desorption properties of the doped samples were manipulated at 300 °C under a vacuum atmosphere.
The structural characteristics of the samples after ball milling and desorption were identified by powder X-ray diffraction (XRD, 40 kV, 300 mA, Cu Kα radiation) with the 2θ angle varying from 20 to 90° at a scanning rate of 5° min−1. X-ray photoelectron spectroscopy (XPS) was performed with a PHI-5300 spectrometer. The morphology and phase constitution of all samples after ball milling and desorption were observed by transmission electron microscopy (TEM, Tecnai G2 F30 S-TWIN, FEI, USA) and energy dispersive X-ray spectrometry (EDX, Tecnai G2 T20, FEI, USA). Differential scanning calorimetry (DSC) experiments were conducted in a Netzsch STA 449 F5 under an argon flow rate of 50 ml min−1 from 50 to 450 °C with a heating rate of 5–15 °C min−1. Furthermore, the microstructure and morphology of undoped and doped samples after ball milling and dehydrogenation were identified by field-emission scanning electron microscopy (FESEM, Quanta FEG 650).
3. Results and discussion
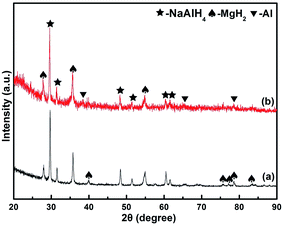
The nanocrystalline MnFe2O4 composite was prepared by the auto-combustion process. XRD patterns (Fig. 1(a)) of MnFe2O4 nanoparticles can be perfectly assigned to the cubic phase of MnFe2O4 (PDF: 74-2403). The diffraction peaks can be seen at 30.1°, 35.08°, 42.82°, 53.23°, 56.89°, 62.65° and 73.82°, corresponding to the (220), (311), (400), (422), (511), (440) and (533) planes of MnFe2O4. The average grain size of MnFe2O4 is 38 nm, calculated by the Scherrer formula based on the characteristic peaks. A typical TEM micrograph (Fig. 1(b)) of MnFe2O4 particles indicated multidispersed particles with a mean diameter of about 40 nm. The electron diffraction pattern indicated that the modified MnFe2O4 particles were crystallized. The small particles are one of the vital elements for catalyzed reactions and have a great impact on the decomposition temperature and hydrogen capacity.14,23,24Fig. 2 demonstrates the XRD patterns of the doped samples. In the XRD spectrum of the as-milled NaAlH4–MgH2 in Fig. 2(a), several NaAlH4 and MgH2 peaks can be found, indicating that there is no detectable reaction between NaAlH4 and MgH2 during the ball-milling process. As shown in Fig. 2(b), a new phase, Al, was identified in the MnFe2O4-doped sample although the NaAlH4 and MgH2 phases still dominated the XRD pattern. This shows that a significant amount of NaAlH4 is still stable and only a small portion is broken down into Al during the ball-milling process. In addition, the quite broad diffraction peaks compared to the as-milled NaAlH4–MgH2 suggest poor crystallization or small particle sizes.
In order to investigate the effects of manganese ferrite oxide on the desorption temperature among the two hydrides, thermal desorption curves of the doped samples are compared, as shown in Fig. 3. As can be seen in Fig. 3(d), the as-milled NaAlH4–MgH2 + 3 mol% MnFe2O4 sample starts to desorb hydrogen at 80, 204 and 308 °C for the three steps respectively. The onset dehydrogenation temperatures of NaAlH4–MgH2 + 3 mol% MnFe2O4 are individually reduced by 92, 116 and 115 °C, respectively, compared with those of as-milled NaAlH4–MgH2 (Fig. 3(a)). This reveals that MnFe2O4 nanoparticles have a significant effect on the dehydrogenation temperatures of NaAlH4–MgH2. Meanwhile, the initial temperatures of the three dehydrogenation steps of as-milled NaAlH4 + 3 mol% MnFe2O4 (Fig. 3(b)) are 126, 183 and 267 °C, respectively, and as-milled MgH2 + 3 mol% MnFe2O4 (Fig. 3(c)) starts to decompose at 340 °C. After they are combined together, the onset decomposition temperature of NaAlH4 and MgH2 in the MnFe2O4-doped composite is 46 °C, 42 °C lower than that of its unary components (NaAlH4 and MgH2), which indicates that the dehydrogenation performance of NaAlH4 and MgH2 is significantly improved by a mutual destabilization. In addition, it eventually liberates 6.75 wt% hydrogen, and 5.5 wt% hydrogen can be obtained below 250 °C. Consequently, through comprehensively considering the dehydrogenation temperature and total hydrogen content, it is reasonable to conclude that NaAlH4–MgH2 doped with 3 mol% MnFe2O4 ferrites exhibits optimal dehydrogenation properties.
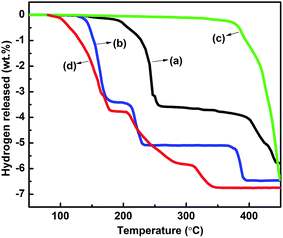 | ||
| Fig. 3 Thermal dehydrogenation profiles of ball-milled sample: (a) NaAlH4–MgH2, (b) NaAlH4 + 3 mol% MnFe2O4, (c) MgH2 + 3 mol% MnFe2O4, (d) NaAlH4–MgH2 + 3 mol% MnFe2O4. | ||
Considering hydrogen storage reversibility of the nanocrystalline MnFe2O4-containing NaAlH4–MgH2, the dehydrogenated samples were isothermally hydrogenated at 300 °C then subjected to re-dehydrogenation under 3 MPa hydrogen pressure as a function of temperature. The dehydrogenation curves of the nanocrystalline MnFe2O4-containing NaAlH4–MgH2 in the first four cycles are shown in Fig. 4. The MnFe2O4-added sample exhibits quite good cyclability, and hydrogen desorption amount remained at 4.30 wt% after four cycles. The corresponding desorption capacity retention was calculated to be nearly 90%, which is distinctly superior to the results reported previously.17–19 Accordingly, it is believed that the cyclability of NaAlH4–MgH2 is enhanced by adding MnFe2O4.
 | ||
| Fig. 4 Cycling dehydrogenation curves of the samples hydrogenated at 300 °C in the initial four cycles. | ||
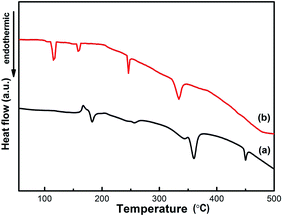
The NaAlH4–MgH2 composite system is further investigated by DSC, as shown in Fig. 5. One distinct exothermic peak and four distinct endothermic peaks are observed for the as-milled NaAlH4–MgH2 (Fig. 5(a)) during the heating process. The exothermic peak at 168.5 °C is due to the presence of surface hydroxyl impurities in NaAlH4, as reported in our previous studies.6,20 The first endothermic peak at 182.1 °C can be attributed to the decomposition of NaAlH4, while the second endothermic peak at 255.9 °C is due to the decomposition of Na3AlH6.14 The last two endothermic peaks at 359.8 and 450.1 °C correspond to the decomposition of MgH2 and NaH, respectively.15,16 It is notable that the endothermic peak of the melting of NaAlH4 disappeared in the DSC profiles of as-milled NaAlH4–MgH2 + 3 mol% MnFe2O4 in Fig. 5(b). All four endothermic events in the case of as-milled NaAlH4–MgH2 + 3 mol% MnFe2O4 have been shifted to lower temperature, and are, respectively, assigned to the decomposition of NaAlH4-, Na3AlH6-, MgH2- and NaH-relevant at 115.3, 160.5, 246.0 and 334.0 °C.20,24–26 The results show that NaAlH4 and MgH2 decomposes without melting with MnFe2O4 nanoparticles at a much lower temperature. One finds that the onset decomposition temperature in the DSC curves is slightly higher than that in the PCT curves, which may be because the dehydrogenation measurements were run under different conditions in these two cases, as was the case in our previous studies.20,22
To further investigate the effect of MnFe2O4 nanoparticles on the kinetic barrier of commercial NaAlH4–MgH2, the activation energy of 3 mol% MnFe2O4 + NaAlH4 is calculated using the Kissinger method.17 Thus, the activation energy (Ea) can be obtained from the slope on a plot of ln(βTp−2) versus 1000/Tp from DSC curves with heating rates of 5, 10 and 15 °C min−1. Fig. 6 shows the Kissinger plots of the NaAlH4–MgH2 doped with 3 mol% MnFe2O4. The apparent Ea values estimated from the Kissinger analysis for NaAlH4- and MgH2-relevant decomposition were found to be 51.29 and 105.34 kJ mol−1, respectively, which is lower compared to other catalysts.14,17,19 The result indicates that MnFe2O4 obviously decreases the kinetic barrier for dehydrogenation of NaAlH4–MgH2, providing a quantitative basis for improving the kinetics performance of dehydrogenation.
To understand the chemical events occurring in the ball milling and thermal desorption processes, the MnFe2O4-doped and dehydrogenated samples at different temperatures were subjected to XRD measurements, as shown in Fig. 7. It can be seen that there is no detectable reaction between NaAlH4 and MgH2 at 70 °C and part of the Al phase is derived from the decomposition of NaAlH4 during ball milling. After heating to 120 °C, the new peaks of Na3AlH6 appear, while the peak of MgH2 still exists. The fact that the peak intensities of Al increased and the peak of NaAlH4 weakened indicated that the reaction in eqn (1) has taken place, as shown below:
| 3NaAlH4 → Na3AlH6 + 2Al + 3H2 | (1) |
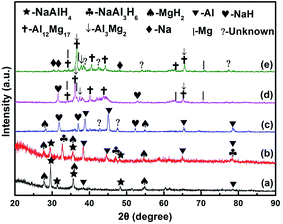 | ||
| Fig. 7 XRD patterns of as-milled NaAlH4–MgH2 + 3 mol% MnFe2O4 dehydrogenated at (a) 70 °C, (b) 120 °C, (c) 200 °C, (d) 300 °C and (e) 350 °C. | ||
When the dehydrogenation temperature was increased to 200 °C, the appearance of NaH indicated that Na3AlH6 was partially decomposed, which is consistent with the first two stages of the DSC curves. After further heating to 300 °C, the peaks of Mg17Al12, Mg2Al3 and Mg were observed, and the peaks of MgH2 and Al phases disappeared. Typically, this step is associated with the formation of intermediate hydrides.12,25 So, the main reaction in eqn (2)–(4) involved in this step may take place:
| 12Al + 17MgH2 → Mg17Al12 + 17H2 | (2) |
| 2Al + 3MgH2 → Mg3Al2 + 3H2 | (3) |
| MgH2 → Mg + 3H2 | (4) |
When the dehydrogenation temperature was increased to 350 °C, the intensity of Mg17Al12 and Mg3Al2 phases became stronger and the peaks of NaH phases disappeared, indicating that the system was fully dehydrogenated. These results also confirmed that the hydrogen released in the third stage was from the MgH2-relevant decomposition through the reaction in eqn (2)–(4), while the decomposition of NaH in eqn (5) is related to the last stage, as illustrated below:
| NaH → Na + 0.5H2 | (5) |
According to the above results, Mg17Al12 and Mg3Al2 phases are observed during dehydrogenation, which is in accord with literature reports.15–19,24 It is expected that the formation of the Mg17Al12 and Mg3Al2 phases during dehydrogenation enhances thermodynamic properties of NaAlH4–MgH2. There are some unknown diffraction peaks after dehydrogenation at 200 °C, indicating the existence of a crystallized phase. However, there are no diffraction peaks of Mn- or Fe-containing species. This is believed to be mainly because the Mn or Mn-containing phases are unknown or in amorphous state. As discussed in our previous studies,10,20 the formation of Fe–O and amorphous Mn/MnOx species plays a vital role in enhancing dehydrogenation properties of NaAlH4 and MgH2. XPS spectroscopy of MnFe2O4-doped sample was carried out to further investigate the nature of the Mn and Fe species after ball-milling and dehydrogenation.
Initial XPS measurements were carried out on the Mn 2p and Fe 2p peaks of MnFe2O4 in Fig. 8(a and b). As can be seen, the Fe 2p3/2 spectrum was registered at 710.8 eV and the Fe 2p1/2 spectrum was registered at 724.8 eV, which indicated fully oxidized iron on the surface.27 In addition, the Fe 2p3/2 peak is stronger than that of Fe 2p1/2 and its area is greater than that of Fe 2p1/2 because Fe 2p3/2 has degeneracy of four states while Fe 2p1/2 has only two in spin–orbit (j–j).28 There is a satellite line of the Fe 2p3/2 peak around 719.1 eV.29 The XPS peaks of Mn 2p centered at 642.8 and 653.8 eV, respectively, come from either Mn(II) or Mn(VI).30,31 Therefore, Mn is solely bivalent according to the valence of Fe. By referring to the two-phase diagram, there were no corresponding intermetallic compounds between Fe and Mn because they could not dissolve each other. Furthermore, the satellite line of the Fe 2p3/2 peak disappeared after ball-milling in Fig. 8(c), and the intensities of the peaks were weaker than the Fe 2p peaks of MnFe2O4, especially the Fe 2p3/2 spectrum at 712.5 eV. After dehydrogenation at 350 °C, the signal at 711.3 eV is assigned to NaFeO2 in Fig. 8(e) and others at 724.3 and 732.7 eV are attributed to iron oxides.32 For Mn 2p, the peaks in Fig. 8(d) appearing at 641.3 and 653.8 eV, which correspond to MnOx/Mn phase indicated that Mn(II) or Mn(VI) had transformed into amorphous oxides after ball-milling. However, after heating to 350 °C, the status of manganese was not affected by the desorption reaction, in Fig. 8(f), but a slight peak appeared at 646.8 eV. Li reported that Mg2MnO4 nanoparticles was observed after milling or upon desorption reactions of Mn-based MgH2 doped systems.10 It is reasonable to be assume that a small amount of Mg2MnO4 can also be formed in Mn-based NaAlH4–MgH2 doped systems. Therefore, the unknown phases may be NaFeO2 and Mg2MnO4, the amorphous phases may be Mn/MnOx species as well as iron oxides, which also worked together in improving dehydrogenation properties of NaAlH4–MgH2.10,14,20
 | ||
| Fig. 8 XPS spectra: (a) Fe 2p and (b) Mn 2p of MnFe2O4; (c) Fe 2p and (d) Mn 2p of MnFe2O4-doped NaAlH4–MgH2; (e) Fe 2p and (f) Mn 2p of MnFe2O4-doped NaAlH4–MgH2 dehydrogenated at 350 °C. | ||
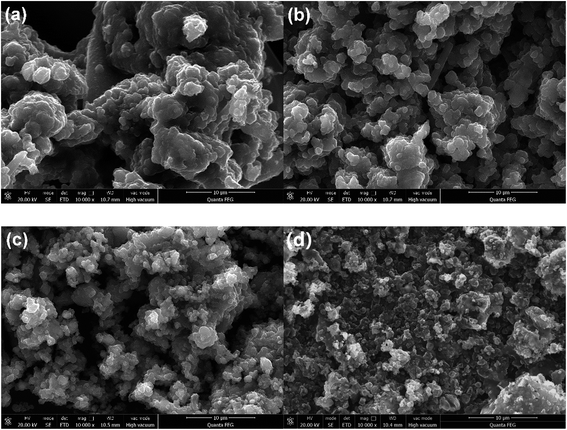
The dehydrogenation/hydrogenation properties are closely related with particle sizes and surface defects. For a better understanding of the potential destabilization mechanism of NaAlH4–MgH2 doped with MnFe2O4, the FESEM images of the sample are shown in Fig. 9. The images show that the size of NaAlH4–MgH2 (Fig. 9(a)) is different after milling and the particle diameters is distributed in the range of 3–5 μm. However, the particles are close together, which is not conducive to hydrogen desorption kinetics. Compared to the as-milled NaAlH4–MgH2, the particle size of as-milled NaAlH4–MgH2 with 3 mol% MnFe2O4 nanoparticles (Fig. 9(c)) became smaller (about 100–500 nm) and uniform. Although there are some clusters in the MnFe2O4-doped sample, the grain boundaries between the particles can be clearly seen, which proves that the introduction of MnFe2O4 has brought about a decrease in the size of the particles. The refined particle size renders much shorter diffusion paths for hydrogen in the dehydrogenation/hydrogenation process.20,22 This ability is one of the reasons why adding MnFe2O4 nanoparticles improves the NaAlH4–MgH2 kinetics, as these nanosized particles may serve as nucleation sites and create more grain boundaries at the surface of the NaAlH4–MgH2 matrix. As shown in Fig. 9(b), the particle size of NaAlH4–MgH2 after dehydrogenation has no obvious change, but its distribution is more uniform than before desorption. It can also be seen that the particle size of the MnFe2O4-doped sample after dehydrogenation (Fig. 9(d)) is reduced and has become uniform. Therefore, this may be the reason for a partial reversibility after the MnFe2O4 catalyst is added. It should be noted that the embedded MnFe2O4 cannot be observed in the NaAlH4–MgH2 surface owing to its nanoparticle size, which is consistent with the result of TEM images (Fig. 1(b)) of MnFe2O4.
TEM micrograph observation is performed to analyze the condition of MnFe2O4 distributed in the matrix of NaAlH4–MgH2 at nanometer scale. Fig. 10 shows dark field images, high resolution transmission electron microscopy and energy dispersive X-ray detector analyses of the as-milled NaAlH4–MgH2 + 3 mol% MnFe2O4 sample. In Fig. 10(a), some black particles are homogenously distributed among the gray matrix. To determine what these particles are, corresponding EDX measurements of the black area A and the gray area B are conducted, as shown in Fig. 10(c) and (d), respectively. For the black regions, Mn, Fe, O, Na, Mg and Al are identified by the EDS analysis, where Mg, Na and Al are derived from the basis material. However, Mn and Fe elements are detected in the gray areas, where their intensity is much weaker than in the black area. Thus, it could be deduced that the black nanoparticles are NaAlH4–MgH2 and the gray nanoparticles correspond to MnFe2O4-doped NaAlH4–MgH2 matrix. The values of interlamellar spacing in Fig. 10(b) are 2.51 and 1.86 nm, corresponding to NaAlH4 and MgH2, respectively. In addition, the boundaries appear as a large number of defects, which will be the paths for hydrogen diffusion.21,22
 | ||
| Fig. 10 (a) TEM and (b) HRTEM micrographs; EDX: (c) A region and (d) B region are results of as-milled NaAlH4–MgH2 + 3 mol% MnFe2O4. | ||
The electron micrograph of dehydrogenated MnFe2O4-doped sample is shown in Fig. 11(a), which indicates that the catalyst is still uniformly distributed in the NaAlH4–MgH2 matrix after dehydrogenation. To further investigate the microstructure of MnFe2O4-doped sample, selected area electronic diffraction results are shown in Fig. 11(b). The diffraction rings could be well indexed with crystal planes of Al12Mg17 (330), Al12Mg17 (332) and Al12Mg17 (721), which is in good agreement with the XRD analysis.
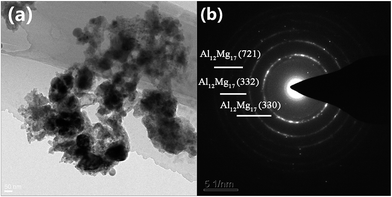 | ||
| Fig. 11 (a) TEM micrographs and (b) SAED pattern of as-milled NaAlH4–MgH2 + 3 mol% MnFe2O4 after dehydrogenation at 350 °C. | ||
4. Conclusion
The onset temperatures of the dehydrogenation steps of MnFe2O4-doped NaAlH4–MgH2 composites are 92, 116 and 115 °C lower than those of as-milled NaAlH4–MgH2, respectively. Furthermore, NaAlH4–MgH2 + 3 mol% MnFe2O4 displays good cycle stability at 300 °C and only a slight capacity loss after four cycles. The apparent activation energies estimated from the Kissinger analysis for NaAlH4- and MgH2-relevant decomposition are found to be 51.29 and 105.34 kJ mol−1, respectively. XRD and XPS results show that NaFeO2, Mg2MnO4 and the amorphous Mn/MnOx species as well as iron oxides contribute to enhancing dehydrogenation performance of NaAlH4–MgH2.Acknowledgements
This study was financially supported by the National Natural Science Foundation of China (NSFC, Grant No. 51471054) and Beijing Natural Science Foundation (BNSF, 2152019). The authors would like to thank Liu ran from shiyanjia lab for the support of XPS analysis.References
- U. Eberle, M. Felderhoff and F. Schüth, Angew. Chem., Int. Ed., 2009, 48, 6608–6630 CrossRef CAS PubMed.
- L. Schlapbach and A. Züttel, Nature, 2001, 414, 353–358 CrossRef CAS PubMed.
- N. Juahir, N. S. Mustafa, A. Sinin and M. Ismail, RSC Adv., 2015, 5, 60983–60989 RSC.
- J. Lu, Y. J. Choi, Z. Z. Fang, H. Y. Sohn and E. Rönnebro, J. Am. Chem. Soc., 2009, 131, 15843–15852 CrossRef CAS PubMed.
- Y. P. Pang, Y. F. Liu, M. X. Gao, L. Z. Ouyang, J. W. Liu, H. Wang, M. Zhu and H. G. Pan, Nat. Commun., 2014, 5, 3519 Search PubMed.
- X. Zhang, Y. F. Liu, K. Wang, M. X. Gao and H. G. Pan, Nano Res., 2015, 8, 533–545 CrossRef CAS.
- A. S. Gangrade, A. A. Varma, N. K. Gor, S. Shriniwasana and S. S. V. Tatiparti, Phys. Chem. Chem. Phys., 2017, 19, 6677–6687 RSC.
- B. Paik, I. P. Jones, A. Walton, V. Mann, D. Book and I. R. Harris, J. Alloys Compd., 2010, 492, 515–520 CrossRef CAS.
- G. Sun, Y. Li, X. Zhao, J. Wu, L. Wang and Y. Mi, RSC Adv., 2016, 6, 23110–23116 RSC.
- P. Li, Q. Wan, Z. L. Li, F. Q. Zhai, Y. L. Li, L. Q. Cui, X. H. Qu and A. A. Volinsky, J. Power Sources, 2013, 239, 201–206 CrossRef CAS.
- H. Liu, X. Wang, Y. Liu, Z. Dong, H. Ge, S. Li and M. Yan, J. Phys. Chem. C, 2014, 118, 37–45 CAS.
- F. Cova, F. C. Gennari and P. A. Larochette, RSC Adv., 2015, 5, 90014–90021 RSC.
- J. J. Vajo and G. L. Olson, Scr. Mater., 2007, 56, 829–834 CrossRef CAS.
- Y. H. Huang, P. Li, Q. Wan, J. Zhang, Y. Li, R. W. Li, X. P. Dong and X. H. Qu, J. Alloys Compd., 2017, 709, 850–856 CrossRef CAS.
- M. Ismail, Y. Zhao, X. B. Yu, J. F. Mao and S. X. Dou, Int. J. Hydrogen Energy, 2011, 36, 9045–9050 CrossRef CAS.
- A. Bhatnagara, S. K. Pandeya, V. Dixita, V. Shuklaa, R. R. Shahib, M. A. Shaza and O. N. Srivastavaa, Int. J. Hydrogen Energy, 2014, 39, 14240–14246 CrossRef.
- H. H. Cheng, Y. Chen, W. P. Sun, H. R. Lou, Y. Q. Liu, Q. Qi, J. M. Zhang, J. J. Liu, K. Yan, H. M. Jin, Y. Zhang and S. Y. Yang, J. Alloys Compd., 2017, 698, 1002–1008 CrossRef CAS.
- M. Ismail, Y. Zhao, X. B. Yu and S. X. Dou, Int. J. Hydrogen Energy, 2012, 37, 8395–8401 CrossRef CAS.
- R. U. Din, X. H. Qu, P. Li, L. Zhang, M. Ahmad, M. Z. Iqbal, M. Y. Rafique and M. H. Farooq, RSC Adv., 2012, 2, 4891–4903 RSC.
- Q. Wan, P. Li, Z. L. Li, K. F. Zhao, Z. W. Liu, L. Wang, F. Q. Zhai, X. H. Qu and A. A. Volinsky, J. Power Sources, 2014, 248, 388–395 CrossRef CAS.
- F. Q. Zhai, P. Li, A. Z. Sun, S. Wu, Q. Wan, W. N. Zhang, Y. L. Li, L. Q. Cui and X. H. Qu, J. Phys. Chem. C, 2012, 116, 11939–11945 CAS.
- J. Zhang, P. Li, Q. Wan, F. Q. Zhai, A. A. Volinsky and X. H. Qu, RSC Adv., 2015, 5, 81212–81219 RSC.
- R. J. Xiong, G. Sang, G. H. Zhang, X. Y. Yan, P. L. Li, Y. Yao, D. Luo, C. Chen and T. Tang, Int. J. Hydrogen Energy, 2017, 42, 6088–6095 CrossRef CAS.
- J. K. Bendyna, S. Dyjak and P. H. L. Notten, Int. J. Hydrogen Energy, 2015, 40, 4200–4206 CrossRef CAS.
- M. Ismail and N. S. Mustafa, Int. J. Hydrogen Energy, 2016, 41, 18107–18113 CrossRef CAS.
- Y. J. Kwak, S. H. Lee, B. S. Lee, H. R. Park and M. Y. Song, J. Nanosci. Nanotechnol., 2015, 15, 8763–8772 CrossRef CAS PubMed.
- T. J. Daou, G. Pourroy, S. Bégin-Colin, J. M. Grenèche, C. Ulhaq-Bouillet, P. Legaré, P. Bernhardt, C. Leuvrey and G. Rogez, Chem. Mater., 2006, 18, 4399–4404 CrossRef CAS.
- T. Yamashita and P. Hayes, Appl. Surf. Sci., 2008, 254, 2441–2449 CrossRef CAS.
- J. Li, Y. Jiao and C. C. Wan, Front. Agr. Sci. Eng., 2017, 4, 116–120 CrossRef.
- K. Yan, Y. Lu and W. Jin, ACS Sustainable Chem. Eng., 2016, 4, 5398–5403 CrossRef CAS.
- J. Hu, M. C. L. Irene and G. H. Chen, Langmuir, 2005, 21, 11173–11179 CrossRef CAS PubMed.
- M. Descostes, F. Mercier, N. Thromat, C. Beaucaire and M. Gautier-Soyer, Appl. Surf. Sci., 2000, 165, 288–302 CrossRef CAS.
| This journal is © The Royal Society of Chemistry 2017 |


