 Open Access Article
A computational approach towards understanding hydrogen gas adsorption in Co–MIL-88A†
Nguyen Thi Xuan Huynhab,
O My Na a,
Viorel Chihaia
 c and
Do Ngoc Son
 *a
*a
aHo Chi Minh City University of Technology, VNU-HCM, 268 Ly Thuong Kiet Street, District 10, Ho Chi Minh City, Vietnam. E-mail: dnson@hcmut.edu.vn
bQuy Nhon University, 170 An Duong Vuong Street, Quy Nhon City, Binh Dinh Province, Vietnam
cInstitute of Physical Chemistry “Ilie Murgulescu” of the Romanian Academy, Splaiul Independentei 202, Sector 6, 060021 Bucharest, Romania
First published on 14th August 2017
Abstract
Unsaturated metal centers in metal–organic framework MIL-88A are able to significantly enhance the amount of gas adsorbed at ambient temperatures and low pressures. This material has been investigated for various applications; however, it has not yet been tested for hydrogen storage. In this research, we examined the interaction of hydrogen gas (H2) with Co–MIL-88A by using the van der Waals dispersion-corrected density functional theory calculations. The H2 molecule was found to adsorb most favorably at the hollow site of the metal trimers in Co–MIL-88A because of the maximum overlap between the bonding state of the H2 molecule and the total density of state of the Co–MIL-88A. In addition, the hydrogen adsorption isotherms were also assessed by grand canonical Monte Carlo simulations. The results showed that Co–MIL-88A is one of the most effective H2 storage materials.
1. Introduction
Metal–organic framework (MOF) materials have outstanding characteristics for gas storage and capture with a high adsorption capacity compared with that of other porous solids or sorbents.1–3 Therefore, MOFs have been studied for hydrogen storage to solve the problem of energy carrier in both mobile and stationary applications.4–7 Although many MOFs exhibited a large amount of hydrogen uptake at cryogenic temperatures, they do not satisfy the target of the US Department of Energy (DOE) for commercialization of MOFs at ambient temperatures with pressures below 100 bar.8–14 Among newly synthesized MOFs, MIL-88A has an excellent flexibility and thermal stability15 and simultaneously contains coordinatively unsaturated metal sites that can enhance the gas storage capacity at ambient temperatures and low pressures.16,17 Therefore, MIL-88A can be a good candidate for hydrogen storage.7 MIL-88A has already been studied for the adsorption of NO18 and CO2.19 However, this MOF has not yet been tested for hydrogen gas.Cobalt, a transitional metal, plays an important role in improving the H2 uptake capacity of MOFs. For example, Co2(dobpdc) showed the highest gravimetric H2 uptake among M2(dobpdc), where M is Mg, Mn, Fe, Co, Ni or Zn.20 The result of Zhou and co-workers pointed out that the higher the temperature, the larger the uptake of H2 adsorbed in Co–MOF-74 [also called CPO-27–Co, Co2(dobdc) or Co2(dhtp)].21 Their result showed, at 150 K, Co–MOF-74 has the highest H2 uptake in comparison to M–MOF-74 (M = Mg, Mn, Ni, Zn) (see the ESI of ref. 21). Therefore, we expect that the Co-based MIL-88A (hereafter called Co–MIL-88A) with the coordinatively unsaturated Co metal sites (CUS)22 also offer a high hydrogen sorption capacity, especially at ambient temperatures.
In this work, we evaluate the hydrogen adsorption capability of the Co–MIL-88A and explain the physical origin for the interaction between H2 molecule and the Co–MIL-88A MOF. We first search for the most favorable adsorption sites of H2 via computing the adsorption energy and then analyze electronic properties based on the van der Waals dispersion-corrected density functional theory calculations. We then calculate hydrogen adsorption isotherms of the Co–MIL-88A by using grand canonical Monte Carlo (GCMC) simulations.
2. Computational methods
For the study of favorable adsorption sites and electronic structure properties, we employed the Vienna ab initio simulation package (VASP)23 for the van der Waals dispersion-corrected (vdW-DF version) density functional theory (DFT) calculations. The plane-wave basis set with the cut-off energy of 700 eV, the revised Perdew–Burke–Ernzerhof (revBPE) functional for the exchange–correlation energy,24,25 and the projector-augmented-wave method for the electron–ion interaction26,27 were used to perform the calculations. The surface Brillouin-zone integrations were performed by using the Monkhorst and Pack k-point sampling technique28 with the 4 × 4 × 4 mesh grid and the gamma point at the center. The Methfessel–Paxton smearing29 of order 1 was used for the geometry relaxation with the smearing width of 0.1 eV. However, the linear tetrahedron method with Blöchl corrections30 was employed for the calculations of total energy.The electronic structure properties were elucidated through the analysis of the density derived electrostatic and chemical (DDEC) net atomic charge,31 the Bader point charge,32 the electronic density of state (DOS), and the charge density difference (CDD).
For estimating the binding strength of H2 with Co–MIL-88A, we calculated the adsorption energy Eads of H2 by using the following formula:
| Eads = −Eb = EMOF+H2 − (EMOF + EH2). | (1) |
Grand canonical Monte Carlo (GCMC) simulations were used to compute the gravimetric loadings of hydrogen gas in the Co–MIL-88A MOF by using the simulation package RASPA, which is a molecular simulation software for nanoporous materials.33 These simulations were performed in the VTμ (constant volume, temperature, and chemical potential) ensembles at two different temperatures (77 K and 298 K) for pressures up to 100 bar. The number of MC steps was 3 × 10⁵ for the random insertion, deletion, translation, and rotation of H2 molecules in the simulation box of the Co–MIL-88A framework of 3 × 3 × 2 times of the unit cell. The framework was kept rigid during the simulation process, while hydrogen molecule freely moves in the MOF structure. The interaction between the H2 gas and the atoms (C, O, H and Co) of the MOF were described through the Lennard-Jones (LJ) 6–12 potential (the first two terms, in square parenthesis) and the electrostatic potential (the last term), presented by
 | (2) |
 | (3) |
| Atom type | ε/kB (K) | σ (Å) | DDEC charge (e−) |
|---|---|---|---|
| Co | 7.05 | 2.56 | 1.158 |
| C (on the metal trimer) | 47.86 | 3.47 | 0.734 |
| C (on the linker) | 47.86 | 3.47 | −0.169 |
| O | 48.16 | 3.03 | −0.559 |
| μ3-O | 48.16 | 3.03 | −0.858 |
| H | 7.65 | 2.85 | 0.117 |
| Hcom of H2 molecule | 36.70 | 2.96 | −0.936 |
The Lennard-Jones interaction is neglected beyond the unique cutoff radius of 12 Å. The electrostatic equation was calculated by the Ewald summation technique. For the hydrogen molecule, a single LJ interaction site model at the center of mass (Hcom) was used with the LJ parameters taken from the TraPPE force field. These parameters are σHcom = 2.96 Å and εHcom/kB = 36.70 K with the H–H bond length of 0.74 Å.
3. Results and discussion
3.1. Geometry optimization of Co–MIL-88A
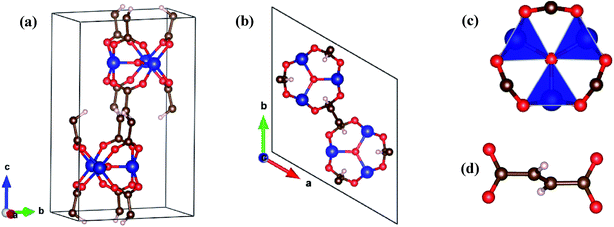
In this work, the Co–MIL-88A was designed with the chemical formula [{Co3O(–O2C–C2H2–CO2–)3}]n having a three-dimensional hexagonal structure consisting of the trimers of Co octahedra linked to the fumarate ligands, where n is the number of chemical formula units. This structure has the neutral charge with the Co atoms in a closed shell configuration due to bonding with the other atoms of the MOF. Fig. 1 shows the structure of the unit cell of Co–MIL-88A with n = 2. The dimensions of the unit cell are a, b, and c, where a = b and the angles α = β = 90°, γ = 120°.After the primary unit cell for Co–MIL-88A was designed, the geometry optimization for Co–MIL-88A was performed for its volume and ionic positions. The ionic positions were relaxed by using the van der Waals-density functional (vdW-DF) of Langreth and Lundqvist et al.34
To obtain the optimized volume of the unit cell, we calculated the total energy of the unit cell for the following conditions. For several fixed values of c/a ratio between 1.25 and 1.39, we varied the a lattice constant from 10.58 to 11.98 Å in 0.2 Å grids. We then fitted the unit cell volume to the Murnaghan's equation of state35 based on the obtained total energy versus the structural parameter a and c/a. Fig. 2a shows that the minimum energy is found at different a for the different c/a. The collection of the minimum energy points as a function of the lattice constant a and the c/a ratio is presented in Fig. 2b and c, respectively. The detailed values of the minimum energies are listed in Table 2. On the basis of these curves, we found an optimized lattice constant of a = b = 11.222 Å and c = 14.719 Å, corresponding to a volume of 1605.34 Å3. This volume is close to the experimental value of 1589 Å3 for the Fe–MIL-88A.36 It should be noted that the ionic radius of Co3+ is 0.69 Å which is the same as that of the Fe3+ ion.
| c/a ratio | Lattice constant a (Å) | Minimum total energy (eV) |
|---|---|---|
| 1.253 | 11.42 | −358.01 |
| 1.273 | 11.36 | −358.55 |
| 1.293 | 11.29 | −358.78 |
| 1.313 | 11.23 | −358.87 |
| 1.333 | 11.16 | −358.77 |
| 1.353 | 11.10 | −358.58 |
| 1.373 | 11.05 | −358.23 |
| 1.393 | 10.99 | −357.79 |
3.2. Favorable hydrogen adsorption sites and electronic properties
After obtaining the Co–MIL-88A unit cell with the optimized lattice constants, a hydrogen molecule (H2) is loaded into the unit cell at many different sites. We then performed geometry optimization and calculated the adsorption energy of H2. The results are listed in Table 3 together with the average bond length of H2 to the closest atoms of the MOF. From these calculations, we found the favorable adsorption sites of H2. Fig. 3a and b are the adsorption configurations of H2 on the hollow and ligand sites, and Fig. 3c and d are the side-on and end-on configurations of H2 over the Co metal atom. For the metal end-on configuration, the H atoms of H2 molecule and the nearest Co atom form an angle of 180°. The hollow site is formed by four oxygen atoms (O1, O2, O3 and O4) of the MOF. The hydrogen molecule adsorbs in a parallel configuration with the plane of these oxygen atoms. For the ligand site, H2 adsorbs over the fumarate with the H–H bond perpendicular to the line connecting C1 and C2. The average distance of H2 to the reference atoms of the MOF (3.20 Å) for the most favorable adsorption site (i.e. the hollow site) is comparable to that for the side-on and end-on ones on the metal site, ca. 3.15 Å, but significantly shorter than that for the binding to the ligand, 3.41 Å.| Sites | Eads (kJ mol−1) | Eb (kJ mol−1) | dH2-A (Å) | qH2 (e) |
|---|---|---|---|---|
| Hollow | −13.72 | 13.72 | 3.20 | −0.0002 |
| Ligand | −10.76 | 10.76 | 3.41 | −0.0006 |
| Metal (side-on) | −10.61 | 10.61 | 3.14 | −0.0038 |
| Metal (end-on) | −6.50 | 6.50 | 3.15 | −0.0006 |
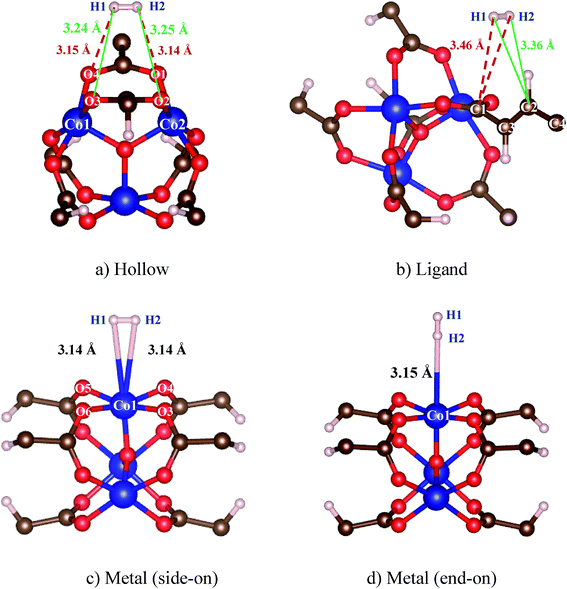 | ||
| Fig. 3 The favorable adsorption configurations of H2 in Co–MIL-88A. The bond distance to the reference atoms is correspondingly shown for each configuration. | ||
From Table 3, we see that, on the basis of the adsorption energy, the favorable adsorption site is in the order of hollow > ligand > metal side-on > metal end-on. The most favorable adsorption of H2 is at the hollow site with a binding energy of 13.72 kJ mol−1. Although, hydrogen molecule was also found to have strong adsorption at the hollow site of MOF-5,37–39 it is usually expected that the strong hydrogen bonding is at the metal site. Surprisingly, the adsorption is even less favorable on the metal site than on the organic ligand, which is different with common expectation. For instance, several authors found that the hydrogen binding energies on the ligand were smaller than those on the metal.40,41 The reason for this strong adsorption of H2 on the organic ligand of the Co–MIL-88A may be due to the relatively short fumarate bridge. Thereby, the metal and oxygen atoms may interact with the H2 located at the hollow and ligand sites. This point will be discussed through the analysis of the electronic density of state in the below part. For the H2 adsorbed end-on configuration on the metal site, the binding energy of this configuration is the smallest compared with that of the others.
All the vibrational modes for the H2 molecule showed positive values implying that the hollow, ligand, metal end-on and metal side-on configurations are local minima of the H2 adsorption (see Table S1 in ESI†). We also computed the H–H stretching frequency shift (Δν) for the different adsorption sites relative to the stretching frequency of the free H2 molecule. Table 4 shows that the stretching frequency shift is about 27–46 cm−1, which is much smaller than those in the work of Solans-Monfort.42 This no significant perturbation of the stretching frequency suggests that the charge transfer between the MOF and the adsorbed H2 should be little. Additionally, the zero-point vibration energy is about 1.8 kJ mol−1 larger for the hollow site compared to the metal sites, but it is still smaller than the electronic energy difference of about 3 kJ mol−1. Thereby, the hollow site is the likely binding site even including zero-point energy corrections.
Although the binding energy of H2 with the Co–MIL-88A is much smaller than DOE's target binding energy of 20–25 kJ mol−1,43,44 it is greater than that of many MOFs currently achieved ∼7–10 kJ mol−1. For instance, by the same vdW-DF approach, the Eb of H2 is about 9.8–10.4 kJ mol−1 for M2(BDC)2(TED) series, where M is Zn, Mg, Ni.45
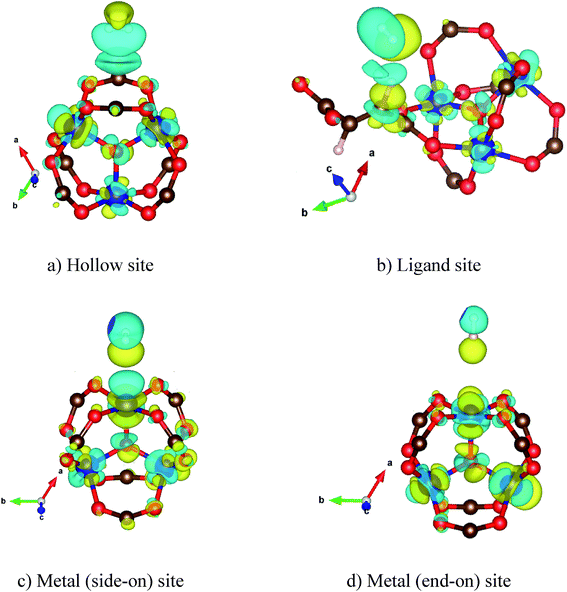
To understand the interaction of the H2 molecule in the Co–MIL-88A structure, we analyzed the charge density difference of the absorbed H2 molecule and the MOF, which is shown in Fig. 4. On the hollow, the ligand, and the metal side-on, the H2 molecule interacts with the MOF through its bonding state, while on the metal end-on site the interaction is via the anti-bonding state of H2. The charge exchange cloud of the H2 molecule closest to the MOF shows a charge gain for the cases of the H2 molecule adsorbed on the ligand, the metal side-on, and the metal end-on; however, it shows a charge donation for the most favorable adsorption site, i.e., the hollow site of the cobalt metal oxide. The size of the charge exchange cloud is qualitatively proportional to the binding strength of H2 with the MOF, see Table 3 for the binding energy. The hollow configuration (Fig. 4a) has the largest charge exchange cloud due to the strongest interaction with the MOF, while the metal end-on configuration (Fig. 4d) has the smallest charge exchange cloud because of the weakest interaction.
We also calculated the Bader charge exchange of the H2 molecule, see Table 3. We find that the Bader charge of the H2 molecule is very small and within the error of the charge calculation of 0.0005 e. Therefore, we can conclude that there is no significant charge transfer between the H2 molecule and the Co–MIL-88A due to the weak physisorption of the H2 molecule. This result is also in good agreement with the prediction from the small H2 stretching frequency shift obtained in the above part.
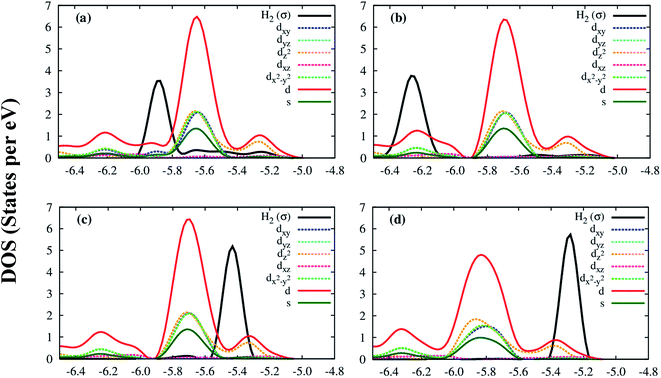
Deeper insights of the MOF–H2 interaction can be exposed through the analysis of the electronic density of states. Fig. 5 shows that the H2 molecule interacts with the Co atoms of the Co–MIL-88A, where the state of H2 overlaps with the d orbital of the Co atoms. For the hollow, the ligand, and the metal side-on configurations, the dxy, dx2−y2 and dz2 orbitals of the metal atoms mainly contribute to the interaction with the hydrogen molecule, while it is the dz2 orbital for the metal end-on configuration. The s orbital of the metal atoms of the MOF also contributes to the interaction with H2 but most substantially for the most favorable H2 adsorption configuration, on the hollow site. Although the H2 molecule at the hollow site is far away from the nearest Co atoms with the average distance of 4.15 Å, the interaction of the H2 molecule and the Co atoms is still possible through the indirect interaction with the oxygen atoms in the outer space of the metal oxide. Fig. S1 in ESI† shows that the charge cloud of the Co atoms mixes with the charge cloud of the oxygen atoms, which expands in a large area and approaches the charge cloud of the H2 molecule. Fig. 6 shows a more visible evidence of the interaction of the H2 molecule with the Co atoms through the real-space wave functions.46 We can see that there is an overlapping between the wave function of the H atoms of the H2 molecule and that of the Co atoms. Furthermore, the μ3-O oxygen atoms of the Co–MIL-88A were also found to participate in the interaction with H2 via their px and py orbitals, see Fig. S2 in ESI.†
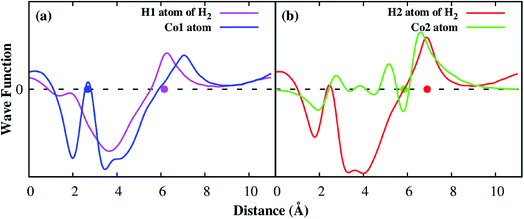 | ||
| Fig. 6 The real part of the wave functions of the hydrogen atom and the Co atom along x direction, the vector a in Fig. 1a. The dot denotes for the position of the atoms along the x direction. | ||
Although the Co and μ3-O atoms can interact with the hydrogen molecule, the most profound interaction is from the px, py, pz orbitals of all atoms of the Co–MIL-88A. Fig. 7 shows that a large portion of total p DOS overlaps with the H2 DOS, which covers almost the whole area of the H2 DOS. This result implies that the p orbital of all atoms of the Co–MIL-88A should influence on the hydrogen adsorption more significantly compared to the s and d orbitals of the Co atoms.
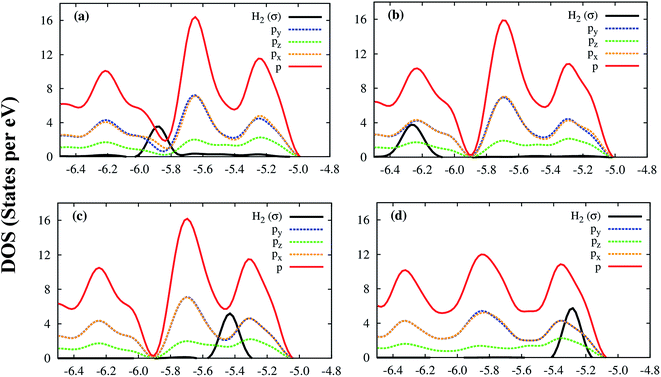 | ||
| Fig. 7 The electronic density of state of the hydrogen molecule and the p orbitals of all atoms of Co–MIL-88A at the sites: hollow (a), ligand (b), metal side-on (c), and metal end-on (d). | ||
Remarkably, we can quantitatively assess the interaction strength of H2 with the MOF by calculating a common area of DOS,47 which is the overlap area between the DOS of the adsorbed H2 and the DOS of the Co–MIL-88A as demonstrated in Fig. 8a. Here, we calculate the common area between the DOS of the adsorbed H2 molecule and the total DOS from all orbitals of the Co–MIL-88A. The results for the different adsorption sites can be seen in the seventh column of Table 5 and are plotted versus the binding energy in Fig. 8b. It shows that this quantity correlates to some extent with the binding energy, i.e., the larger the common area, the stronger the binding strength is. Furthermore, Fig. 5 and 7 also show that the more stable the H2 adsorption configuration becomes, the lower the peak height of the H2 DOS is. By calculating the DOS area of the adsorbed H2 molecule, listed in the last column of Table 5 and shown in Fig. 8b, we found that this peak area is inversely proportional to the common area of DOS.
| Sites | d orbital of Co | s orbital of Co | s and d orbitals of Co | p orbital of μ3-O atoms | Total p orbital of all atomsa | Total DOS of all atoms | Area of H2 DOS |
|---|---|---|---|---|---|---|---|
| a We do not list the common area of the H2 DOS with the O p (except for μ3-O p) and C p orbitals separately because there are no simple rules for them. | |||||||
| Hollow | 0.750 | 0.378 | 1.128 | 0.793 | 1.277 | 2.405 | 0.7050 |
| Ligand | 0.704 | 0.180 | 0.884 | 0.731 | 1.400 | 2.284 | 0.7052 |
| Metal side-on | 0.376 | 0.081 | 0.457 | 0.250 | 1.433 | 1.890 | 0.7358 |
| Metal end-on | 0.258 | 0.017 | 0.275 | 0.049 | 1.488 | 1.763 | 0.7836 |
We can break the contribution to the common area of the total DOS of all atoms into different portions that are from the s and d orbitals of Co atoms and from the total p orbital of all atoms of the MOF. We also calculated the common area of the H2 DOS and the total s orbital of oxygen and carbon atoms; however, there is no significant contribution to the interaction with the H2 molecule. Table 5 shows that although the contribution from the total p orbital of all atoms is large, the overlapping with the total p orbital of all atoms decreases while the overlapping with the s and d orbitals of Co atoms increase significantly for the more stable adsorption configurations. We also found that the common area of the H2 DOS with the s orbital and the d orbital of Co atoms and the p orbital of the μ3-O atoms monotonically increase in the order: the metal end-on < the metal side-on < the ligand < the hollow site. In generally speaking, the inner atoms of the trimers such as Co and μ3-O become more and more important for stabilizing the H2 adsorption. With the electronic analysis, we could explain the site dependence of the H2 adsorption.
3.3. Hydrogen adsorption isotherms
In the previous section, we provided some insight toward the H2 adsorption in the MOF. Here, we will quantitatively assess the storage capability of the Co–MIL-88A by calculating the hydrogen adsorption isotherms using GCMC simulations. The best way of performing GCMC simulations is to use the force field with both the dispersion and electrostatic interactions that were parameterized on the same footing from the DFT calculations. However, the parameterization of only the Coulomb interaction from the DFT while the parameters of the dispersion term was taken from the generic force field for MOFs33 which has also been used by several works in the literature.48–50 In this work, we assigned the point charges in an independent way from the dispersion force field parameters. Before applying the generic force field for MOFs33 and the DDEC charge assignment to the present problem, we first test the reliability of the force field through the calculation of the adsorption isotherm for a known MOF, the Co–MOF-74, and compare our simulated result with the available experimental data.21 The hydrogen adsorption isotherm of the Co–MOF-74 framework was calculated at the temperature of 77 K and the pressure below 6 bar. Fig. 9a shows this result together with the experimental data. We found that the calculated excess H2 adsorption isotherms using the generic force field and the DDEC charge assignment are in good agreement with the experimental result at low pressures. Although there is a discrepancy at high pressures, the behavior of the isotherm is well reproduced by our scheme. Besides, to determine the reliability of the charge assignment while remaining the other force field parameters, we simulated the hydrogen adsorption isotherms for the Co–MOF-74 with the atomic point charges obtained by the DDEC charge calculation of our group and the charges (available for Co–MOF-74) taken from the library of RASPA, see Table S2.† Fig. 9b shows that both results are in excellent agreement. Because the Co–MIL-88A and the Co–MOF-74 have the same characteristics such as having unsaturated metal sites, hexagonal unit cell, and containing the same types of elements, i.e., Co, C, O, and H. Therefore, we use the tested force field for the Co–MIL-88A. | ||
| Fig. 9 Excess hydrogen uptake for Co–MOF-74 at 77 K: (a) GCMC simulation with the generic force field for MOFs and the DDEC charge assignment (solid square) and the experimental data (solid circle) extracted with permission from ref. 21. Copyright 2008 American Chemical Society; (b) GCMC simulation with the DDEC charges of this work and the charges taken from the library of RASPA. | ||
For evaluating the adsorption capacity of H2 in the Co–MIL-88A, we computed the average amount of absolute and excess loadings at the temperatures of 77 K and 298 K, and for pressures up to 100 bar. Fig. 10a shows that the H2 adsorption isotherms at 77 K increase sharply below 5 bar and achieves the maximum value of about 4.0 wt% at about 15 bar for the excess loading but still increases slightly for the absolute loading until 50 bar where the total uptake reaches the value of 4.5 wt%. From these results, we see the H2 uptake in Co–MIL-88A at the cryogenic temperature (77 K) is moderate compared with that of the best MOFs reported up to now, see the recent review papers.11,12 For example, MOF-5 (the MOF was firstly synthesized and was evaluated for hydrogen storage capacity in 2003) has the total uptake with 4.5 wt% at (78 K, 1 bar)51 and 5.6 wt% at (77 K, 100 bar).49 At 77 K, the highest excess H2 storage capacity is 9.95 wt% at 56 bar and the absolute one is 16.4 wt% at 70 bar for NU-100;52 while, the highest total H2 storage capacity is 17.6 wt% (excess 8.6 wt%) at 80 bar for MOF-210.53 Besides, several MOFs were also evaluated with a high H2 uptake of 7.5 wt% at 70 bar for MOF-177,54 2.4 wt% and 4.6 wt% at 31 bar for UiO-66 and UiO-67, respectively.55 The sudden increase of the adsorption isotherm at low pressures implies that the storage is mainly based on the adsorption of H2 with the MOF.
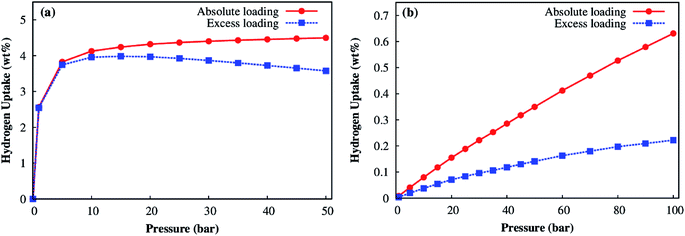 | ||
| Fig. 10 Absolute (red) and excess (blue) adsorption isotherms for the Co–MIL-88A at 77 K (a) and 298 K (b). | ||
At room temperature, the isotherms increase fairly close to a linear function of the pressure, but are not saturated at our highest pressure of 100 bar (Fig. 10b). This result implies that the Co–MIL-88A is very stable and suitable for the hydrogen storage at high pressures. The maximum value for the excess and absolute loadings at 298 K and 100 bar is 0.22 and 0.63 wt%, respectively. The calculated absolute loading is comparable to the experimental data obtained for the best MOFs up to date at the standard condition of 298 K and 100 bar. For examples, the absolute loadings are 2.3 wt% for Be-BTB,56 0.8 wt% for Mg–MOF-74,57 and the excess loadings are 0.62 wt% for MOF-177,54 at 298 K and 100 bar, many MOFs reported up to now also reached the H2 storage capacities of 0.36–0.58 wt%.58
To assess the weight of the electrostatic interaction with respect to the dispersion one, we calculated the hydrogen uptake with and without the assignment of the atomic DDEC charges by our DFT calculations. The information was listed in Table 6, see also Fig. S3 and Tables S3 and S4.† Looking at the last two columns of Table S4,† we found that the electrostatic interaction contributes less than 10% to the overall hydrogen uptakes at the room temperature. Table 6 shows that the contribution of the electrostatic interaction is much more significant at the low temperature than at the room temperature. Simultaneously, the electrostatic contribution decreases as the pressure increases. The dispersion interaction is more dominant than the electrostatic part.
| Pressure (bar) | LJ + Coulomb interaction (wt%) | LJ interaction (wt%) | Coulomb interaction (wt%) | Weight of electrostatic interaction (%) |
|---|---|---|---|---|
| 1 | 2.56 | 1.90 | 0.66 | 25.78 |
| 2 | 3.21 | 2.53 | 0.68 | 21.18 |
| 3 | 3.52 | 2.83 | 0.69 | 19.60 |
| 4 | 3.69 | 3.01 | 0.68 | 18.43 |
| 5 | 3.81 | 3.15 | 0.66 | 17.32 |
| 10 | 4.13 | 3.52 | 0.61 | 14.77 |
| 20 | 4.32 | 3.81 | 0.51 | 11.81 |
| 30 | 4.40 | 3.97 | 0.43 | 9.77 |
| 40 | 4.46 | 4.06 | 0.40 | 8.97 |
| 50 | 4.50 | 4.14 | 0.36 | 8.00 |
Fig. S4† shows that the hydrogen molecules are more concentrated around the hollow than around the ligand and the metal site, which means that the hollow site is the most favorable adsorption place of the hydrogen gas. The average distance from the H2 molecules to the nearest atoms of the MOF, shown in Table S5 in ESI,† was found to be in good agreement with that obtained by the density functional theory calculation, listed in Table 3. These results demonstrated that the used generic force field for MOFs could qualitatively reproduce the observation of the density functional theory results.
4. Conclusions
Our DFT-based results show that the favorable adsorption sites of H2 in Co–MIL-88A MOF is in the order: hollow > ligand > metal side-on > metal end-on, in which the adsorption of H2 is most favorable on the hollow of four oxygen atoms with the binding energy of 13.72 kJ mol−1. This value is greater than that of many MOFs reported so far ∼4–13 kJ mol−1. The interaction between the bonding state of H2 with the s and d orbitals of the Co atoms and the p orbital of the μ3-O atoms favors the adsorption of the H2 molecule at the hollow site. Furthermore, the interaction of H2 with Co–MIL-88A is physisorption. The dispersion force dominates the interaction energy, which binds H2 at the adsorption sites.At 77 K, the excess adsorption isotherm of hydrogen gas in Co–MIL-88A saturates at 15 bar with 4.0 wt%, but the absolute adsorption isotherm still increases slightly up to 50 bar and reach the maximum value of 4.5 wt%. At the room temperature of 298 K, the H2 adsorption isotherms increase strongly upon the increase of the temperature and reach 0.63 and 0.22 wt% for the absolute and excess uptakes at 100 bar, respectively. These achieved results are worthy for hydrogen storage. Further study will be on the enhancement of the H2 storage capacity by substituting metal or linker of MIL-88A.
Conflicts of interest
There are no conflicts of interest to declare.Acknowledgements
This research was funded by Ho Chi Minh City University of Technology – VNU-HCM under grant number TNCS-2015-KHUD-33. One of the authors (Do Ngoc Son) acknowledges the financial support of the Vietnam National Foundation for Science and Technology Development (NAFOSTED) under grant number 103.01-2017.04. We acknowledge the usage of the computer time and software granted by the Institute of Physical Chemistry of Romanian Academy, Bucharest (HPC infrastructure developed under the projects Capacities 84 Cp/I of 15.09.2007 and INFRANANOCHEM 19/01.03.2009).References
- Z. Chang, D.-S. Zhang, Q. Chen and X.-H. Bu, Phys. Chem. Chem. Phys., 2013, 15, 5430–5442 RSC.
- S. Ma and H.-C. Zhou, Chem. Commun., 2010, 46, 44–53 RSC.
- M. Bastos-Neto, C. Patzschke, M. Lange, J. Möllmer, A. Möller, S. Fichtner, C. Schrage, D. Lässig, J. Lincke, R. Staudt, H. Krautscheid and R. Gläser, Energy Environ. Sci., 2012, 5, 8294–8303 CAS.
- B. Panella and M. Hirscher, in Handbook of Hydrogen storage: New materials for future energy, ed. M. Hirscher, Wiley-VCH Verlag GmbH & Co. KGaA, Weinheim, 2010, pp. 39–62 Search PubMed.
- K. Mazloomi and C. Gomes, Renewable Sustainable Energy Rev., 2012, 16, 3024–3033 CrossRef CAS.
- J. Goldsmith, A. G. Wong-Foy, M. J. Cafarella and D. J. Siegel, Chem. Mater., 2013, 25, 3373–3382 CrossRef CAS.
- D. A. Gomez and G. Sastre, Phys. Chem. Chem. Phys., 2011, 13, 16558–16568 RSC.
- D. Zhao, D. Yuan and H. Zhou, Energy Environ. Sci., 2008, 1, 222–235 CAS.
- J. Sculley, D. Yuan and H. Zhou, Energy Environ. Sci., 2011, 4, 2721–2735 CAS.
- H. W. Langmi, J. Ren, B. North, M. Mathe and D. Bessarabov, Electrochim. Acta, 2014, 128, 368–392 CrossRef CAS.
- M. P. Suh, H. J. Park, T. K. Prasad and D.-W. Lim, Chem. Rev., 2012, 112, 782–835 CrossRef CAS PubMed.
- T. T. T. Huong, P. N. Thanh, N. T. X. Huynh and D. N. Son, VNU Journal of Science: Mathematics-Physics, 2016, 32, 67–85 Search PubMed.
- L. J. Murray, M. Dinca and J. R. Long, Chem. Soc. Rev., 2009, 38, 1294–1314 RSC.
- D. Sahu, P. Mishra, S. Edubilli, A. Verma and S. Gumma, J. Chem. Eng. Data, 2013, 58, 3096–3101 CrossRef CAS.
- P. Horcajada, F. Salles, S. Wuttke, T. Devic, D. Heurtaux, A. Vimont, M. Daturi, O. David, E. Magnier, N. Stock, Y. Filinchuk, D. Y. Popov, C. Riekel, G. Férey, C. Serre, G. Maurin and D. Popov, J. Am. Chem. Soc., 2011, 133, 17839–17847 CrossRef CAS PubMed.
- S. S. Han, J. L. Mendoza-Cortes and W. A. Goddard, Chem. Soc. Rev., 2009, 38, 1460–1476 RSC.
- J. G. Vitillo, L. Regli, S. Chavan, G. Ricchiardi, G. Spoto, P. D. C. Dietzel, S. Bordiga and A. Zecchina, J. Am. Chem. Soc., 2008, 130, 8386–8396 CrossRef CAS PubMed.
- A. C. McKinlay, J. F. Eubank, S. Wuttke, P. S. Wheatley, P. Bazin, J.-C. Lavalley, M. Daturi, A. Vimont, G. De Weireld, P. Horcajada, C. Serre and R. E. Morris, Chem. Mater., 2013, 25, 1592–1599 CrossRef CAS.
- S. Wongsakulphasatch, W. Kiatkittipong, J. Saupsor, J. Chaiwiseshphol, P. Piroonlerkgul, V. Parasuk and S. Assabumrungrat, Greenhouse Gases: Sci. Technol., 2016, 12, 1–12 Search PubMed.
- D. Gygi, E. D. Bloch, J. A. Mason, M. R. Hudson, M. I. Gonzalez, R. L. Siegelman, T. A. Darwish, W. L. Queen, C. M. Brown and J. R. Long, Chem. Mater., 2016, 28, 1128–1138 CrossRef CAS.
- W. Zhou, H. Wu and T. Yildirim, J. Am. Chem. Soc., 2008, 130, 15268–15269 CrossRef CAS PubMed.
- J. W. Yoon, Y. Seo, Y. K. Hwang, J. Chang, H. Leclerc, S. Wuttke, P. Bazin, A. Vimont, M. Daturi, E. Bloch, P. L. Llewellyn, C. Serre, P. Horcajada, J. Greneche, A. E. Rodrigues and G. Ferey, Angew. Chem., Int. Ed., 2010, 49, 5949–5952 CrossRef CAS PubMed.
- G. Kresse and J. Furthmüller, Phys. Rev. B, 1996, 54, 11169–11186 CrossRef CAS.
- J. P. Perdew, K. Burke and M. Ernzerhof, Phys. Rev. Lett., 1996, 77, 3865–3868 CrossRef CAS PubMed.
- J. P. Perdew, K. Burke and M. Ernzerhof, Phys. Rev. Lett., 1997, 78, 1396 CrossRef CAS.
- P. E. Blochl, Phys. Rev. B, 1994, 50, 17953–17979 CrossRef.
- G. Kresse and D. Joubert, Phys. Rev. B, 1999, 59, 1758–1775 CrossRef CAS.
- J. D. Pack and H. J. Monkhorst, Phys. Rev. B, 1976, 13, 5188–5192 CrossRef.
- M. Methfessel and A. T. Paxton, Phys. Rev. B, 1989, 40, 3616–3621 CrossRef CAS.
- P. E. Blochl, O. Jepsen and O. K. Andersen, Phys. Rev. B, 1994, 49, 16223–16233 CrossRef CAS.
- T. A. Manz and D. S. Sholl, J. Chem. Theory Comput., 2012, 8, 2844–2867 CrossRef CAS PubMed.
- W. Tang, E. Sanville and G. Henkelman, J. Phys.: Condens. Matter, 2009, 21, 84204 CrossRef CAS PubMed.
- D. Dubbeldam, S. Calero, D. E. Ellis and R. Q. Snurr, Mol. Simul., 2016, 42, 81–101 CrossRef CAS.
- M. Dion, H. Rydberg, E. Schröder, D. C. Langreth and B. I. Lundqvist, Phys. Rev. Lett., 2004, 92, 246401 CrossRef CAS PubMed.
- F. D. Murnaghan, Finite deformation of an elastic solid, Wiley, New York, 1951 Search PubMed.
- S. Surble, C. Serre, C. Mellot-Draznieks, F. Millange and G. Ferey, Chem. Commun., 2006, 284–286 RSC.
- T. Sagara, J. Klassen and E. Ganz, J. Chem. Phys., 2004, 121, 12543–12547 CrossRef CAS PubMed.
- T. Mueller and G. Ceder, J. Phys. Chem. B, 2005, 109, 17974–17983 CrossRef CAS PubMed.
- D. a. Gomez, A. F. Combariza and G. Sastre, Phys. Chem. Chem. Phys., 2009, 11, 9250–9258 RSC.
- T. B. Lee, D. Kim, D. H. Jung, S. B. Choi, J. H. Yoon, J. Kim, K. Choi and S. H. Choi, Catal. Today, 2007, 120, 330–335 CrossRef CAS.
- S. S. Han, W. Q. Deng and W. A. Goddard, Angew. Chem., Int. Ed., 2007, 46, 6289–6292 CrossRef CAS PubMed.
- X. Solans-Monfort, M. Sodupe, C. M. Zicovich-wilson, E. Gribov, G. Spoto, C. Busco and P. Ugliengo, J. Phys. Chem. B, 2004, 108, 8278–8286 CrossRef CAS.
- S. Satyapal, J. Petrovic, C. Read, G. Thomas and G. Ordaz, Catal. Today, 2007, 120, 246–256 CrossRef CAS.
- D. A. Gomez, J. Toda and G. Sastre, Phys. Chem. Chem. Phys., 2014, 16, 19001–19010 RSC.
- N. Nijem, J.-F. Veyan, L. Kong, K. Li, S. Pramanik, Y. Zhao, J. Li, D. Langreth and Y. J. Chabal, J. Am. Chem. Soc., 2010, 132, 1654–1664 CrossRef CAS PubMed.
- R. M. Feenstra, N. Srivastava, Q. Gao, M. Widom, B. Diaconescu, T. Ohta, G. L. Kellogg, J. T. Robinson and I. V. Vlassiouk, Phys. Rev. B, 2013, 87, 041406(R) CrossRef.
- R. Hoffmann, Rev. Mod. Phys., 1988, 60, 601–628 CrossRef CAS.
- C. E. Wilmer, R. Q. Snurr and M. Carlo, Chem. Eng. J., 2011, 171, 775–781 CrossRef CAS.
- Q. Yang and C. Zhong, J. Phys. Chem. B, 2006, 110, 655–658 CrossRef CAS PubMed.
- D. Fairen-Jimenez, Y. J. Colón, O. K. Farha, Y.-S. Bae, J. T. Hupp and R. Q. Snurr, Chem. Commun., 2012, 48, 10496 RSC.
- N. L. Rosi, J. Eckert, M. Eddaoudi, D. T. Vodak, J. Kim, M. O'Keeffe and O. M. Yaghi, Science, 2003, 300, 1127–1129 CrossRef CAS PubMed.
- O. K. Farha, A. Ö. Yazaydın, I. Eryazici, C. D. Malliakas, B. G. Hauser, M. G. Kanatzidis, S. T. Nguyen, R. Q. Snurr and J. T. Hupp, Nat. Chem., 2010, 2, 944–948 CrossRef CAS PubMed.
- H. Furukawa, N. Ko, Y. B. Go, N. Aratani, S. B. Choi, E. Choi, A. O. Yazaydin, R. Q. Snurr, M. O'Keeffe, J. Kim and O. M. Yaghi, Science, 2010, 329, 424–428 CrossRef CAS PubMed.
- Y. Li and R. T. Yang, Langmuir, 2007, 23, 12937–12944 CrossRef CAS PubMed.
- S. Chavan, J. G. Vitillo, D. Gianolio, O. Zavorotynska, B. Civalleri, S. Jakobsen, M. H. Nilsen, L. Valenzano, C. Lamberti, K. P. Lillerud and S. Bordiga, Phys. Chem. Chem. Phys., 2012, 14, 1614–1626 RSC.
- W. X. Lim, A. W. Thornton, A. J. Hill, B. J. Cox, J. M. Hill and M. R. Hill, Langmuir, 2013, 29, 8524–8533 CrossRef CAS PubMed.
- K. Sumida, C. M. Brown, Z. R. Herm, S. Chavan, S. Bordiga and J. R. Long, Chem. Commun., 2011, 47, 1157–1159 RSC.
- S. J. Yang, J. H. Im, H. Nishihara, H. Jung, K. Lee, T. Kyotani and C. R. Park, J. Phys. Chem. C, 2012, 116, 10529–10540 CAS.
Footnote |
| † Electronic supplementary information (ESI) available: The charge density difference for H2 at the hollow site, the electronic density of state of H2 and the μ3-O atoms, the density of adsorbed hydrogen molecules, the vibrational frequency of the adsorbed H2, the contribution of the electrostatic interaction with respect to the dispersion one, the average distance of H2 molecule and the nearest atoms, and the structural coordinates of the optimized Co–MIL-88A. See DOI: 10.1039/c7ra05801b |
| This journal is © The Royal Society of Chemistry 2017 |

