DOI:
10.1039/C7RA05696F
(Paper)
RSC Adv., 2017,
7, 37487-37494
Remarkable lignin degradation in paper wastewaters over Fe2O3/γ-Al2O3 catalysts using the catalytic wet peroxide oxidation method†
Received
23rd May 2017
, Accepted 17th July 2017
First published on 28th July 2017
Abstract
Heterogeneous catalytic wet peroxide oxidation (CWPO) has been found to be one of the most effective approaches for the degradation of toxic and paper factory wastewater. Fe2O3/γ-Al2O3 catalysts were prepared by an impregnation method and characterized by X-ray diffraction (XRD), temperature-programmed desorption (TPD), transmission electron microscopy (TEM) and scanning electron microscopy (SEM). The catalytic activity of Fe2O3/γ-Al2O3 for the CWPO of lignin was assessed. The effects of initial solution pH, catalyst dosage, initial concentration of hydrogen peroxide, reaction temperature and initial concentration of lignin on the reactivity of the system were investigated. Higher lignin degradation can be achieved under not only under acidic but also neutral and slightly alkaline conditions. Under initial conditions of pH = 9, T = 348 K, 6 g L−1 catalyst, 6.396 mM hydrogen peroxide and 100 mg L−1 lignin, 87% lignin degradation and 86% total organic content (TOC) removal were achieved in 60 min. The negligible amount of leaching Fe ions found in solution was measured by inductively coupling plasma-atomic emission spectra (ICP-AES).
1. Introduction
Recently, environmental problems have attracted much attention, and many stringent regulations have been published to restrict harmful industry effluents at a low level. The paper manufacturing process produces much wastewater, which incorporates quantities of lignin, a phenolic derivative with high colority and total organic content (TOC).1,2 Lignin is an irregular tri-dimensional polymer composed of aromatic/phenolic units and is resistant to microbial attack3,4, although some methods for the degradation of lignin have previously been reported.5 After secondary treatment using a conventional microbial method, most TOC is removed; however, stubborn paper factory lignin and its derivatives still remain, resulting in severe environmental pollution.6,7 In recent years, advanced oxidation processes (AOPs)8 with Fenton's reagent (Fe2+/Fe3+/H2O2) as an oxidatant9 have been used for the degradation of a great variety of organic compounds.10 However, homogenous Fenton systems have some well-known drawbacks, including limited pH range, catalyst deactivation and the production of iron-containing sludge that requires further disposal.11 Many researchers have recently reported on the use of heterogeneous catalysts containing hydrogen, including the heterogeneous catalytic wet peroxide oxidation (CWPO) process, as an alternative. Heterogeneous catalytic oxidation systems provide easy separation and recovery of the catalyst from the treated wastewater and avoid the drawbacks of the Fenton's reagent, primarily difficulties in recycling. Many materials predominantly containing iron as the precursor, and supported or intercalated on or in oxides, clays, zeolite and polymers, have been proposed for the removal of various organic compounds, such as phenols,12,13 dyes,14,15 2-chlorophenol,16 atrazine,17 methyl t-butyl ether (MTBE)18 and hydrogen peroxide. No papers have been published in respect of the catalytic oxidation of high-molecular lignin obtained from the Kraft digestion of wheat straw in such heterogeneous catalytic oxidation systems. The main objective of this research was to evaluate the catalytic activity of Fe2O3/γ-Al2O3 catalysts for the CWPO of lignin in an aqueous solution. The influencing factors, such as temperature, catalyst dosage, H2O2 concentration and pH of the solution, were investigated. The reactivity of this process was monitored in terms of lignin degradation and TOC removal.
2. Experimental
2.1. Materials
γ-Al2O3 (296.8 m2 g−1) was purchased from Tianjin Chemical Research and Design Institute, China. Sulfuric acid was used in the lignin precipitation, and then the precipitate was washed with deionized water and dried at room temperature.19 Lignin aqueous solutions were prepared by dissolving the obtained lignin in 0.05 M NaOH solution. 30 wt% hydrogen peroxide aqueous solutions were used as an oxidant.
2.2. Catalyst preparation
Fe2O3/γ-Al2O3 catalysts were prepared by the impregnation method with Fe(NO3)2 as the precursor and γ-Al2O3 as the carrier. The mean diameter of the alumina particle was in the range 124–150 μm. Alumina was impregnated with the Fe(NO3)2 solution via the wet procedure for 12 h under room conditions. Next, the particles were dried at 353 K for 10 h, and then calcined in a furnace at 673 K for 4 h to obtain Fe2O3/γ-Al2O3 catalyst containing 15 wt% Fe component.
2.3. Characterization of the catalyst
Characterization of the samples was performed using various techniques. X-ray powder diffraction (XRD) data were acquired on a Bruker AXS D8-Focus diffractometer using Cu-Kα radiation. The data were collected in a 2θ range of 10° to 80° with a scanning speed of 4° min−1. The morphology and microstructure were examined on Transmission 100 Electron Microscope (TEM) operating at 200 kV coupled with energy-dispersive X-ray spectroscopy (EDS), and scanning electron microscopy (SEM) was performed using a Hitachi Limited US-1510 system. The acidity of the catalyst samples was measured in the temperature range 323–823 K by measuring the temperature-programmed desorption of ammonia (NH3-TPD).
2.4. Procedures and analysis
For the catalytic oxidation of lignin, a defined concentration of simulated lignin wastewater was poured into a 500 mL three-necked round-bottomed glass reactor which was equipped with continuous mechanical stirring for each test. In each trial, 250 mL lignin solution was added to the reactor. During the reaction process, 5 mL samples were taken out for analysis every 15 min. The samples were centrifuged to remove the solids. Lignin concentration was determined using an ultraviolet (UV)/visible (Vis) spectrophotometer (Shanghai Spectrum, SP-2102UV) (Fig. S1†). Hydrogen peroxide conversion was determined by iodometric titration. A Beer-Lambert law was established to correlate the absorbency at 280 nm to lignin concentration.16 TOC was determined using a Sievers Innovox Laboratory TOC analyzer (General Electric Analytical Instruments).
The degradation of lignin was determined in terms of the change in concentration of lignin and the reduction in TOC. The percentage degradation was calculated as follows (eqn (1)):
| | |
Degradation ratio (%) = (C0 − C)/C0 × 100
| (1) |
where
C0 = initial concentration of lignin in solution,
C = concentration of lignin after degradation.
TOC removal was calculated as follows (eqn (2)):
| | |
TOC removal (%) = (TOC0 − TOC)/TOC0 × 100
| (2) |
where TOC
0 = initial TOC of lignin solution, TOC = TOC of lignin solution after degradation. The concentration of total iron dissolved in the solution was measured by inductively coupling plasma-atomic emission spectra (ICP-AES) (PerkinElmer 5300DV).
The effect of different Fe2O3 loadings (10%, 15%, 20%), initial pH value (pH 3–11), H2O2 concentration (0.799 mmol L−1, 1.599 mmol L−1, 6.396 mmol L−1, 9.594 mmol L−1), catalyst dosage/catalyst loading (10–60 mg) and initial lignin concentration (25–100 mg L−1) on the catalytic degradation reaction were investigated.
3. Results and discussion
3.1. Catalyst characterization
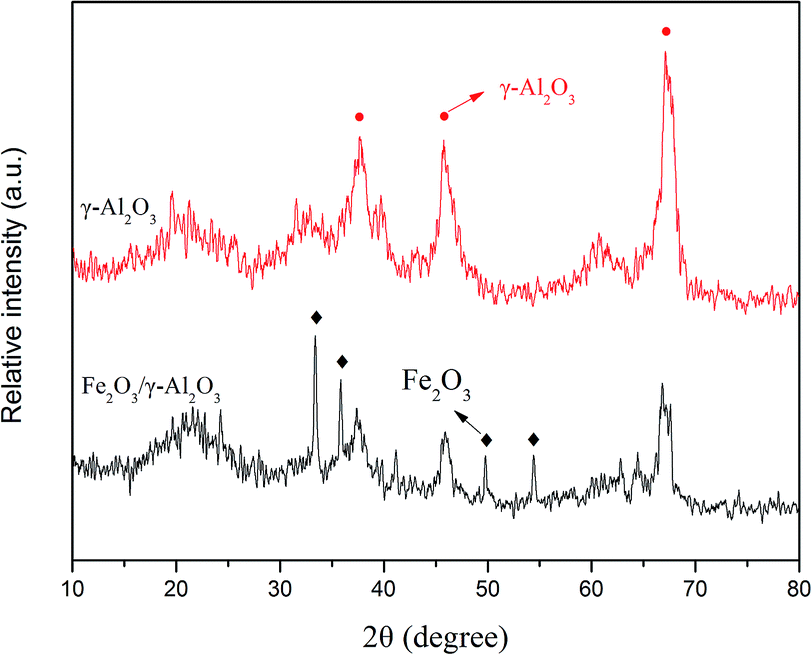
The crystallographic structures of the γ-Al2O3 support and Fe2O3/γ-Al2O3 catalyst samples were investigated by XRD patterns. Two typical diffraction peaks corresponding to γ-Al2O3 are observed in Fig. 1. Both of the XRD patterns show diffraction peaks at 2θ values of 37.54°, 45.67° and 66.60°, which were indexed to the diffraction peaks corresponding to the (311), (400) and (440) crystal planes, respectively, matching well with the standard phase of the γ-Al2O3 support. For the Fe2O3-loaded γ-Al2O3 catalyst, four strong diffraction peaks at 2θ values of 33.28°, 35.74°, 49.50° and 54.23° were indexed to the (104), (110), (024) and (116) crystal planes, respectively. The structure of the γ-Al2O3 support remained intact after the modification treatment, whereas a decrease in the intensity of the γ-Al2O3 diffraction peaks was observed compared with the γ-Al2O3 support, which could result from the higher X-ray absorption coefficient of the iron compounds.
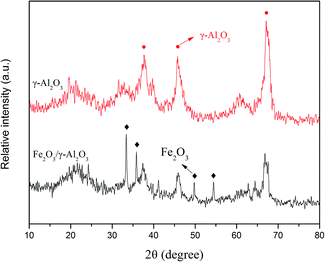 |
| | Fig. 1 XRD patterns of the catalysts. | |
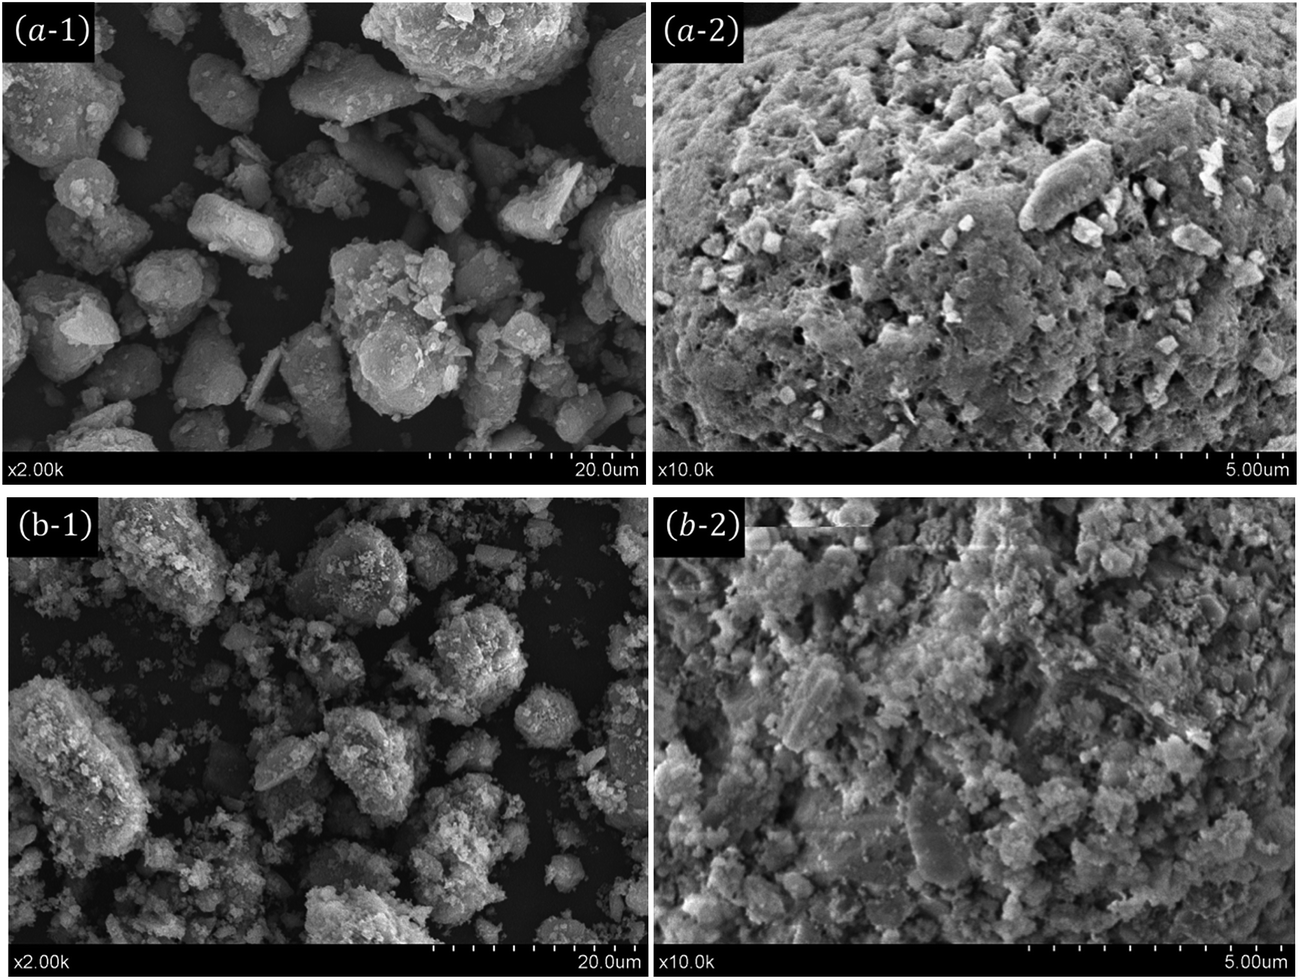
The morphology and structure of the synthesized materials were investigated using an SEM micrograph. Fig. 2 shows the SEM images of the γ-Al2O3 and Fe2O3/γ-Al2O3 catalyst. The micrograph of γ-Al2O3 exhibits a spherical shape ascribed to the γ-Al2O3 support. As can be seen in Fig. 2(b-1) and (b-2), Fe2O3 particles were loaded on the surface of γ-Al2O3. Moreover, the sphericity, which is compared with that of γ-Al2O3, hardly changes. In addition, the SEM images indicate that crystalline Fe2O3 was uniformly dispersed on the γ-Al2O3 support. The SEM images are consistent with the results of the XRD analysis.
 |
| | Fig. 2 SEM of image of catalysts: (a) γ-Al2O3. (b) Fe2O3/γ-Al2O3. | |
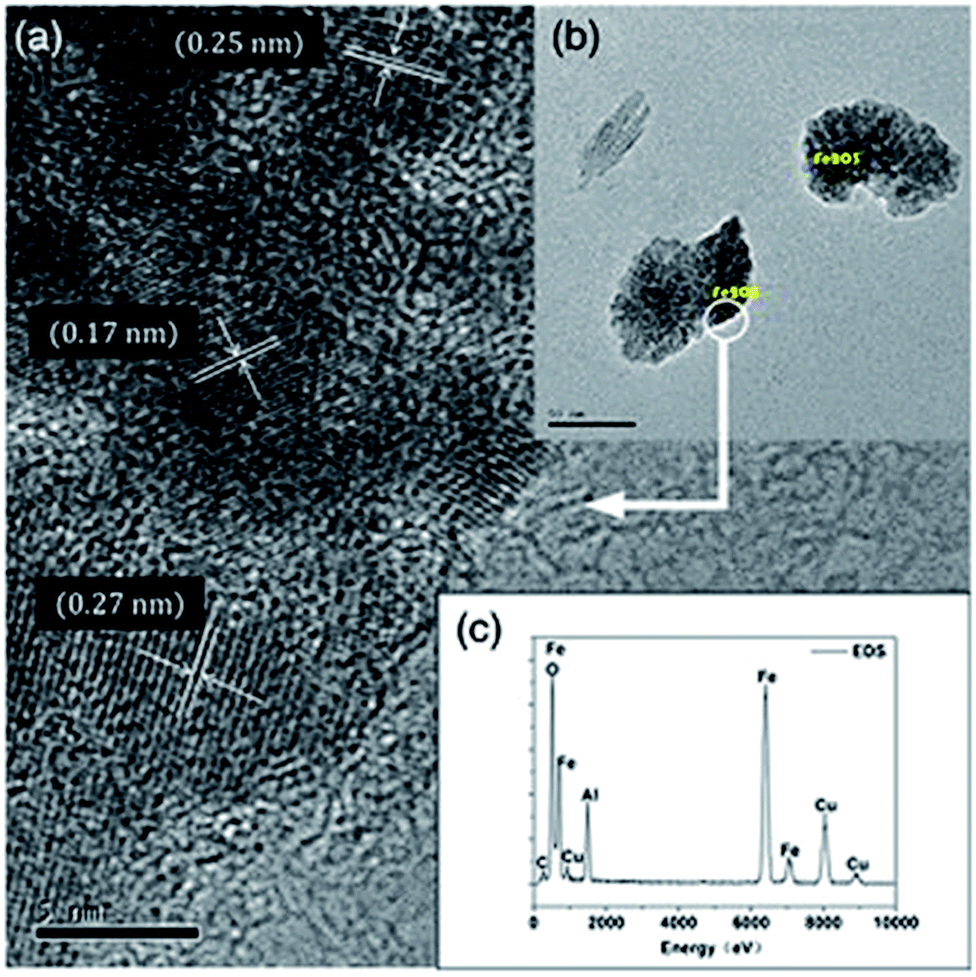
Fig. 3 shows the micrographs obtained by TEM for the Fe2O3/γ-Al2O3 catalyst. From the HR-TEM image (Fig. 3(a)), the lattice fringes of Fe2O3/γ-Al2O3 were clear. The d-spacing of 0.25 nm is attributed to the α-Fe2O3 (110) crystallite plane,20 and the d-spacing of 0.27 nm corresponds to the α-Fe2O3 (104) crystallite plane.21 These observations from HR-TEM were consistent with the results of the XRD analysis. The TEM image (Fig. 3(b)) indicated that Fe2O3/γ-Al2O3 exhibited a certain degree of agglomeration. In addition, the EDS confirmed the existence of Fe and Al, and the results provide evidence of the presence of Cu (Fig. 3(c)).
 |
| | Fig. 3 (a) HR-TEM image of Fe2O3/γ-Al2O3. (b) TEM image of Fe2O3/γ-Al2O3. (c) EDS of Fe2O3/γ-Al2O3. | |
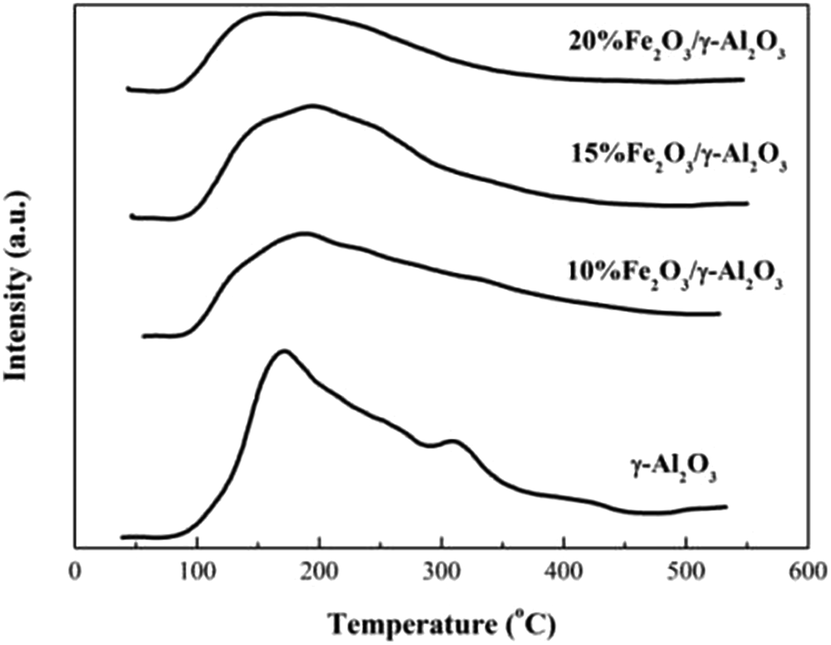
The NH3-TPD profiles are displayed in Fig. 4. In general, the overall NH3-desorption peak area decreases with increasing Fe2O3 loading. This is mainly due to the fact that Fe2O3 can cover some of the acid sites on the support surface. However, in comparison with the Al2O3 support, the peak which was attributed to the weak acid site is moving in the direction of higher temperature for the Fe2O3/Al2O3 catalyst. The weak acid sites continue increasing with the addition of 10, 15 and 20% wt% Fe2O3. When the loading reaches 15 wt%, the desorption peak area corresponding to the weak acid center is largest. Moreover, the peak which was attributed to the weak acid site is moving in the direction of higher temperature. In comparison with other catalysts, when the load is up to 15 wt%, the total acid amount and the acidic strength are highest. Therefore, it is clear that the loading of Fe2O3 not only reduces the surface area of the Al2O3 support, but also modifies the surface acid properties, since Fe2O3 interacts differently with the acid sites with different strengths. The modification of Al2O3 acidity is due to the covalent bond formation between the –OH surface group and the Fe-intermediate during preparation. Therefore, the introduction of the metal/metal oxides results in modulating the surface acidity.
 |
| | Fig. 4 NH3-TPD patterns of bare Al2O3 and Fe2O3/Al2O3 catalysts. | |
3.2. Lignin oxidation test
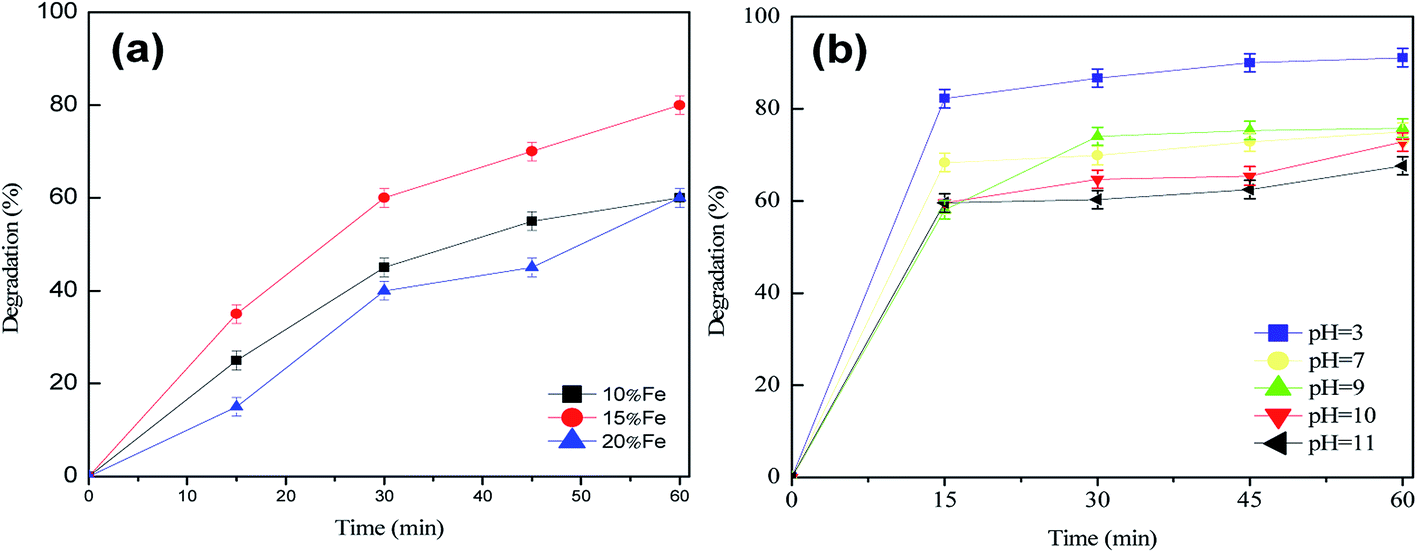
3.2.1. Effects of load. In order to investigate the effect of loading, experiments were carried out by varying the loading dosages from 10 wt% to 20 wt% for a lignin solution of 100 mg L−1 at pH = 9. As shown in Fig. 5(a), the degradation rates increase with increasing loading dosage from 10 wt% to 15 wt%, and the degradation reaches a maximum when the loading increases up to 15 wt%. The degradation rates begin decreasing when the loading dosage exceeds 15 wt%. It can be concluded that the activity of the catalyst is highest when the loading is up to 15 wt%. Moreover, as illustrated in the results of the NH3-TPD analysis, the surface acidic strength is strongest when the loading is up to 15 wt%. In conclusion, the results are consistent with the results of the NH3-TPD analysis. Likewise, for the CWPO of the lignin, the activity of the catalyst becomes higher and higher with reinforcing of the surface acidity. In conclusion, when the loading is 15 wt%, the lignin degradation rate (80%) is highest within the 60 min reaction time.
 |
| | Fig. 5 (a) Effects of loading on the degradation of lignin (catalyst dosage = 6 g L−1; concentration of H2O2 = 6.396 mM; concentration of lignin, 100 mg L−1; pH = 9; T = 348 K). (b) Effect of initial pH on the degradation of lignin (catalyst dosage = 6 g L−1; concentration of H2O2 = 6.396 mM; concentration of lignin = 100 mg L−1; T = 348 K). | |
3.2.2. Effects of reaction system pH. Wastewater pH is a very important factor in the degradation of the organic contaminants in AOP systems. It is well known that the most effective pH range for the Fenton reaction is pH = 2–4. Makhotkina et al.7 also found that 25% lignin degradation was reached under acidic conditions (pH = 3–4) in a heterogeneous CWPO of lignin solutions using the FeZSM-5 catalyst. In slightly alkaline solutions, lignin degradation was only about 10% at pH = 9.0, and no lignin oxidation was observed at pH = 10.0. The authors proposed that H2O2 decomposes on zeolite iron sites without formation of ˙OH radicals in strong alkaline medium. In order to investigate the effects of pH on the lignin degradation in the presence of an Fe2O3/γ-Al2O3 catalyst (4 g L−1), several CWPO experiments were conducted on a lignin solution of 100 mg L−1 at an initial solution pH range of 3–11. The results are shown in Fig. 5(b). As can be seen, the degradation of lignin is maximal at pH = 3 and 90% lignin is degraded in 60 min. The lignin degradation rates are in the range 70–73% at the different initial pHs, except for pH = 11, where the degradation rate is little lower. Therefore, this catalyst can also degrade lignin effectively from neutral up to slightly alkaline environments.
3.2.3. Effects of H2O2 concentration. The concentration of H2O2 plays a very important role in the generation of ˙OH radicals. The degradation rate for organic contaminants increases with hydrogen peroxide concentration until a critical concentration is reached.22 Above this critical concentration, the degradation rate for organic compounds decreases as result of a scavenging effect, according to the reaction shown in eqn (3):| | |
H2O2 + ˙OH → HO2˙ + H2O
| (3) |
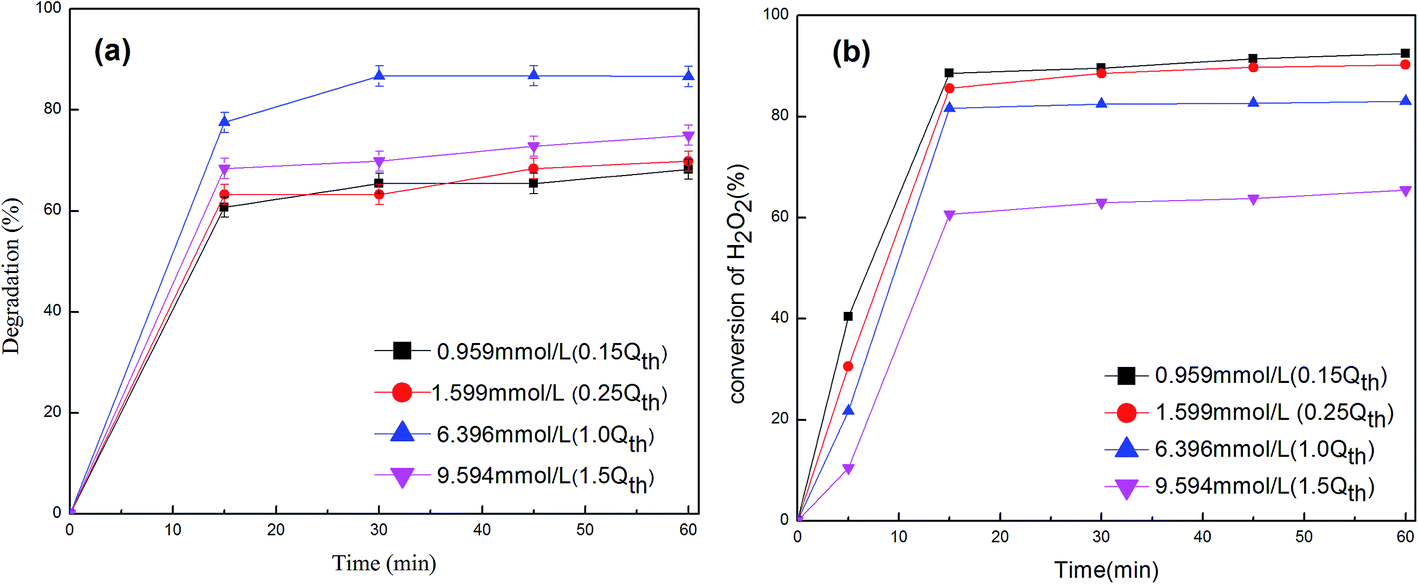
Generally, HO2˙ radicals are less active than ˙OH radicals and do not play any important role in the degradation of organic compounds compared with ˙OH radicals. Fig. 6(a) shows that lignin degradation rates increase with H2O2 concentration from 0.799 mM to 6.396 mM, then decrease with further increases in H2O2 concentration. This means the critical concentration of H2O2 is 6.396 mM for the degradation of 100 mg L−1 lignin solution in the presence of Fe2O3/γ-Al2O3 catalyst.
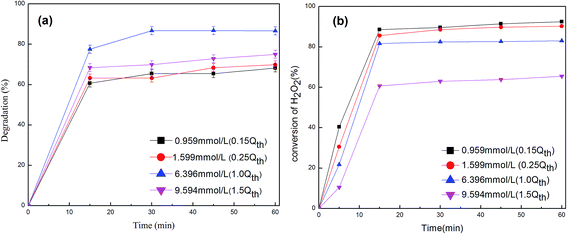 |
| | Fig. 6 (a) Effect of oxidant concentration on degradation of lignin (catalyst dosage 6 g L−1; concentration of lignin 100 mg L−1; pH = 9; T = 348 K). (b) Conversion of H2O2 on the degradation of lignin (catalyst dosage 6 g L−1; concentration of lignin 100 mg L−1; pH = 9; T = 348 K). | |
The effective utilization (i.e., the useful fraction of H2O2 that contributes to degrade organic contaminates) is a key factor in the cost of the CWPO process.23 For this reason, high degradation of organic contaminates with as little H2O2 as possible is preferred. The selectivity of H2O2 is given by eqn (4):
| |
 | (4) |
The theoretical H2O2 consumption needed for the removal of obtained TOC conversion can be estimated17 according to the following reaction (eqn (5)):
| | |
C + 2H2O2 → CO2 + 2H2O
| (5) |
Selectivity was used to measure the effective utilization of H2O2. The selectivity is always below 100%, which means that there is some hydrogen peroxide decomposition useless to oxygen. Fig. 6(b) shows conversion of different concentrations of H2O2 on the process degradation of lignin. The conversion of H2O2 is almost complete in 15 min, and conversion decreases with increasing hydrogen peroxide concentration. The highest selectivity of H2O2 achieves 87% in 60 min with 6.396 mol L−1 of initial H2O2 concentration. This shows that higher initial H2O2 concentrations may not benefit degradation of organic contaminates and also increase the economic cost.
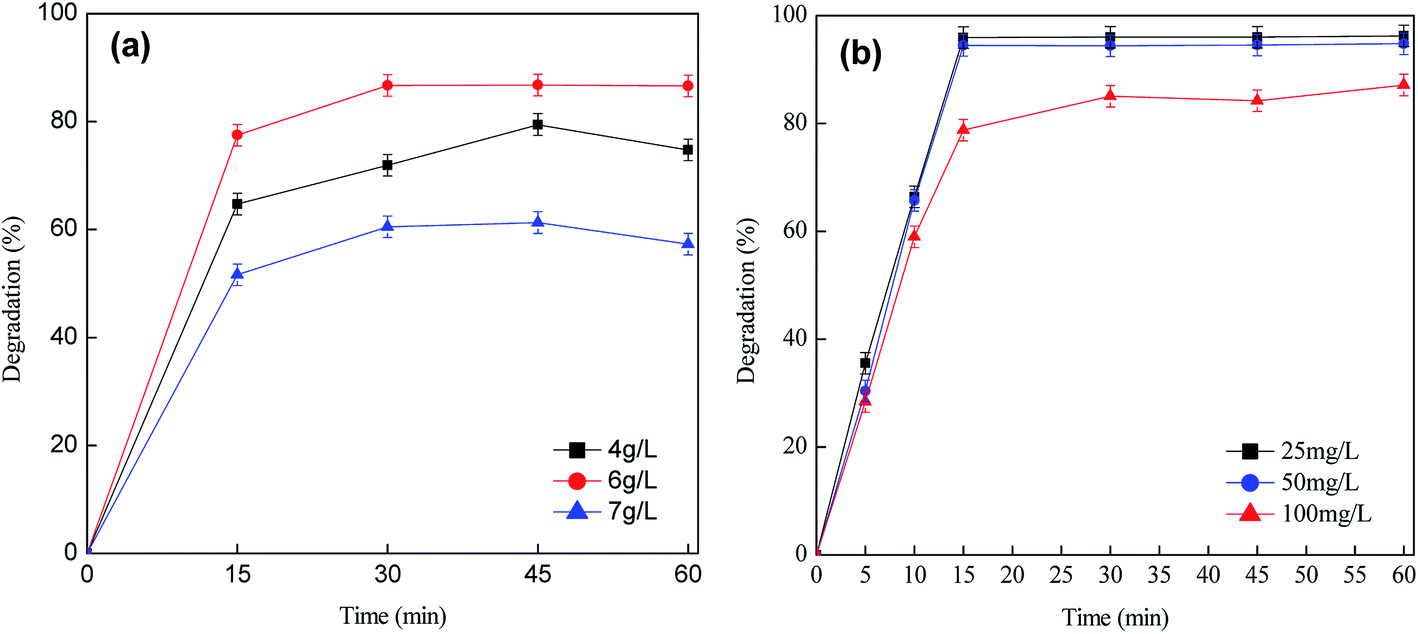
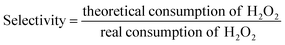
3.2.4. Effects of catalyst dosage. In order to investigate the effect of catalyst dosage, experiments were carried out by varying the catalyst dosage from 4 g L−1 to 7 g L−1 for a lignin solution of 100 mg L−1 at pH = 9. As shown in Fig. 7(a), degradation increases with increasing catalyst dosage from 4 g L−1 to 6 g L−1, reaching a maximum when the catalyst loading increases up to 6 g L−1. The blank test shows that the catalyst has a slight adsorption (Fig. S2†). The degradation rates begin decreasing when the catalyst dosage exceeds 6 g L−1. This can be explained by the increase in total active surface area with catalyst dosage; hence an increase in total active sites on the catalyst surface, where ˙OH radicals are formed.24 The degradation rate increases with increasing number of active sites because heterogeneous CWPO is a surface reaction. Lin et al.21 and Valentine et al.25 proposed that the decomposition rates of H2O2 by iron oxide was proportional to the concentration of catalyst and H2O2. However, the degradation rate decreases when the catalyst dosage exceeds the optimum loading. This phenomenon shows that the decomposition rate of H2O2 does not equal the generation rate of ˙OH radical because H2O2 can decompose to water and oxygen on the catalyst surface.26 Huang et al.16 also found that catalytic activity for hydrogen peroxide decomposition followed the sequence: granular ferrihydrite > goethite > hematite. However, hematite exhibited the highest activity in catalyzing 2-chlorophenol oxidation. In addition, the part of catalyst could act as an ˙OH radical scavenger when the catalyst dosage exceeds the optimum loading.
 |
| | Fig. 7 (a) Effect of catalyst dosage on the degradation of lignin (concentration of lignin 100 mg L−1; concentration of H2O2 6.396 mM; pH = 9, T = 348 K). (b) Effect of initial lignin concentration on degradation of lignin (catalyst dosage 6 g L−1; concentration of H2O2 6.396 mM; pH = 9; T = 348 K). | |
3.2.5. Effects of lignin concentrations. Fig. 7(b) illustrates the effect of initial lignin concentration on its degradation. Above 95% lignin degradation was achieved in 15 min with lower lignin concentration (25 mg L−1 and 50 mg L−1), whereas it took 1 h to reach 87% lignin degradation with an initial concentration of lignin of 100 mg L−1. This suggests that effective lignin degradation could be obtained with lower lignin concentration. The increase in initial lignin concentration leads higher system activity (for example, for a reaction time of 15 min, lignin concentration decreases of 77 mg L−1 and 9.7 mg L−1, respectively, were observed for the highest and lowest initial lignin concentration solution).
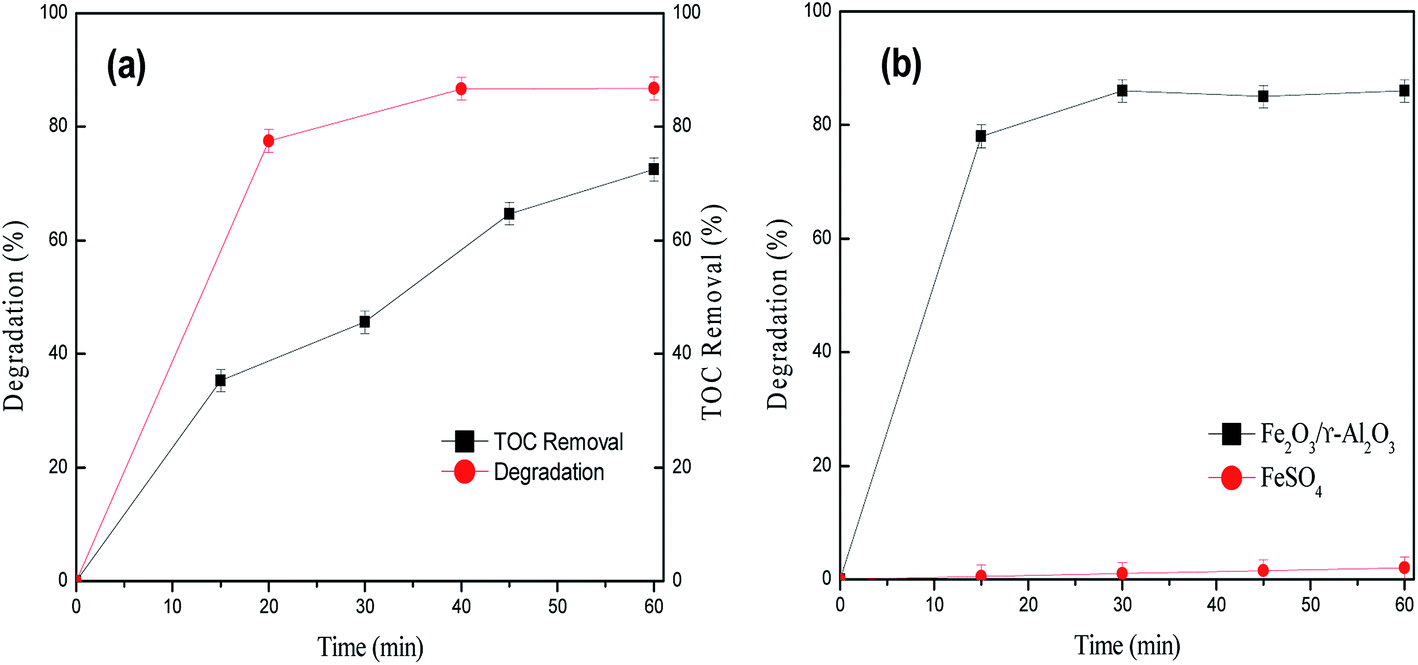
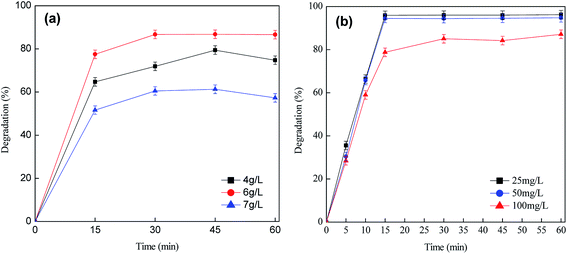
3.2.6. TOC removal and lignin degradation under optimized conditions. It is well known that the AOP of lignin is a very complex process consisting of a number of parallel and series reactions and involving many types of intermediates and final products. These comprise vanillin, coniferyl alcohol, highly oxidized phenols (like syringaldehyde, vanillic acid and palmitic acid4). TOC removal reflects the extent of degradation of organic contaminants. The percentage TOC removal was investigated for 100 mg L−1 lignin solution under optimized conditions (catalyst dosage = 6 g L−1; concentration of H2O2 = 6.396 mM; pH = 9; T = 348 K) as a function of reaction time. The comparison between lignin degradation and TOC removal as a function of reaction time is shown in Fig. 8(a). The TOC removal is slower than the lignin degradation rate because more hydroxyl radicals were produced gradually to oxidize organics in the process of lignin degradation.27,28
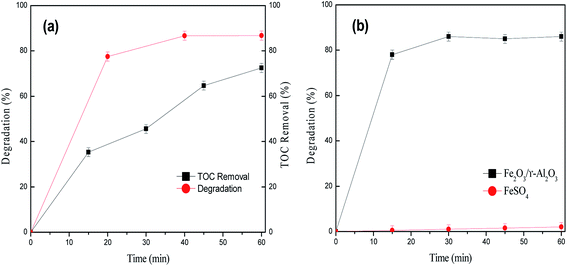 |
| | Fig. 8 (a) Comparison between lignin degradation and TOC removal of lignin (catalyst dosage = 6 g L−1; concentration of H2O2 = 6.396 mM; pH = 9; T = 348 K). (b) Influence of the iron ions leaching on the degradation of lignin (concentration of H2O2 = 6.396 mM; pH = 9; T = 348 K). | |
3.3. Influence of Fe2O3 leached out from the catalysts
The biggest problem with this process is Fe2O3 leached out from the catalysts into solution during heterogeneous CWPO processes.29 We measured the concentration of dissolved Fe in the solution after a 2 h catalytic reaction using the ICP method. The maximum concentration of Fe ions was 0.085 mg L−1 in the solution at various pHs. It is known that the leaching of metal from heterogeneous catalysts depends on the pH; when the pH is above 5, the leaching metal concentration in the solution is negligible.15,22,23 Since leaching of the Fe ion could play an important role in the CWPO of lignin, further catalytic studies were carried out. The activity of FeSO4 as a homogenous catalyst was compared with that of the Fe2O3/γ-Al2O3 heterogeneous catalyst for the catalytic oxidation of lignin under same reaction conditions. The concentration of the Fe ion in the solution was 0.085 mg L−1, which was equivalent to the concentration of the leaching Fe ion from Fe2O3/γ-Al2O3. It can be observed from Fig. 8(b) that only 0.8% lignin degradation is achieved in 1 h, whereas 87% lignin degradation is reached in the presence of Fe2O3/γ-Al2O3. A comparison of these two experiments shows that the homogeneous catalytic reaction formed by leaching of the Fe ion from Fe2O3/γ-Al2O3 has a negligible effect as compared with the heterogeneous catalytic process. This also proves that the oxidation of lignin took place on the catalyst surface via a heterogeneous mechanism.
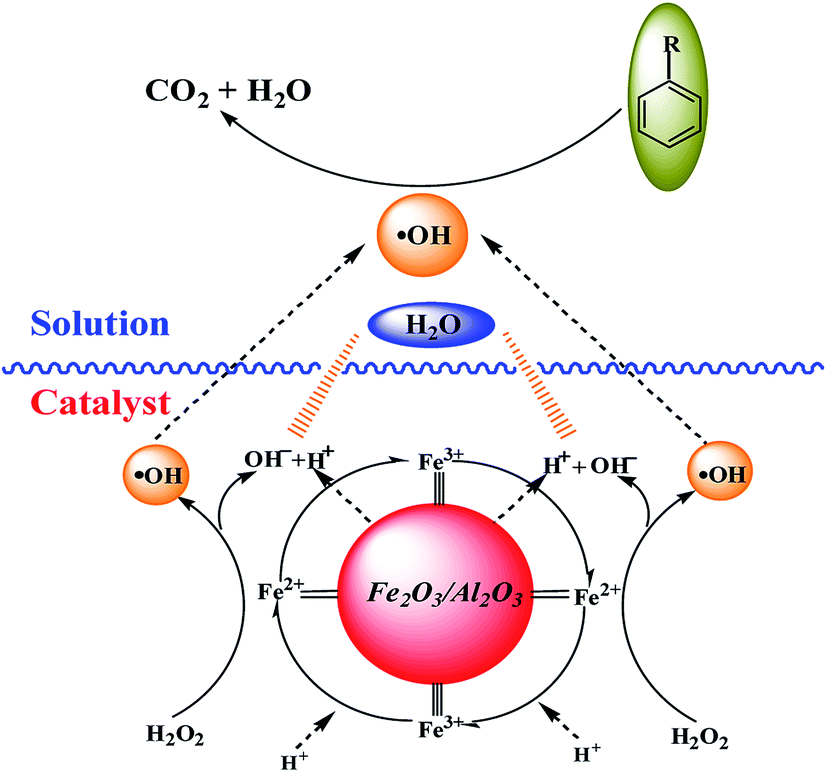
3.4. Mechanism of reaction system
The mechanism of the heterogeneous Fenton-like system has previously been described,24,25 but not the oxidation of lignin. In this mechanism (Fig. 9), ˙OH radicals may be formed in situ on the active sites of the catalyst rather than generating ˙OH radicals in the solution. In addition, the enhanced surface acidity of the catalyst can promote the degradation of lignin in a slightly alkaline environment. Combined with the NH3-TPD analysis, the following reason may be offered for this phenomenon. Because of the surface acidity of the catalyst, which for the alkali lignin solution is adsorbed on the catalyst surface providing an acidic environment, lignin can be degraded under acidic conditions. Further, almost the same degradation rate is achieved whether it is acidic or slightly alkaline lignin wastewater. Therefore, it can be concluded that for Fe2O3/γ-Al2O3, the acid–base property of the solution can not affect the activity. Without pH-range limitation, Fe2O3/γ-Al2O3 is a promising catalyst for catalytic oxidation pulp and paper effluents, because almost all initial effluents are in slightly alkaline conditions.
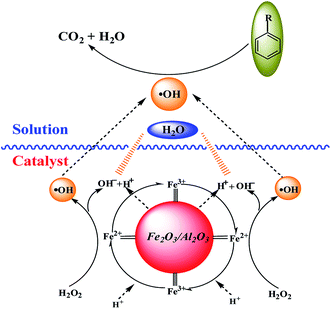 |
| | Fig. 9 Possible mechanism for lignin degradation over Fe2O3/Al2O3 catalyst. | |
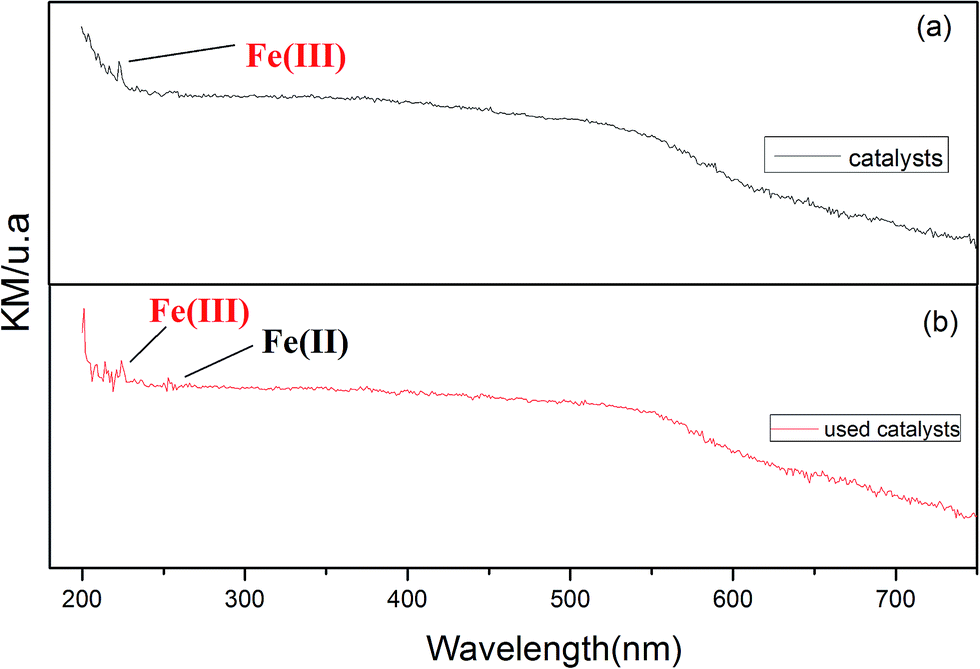
We tested fresh catalyst and catalyst after being subjected to UV-vis, and showed that an extra Fe(II) ion emerges in addition to the Fe(III) ion. This further confirms the conversion between Fe(II) and Fe(III) ions. This further proves the mechanism shown in Fig. 10, and shows that Fe2O3/γ-Al2O3 catalysts can also degrade lignin effectively from neutral up to slightly alkaline environments (pH range 3–11) because of the presence of a few hydrogen ions.
 |
| | Fig. 10 UV-vis of Fe2O3/Al2O3 catalyst (a) fresh (b) after reaction. | |
4. Conclusion
Fe2O3/γ-Al2O3 was prepared and used as the catalyst in the heterogeneous CWPO of lignin under mild conditions (at atmospheric pressure and a temperature of 348 K). From the results of catalyst characterization, crystalline hematite (α-Fe2O3) particles have been formed on the surface of γ-Al2O3 with better dispersion. In addition, from the NH3-TPD covers, when the loading is up to 15 wt%, the total acid amount and acidic strength are highest. There are critical concentrations of catalyst dosage and initial concentration of H2O2 for the degradation of lignin in this system. Above this critical concentration, the degradation of lignin will decrease due to a scavenging effect. Fe2O3/γ-Al2O3 has shown better catalytic activity for the CWPO of lignin in a wider pH range (from pH = 3 to pH = 11), suggesting that this is a promising catalyst for the catalytic oxidation of wastewater containing toxic and paper factory organic compounds in neutral and alkaline environments.
Acknowledgements
We would like to acknowledge the financial support of key Project of Tianjin Research Program of Application Foundation and Advanced Technology (No. 14JCZDJC40600) and National Undergraduate Innovation and Entrepreneurship Training Project (No. 201710057010).
References
- S. K. Kansal, M. Singh and D. Sud, J. Hazard. Mater., 2008, 153, 412–417 CrossRef CAS PubMed.
- A. Raj, M. M. K. Reddy, R. Chandra, H. J. Purohit and A. Kapley, Biodegradation, 2007, 18, 783–792 CrossRef CAS PubMed.
- A. M. Elfadly, I. F. Zeid, F. Z. Yehia, M. M. Abouelela and A. M. Rabie, Fuel Process. Technol., 2017, 163, 1–7 CrossRef CAS.
- M. Ksibi, S. Ben Amor, S. Cherif, E. Elaloui, A. Houas and M. Elaloui, J. Photochem. Photobiol., A, 2003, 154, 211–218 CrossRef CAS.
- M. Niu, Y. Hou, W. Wu and R. Yang, Fuel Process. Technol., 2017, 161, 295–303 CrossRef CAS.
- J. L. Tambosi, M. Di Domenico, W. N. Schirmer, H. J. José and R. de F. Moreira, J. Chem. Technol. Biotechnol., 2006, 81, 1426–1432 CrossRef CAS.
- O. A. Makhotkina, S. V. Preis and E. V. Parkhomchuk, Appl. Catal., B, 2008, 84, 821–826 CrossRef CAS.
- M. Kitis and S. S. Kaplan, Chemosphere, 2007, 68, 1846–1853 CrossRef CAS PubMed.
- J. Li, L. Zhao, L. Qin, X. Tian, A. Wang, Y. Zhou, L. Meng and Y. Chen, Chemosphere, 2016, 146, 442–449 CrossRef CAS PubMed.
- P. Bautista, A. F. Mohedano, J. A. Casas, J. A. Zazo and J. J. Rodriguez, J. Chem. Technol. Biotechnol., 2008, 83, 1323–1338 CrossRef CAS.
- M. Tekbaş, H. C. Yatmaz and N. Bektaş, Microporous Mesoporous Mater., 2008, 115, 594–602 CrossRef.
- K. Fajerwerg and H. Dehellefontaine, Appl. Catal., B, 1996, 10, 229–235 CrossRef.
- J. A. Zazo, J. A. Casas, A. F. Mohedano and J. J. Rodriguez, Appl. Catal., B, 2006, 65, 261–268 CrossRef CAS.
- P. Baldrian, V. Merhautova, J. Gabriel, F. Nerud, P. Stopka, M. Hruby and M. J. Benes, Appl. Catal., B, 2006, 66, 258–264 CrossRef CAS.
- T. L. P. Dantas, V. P. Mendonca, H. J. Jose, A. E. Rodrigues and R. F. P. M. Moreira, Chem. Eng. J., 2006, 118, 77–82 CrossRef CAS.
- H.-H. Huang, M.-C. Lu and J.-N. Chen, Water Res., 2001, 35, 2291–2299 CrossRef CAS PubMed.
- J. A. Botas, J. A. Melero, F. Maeinez and M. I. Pariente, Catal. Today, 2010, 149, 334–340 CrossRef CAS.
- O. A. Makhotkina, S. V. Preis and E. V. Parkhomchuk, Appl. Catal., B, 2008, 84, 821–826 CrossRef CAS.
- A. García, A. Toledano, L. Serrano, I. Egüés, M. González, F. Marín and J. Labidi, Sep. Purif. Technol., 2009, 68, 193–198 CrossRef.
- W.-J. Liu, F.-X. Zeng, H. Jiang, X.-S. Zhang and W.-W. Li, Chem. Eng. J., 2012, 180, 9–18 CrossRef CAS.
- H. Liu, G. Wang, J. Park, J. Wang, H. Liu and C. Zhang, Electrochim. Acta, 2009, 54, 1733–1736 CrossRef CAS.
- C. L. Hsueh, Y. H. Huang, C. C. Wang and C. Y. Chen, Chemosphere, 2005, 58, 1409–1414 CrossRef CAS PubMed.
- K. Maduna Valkaj, A. Katovic, V. Tomašic and S. Zrncevic, Chem. Eng. Technol., 2008, 31, 398–403 CrossRef.
- W. P. Kwan and B. M. Voelker, Environ. Sci. Technol., 2003, 37, 1150–1158 CrossRef CAS PubMed.
- R. L. Valentine and H. C. A. Wang, J. Environ. Eng., 1998, 124, 31–36 CrossRef CAS.
- M. Hermanek, R. Zboril, I. Medrik, J. Pechousek and C. Gregor, J. Am. Chem. Soc., 2007, 129, 10929–10936 CrossRef CAS PubMed.
- K. Huang, Y. Xu, L.-G. Wang and D.-F. Wu, RSC Adv., 2015, 5, 32795–32803 RSC.
- K. Huang, J.-J. Wang, D. Wu and S. Lin, RSC Adv., 2015, 11, 8455–8462 RSC.
- Y. Yan, X.-W. Wu and H.-P. Zhang, Sep. Purif. Technol., 2016, 171, 52–61 CrossRef CAS.
Footnote |
| † Electronic supplementary information (ESI) available. See DOI: 10.1039/c7ra05696f |
|
| This journal is © The Royal Society of Chemistry 2017 |
Click here to see how this site uses Cookies. View our privacy policy here. 
 Open Access Article
 This Open Access Article is licensed under a
  *a
*a