 Open Access Article
Efficient photocatalytic oxidation of methane over β-Ga2O3/activated carbon composites†
Jianping Weia,
Juan Yang*ab,
Zhihui Wenab,
Jun Daiab,
Yao Liab and
Banghao Yaoa
aState Key Laboratory Cultivation Base for Gas Geology and Gas Control, The Collaborative Innovation Center of Coal Safety Production of Henan, School of Safety Science and Engineering, Henan Polytechnic University, Jiaozuo, 454000, P. R. China. E-mail: yangjuanhpu@163.com
bInstitute of Chemical Safety, School of Safety Science and Engineering, Department of Applied Chemistry, College of Chemistry and Chemical Engineering, Henan Polytechnic University, Jiaozuo, 454000, P. R. China
First published on 31st July 2017
Abstract
Efficient oxidation of methane over heterogeneous catalysts under ambient conditions is still a challengeable study toward C1 utilization and atmospheric cleansing. In this study, by using a hydrolysis method combined with an impregnation process, β-Ga2O3 nanoparticles supported uniformly on activated carbon (AC) can be obtained readily. The as-prepared Ga2O3/AC composites show efficient performance for photocatalytic oxidation of CH4 under ultraviolet irradiation. The experimental results indicate that photocatalytic activity toward CH4 oxidation is strongly dependent on the weight ratio of Ga2O3 to AC. 15%-Ga2O3/AC exhibits the highest catalytic activity, which is more than sixfold of P25, a benchmark photocatalyst. The photoluminescence spectra show the decreased recombination centers and the diminished recombination of photo-generated electrons (e−) and holes (h+) when Ga2O3 nanoparticles were deposited on AC. Further investigation reveals that the excellent photo-oxidation activity for CH4 over Ga2O3/AC can be ascribed to a synergistic effect involving strong adsorption capacity and improved separation of photo-generated e−/h+ pairs. Moreover, the photocatalytic oxidation of CH4 obeys pseudo-first-order kinetics and the cycling experiment indicates that Ga2O3/AC composites possess stable photocatalytic performance for CH4 oxidation. The underlying photo-oxidation mechanism is also investigated using electron paramagnetic resonance (ESR) and radical scavenging experiments. This study demonstrates that photocatalysis with Ga2O3/AC is a highly efficient method toward the oxidation of low concentrations of CH4, which provides valuable information for atmospheric environmental cleansing.
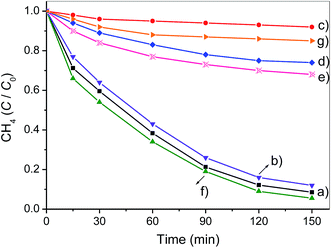
1. Introduction
As the major ingredient of natural gas, CH4 is widely employed as a clean fuel and is also a common carbon source for chemical production. In view of its effect on improving the living quality of human beings, the discharge of CH4 has been considered to be negligible for a long time, which results in an ever-increasing CH4 concentration in the atmosphere.1,2 Recently, with the increasing concern surrounding atmospheric contamination and global warming, the negative effects of CH4 emission receive more and more attention.3,4 According to a report of the Intergovernmental Panel on Climate Change, CH4 is responsible for about twenty percent of man-made global warming and the greenhouse gas effect of CH4 is nearly 28 times greater than that of an equivalent mass of CO2.5 More seriously, coal-bed gas or shale gas exploitation results in the increase of CH4 release into the atmosphere. Therefore, the conversion of atmospheric methane into equimolar amounts of carbon dioxide is extremely important for retarding global warming.Due to the high energy of C–H bond (434 kJ mol−1) and nonpolar characteristics of CH4 molecule, oxidation of CH4 has been mainly studied via thermal catalysis with noble metal and transition-metal oxide catalysts in the past decades.6,7 However, the high reaction temperature (∼673 K) and inefficiency in oxidizing low concentration of CH4 are the defects of conventional thermo-catalysis. Although the microorganism treatments using methane oxidative bacteria could decompose CH4,8,9 it has been proved to be inefficient for the practical application because this approach is time consuming and difficult to control. Wei and his co-workers have recently reported the oxidation of CH4 with hydroxyl radicals (˙OH) generated via Fenton reagent.10 The results demonstrate that ˙OH derived from Fenton reagent can drive the oxidation of CH4 under a certain reaction condition. However, the homogeneous Fenton systems have some limitations because Fe2+ and H2O2 cannot be separated from the reaction system and reused for the next cycle. Additionally, iron ions are easy to precipitate under an alkaline condition, which restricts the CH4 removal with Fenton reagent can be only performed in a narrow pH range.
Heterogeneous photocatalysis is regarded as an ideal technology for solving the urgent energy and environmental issues,11–13 especially in removing various gaseous pollutants at ambient pressure and temperature.14,15 Previous studies have also indicated CH4 molecules can be activated and subsequently oxidized via TiO2 photocatalytic technology,16,17 however, the efficiency of CH4 photo-oxidation remains notoriously low. Adsorption and photoreaction are two successively key steps, which are generally interactional during the heterogeneous photocatalytic process. Surface adsorption and the diffusion of reactants to active sites are the preconditions of photocatalytic reactions. Strong adsorption of target reactants facilitates the catalytic reaction between the adsorbed reactant and surface active species. As a result, the efforts toward improving the adsorption of reactants in photocatalytic system have been made through constructing porous materials18,19 or adsorbent-loaded composites.20,21 Fabricating of the composites with adsorptive support and traditional photocatalyst is considered as an effective approach to obtain the adsorption-enhanced photocatalyst. Adsorbent-loaded photocatalysts usually possess excellent synergistic effect because of the continuous transfer of adsorbed reactants to the supported photocatalytic active sites. Meanwhile, the prolonged retention-time of intermediates on the composite catalyst facilitates improving the mineralization of pollutants.
Carbon materials, such as graphene oxides (GO),22 carbon nanotube (CNT)23,24 and activated carbon (AC),25 have been extensively used as one kind of excellent supports for semiconductor-based photocatalyst nanoparticles, which can efficiently improve the distribution of active components, the electron-transfer from semiconductor particles to carbon supports, and the stability of catalysts. Furthermore, in the field of CH4 adsorption and storage, porous carbon materials have also received wide attention due to their outstanding adsorption capacity.26,27 Among these carbon-based supports, AC is commonly used owing to its unique advantages, including abundant microporous structure, high adsorption capacity, low production cost, and facile recycling.
β-Gallium oxide (β-Ga2O3) has wider band-gap energy (4.8 eV) than classic photocatalyst TiO2 (3.2 eV). The reported valence-band potential (−7.75 eV) of Ga2O3 is lower than that (−7.41 eV) of TiO2 (relative to the vacuum energy level) and the conduction-band potential (−2.95 eV) of Ga2O3 is higher than that (−4.21 eV) of TiO2.28,29 In consequence, the photo-holes and photo-electrons generated upon the surface of Ga2O3 possess stronger redox capacity than those formed over TiO2. This contributes to the oxidation of persistent organic pollutants and the mineralization of stable intermediates upon the surface of Ga2O3.29 In addition, Ga2O3 is also an environmental friendly material according to Worksafe Australia criteria. Fu and his colleagues have reported the photocatalytic degradation of volatile organic contaminants (e.g. benzene and methylbenzene) over β-Ga2O3 nanoparticles under ambient conditions and found that the photocatalytic activity of β-Ga2O3 particles was much superior to commercial P25.28,29 Porous β-Ga2O3 was highly photoactive for mineralizing benzene to CO2 and no obvious deactivation was observed during the prolonged irradiation about 80 h.28 The high activity and long-term stability of Ga2O3 could be primarily ascribed to its wider band gap energy and the resulting stronger oxidative capacity.
In this study, activated carbon (AC) supported β-Ga2O3 composites (Ga2O3/AC) were prepared via an in situ synthetic method, including facile hydrolysis and impregnation process. The structure and physical–chemical properties of as-prepared Ga2O3/AC were characterized by using various analysis techniques. Ga2O3/AC composites demonstrate excellent photocatalytic activity for methane oxidation under ultraviolet irradiation. β-Ga2O3 is chosen because it is an environmental friendly semiconductor with wide band-gap satisfying the requirement of strong oxidation capability. AC facilitates the adsorption of CH4 molecules and the uniform distribution of Ga2O3 nanoparticles. The effects of Ga2O3 weight ratios, irradiation intensity, and initial CH4 concentration on the photocatalytic oxidation efficiency were studied systematically. The results of dark-adsorption experiments and PL spectra indicate that the superior photocatalytic activity of Ga2O3/AC composites can be ascribed to a synergistic effect involving strong adsorption capacity and improved separation of photo-generated e−/h+ pairs. Besides, the photocatalytic oxidation of CH4 over Ga2O3/AC obeys pseudo-first-order kinetics. The underlying photo-oxidation mechanism is also investigated using electron paramagnetic resonance (ESR) and radicals scavenging experiments. The present work provides theoretical support and green approach to CH4 oxidation and atmospheric environmental cleansing.
2. Experimental section
2.1 Materials and agents
Gallium nitrate hydrate was purchased from Strem Chemicals. Anhydrous ethanol, tetrabutyl orthotitanate, acetic acid and ammonia solution were obtained from Aladdin Industrial Inc. (Shanghai, P.R. China). The standard gas of N2, CH4 and O2 (purity > 99.99%) were obtained from Jinggao Gas Inc. (Beijing, P.R. China). All chemicals from commercial sources were used without further purification except AC (AP4-60, purchased by Suzhou Calgon Carbon Inc.).2.2 Preparation of photocatalyst
The commercial AC was firstly grinded and filtrated using a 60 mesh filter. The obtained AC particles were treated successively with 10% NaOH solution and 10% HNO3 solution. The products were collected, washed with deionized (DI) water several times and dried at 70 °C.Ga2O3/AC composite photocatalysts were fabricated using hydrolysis method combined with impregnation process. In a typical synthesis, 2 g of treated AC was dispersed into 30 mL DI water, followed by vigorous stirring 30 min to obtain a uniform suspension. 1.0 g of gallium nitrate hydrate was dissolved in 20 mL of anhydrous ethanol to form a homogenous solution, which was added dropwise into the above suspension under magnetic stir. After 1 h, the mixed solution of ethanol and ammonia solution (volume ratio 1![[thin space (1/6-em)]](https://www.rsc.org/images/entities/char_2009.gif) :
:![[thin space (1/6-em)]](https://www.rsc.org/images/entities/char_2009.gif) 1) was added slowly into the obtained suspension, which kept continuous stirring for 3 h at room temperature.28 The resulting precipitate was centrifuged, washed with DI water, dried at 80 °C and calcinated at 600 °C for 2 h to prepare Ga2O3/AC. For simplicity, it is assumed that all of gallium nitrate hydrate was converted to Ga2O3. By changing the amount of gallium nitrate, Ga2O3/AC composites with different weight ratios of Ga2O3 were obtained and labeled as x-Ga2O3/AC, which x represents the weight ratio of Ga2O3 in the as-prepared composites. According to the above-mentioned way, a series of Ga2O3/AC composites with Ga2O3 weight ratio of 5%, 10%, 15%, 20% and 25% were prepared and denoted as 5%-Ga2O3/AC, 10%-Ga2O3/AC, 15%-Ga2O3/AC, 20%-Ga2O3/AC and 25%-Ga2O3/AC, respectively.
1) was added slowly into the obtained suspension, which kept continuous stirring for 3 h at room temperature.28 The resulting precipitate was centrifuged, washed with DI water, dried at 80 °C and calcinated at 600 °C for 2 h to prepare Ga2O3/AC. For simplicity, it is assumed that all of gallium nitrate hydrate was converted to Ga2O3. By changing the amount of gallium nitrate, Ga2O3/AC composites with different weight ratios of Ga2O3 were obtained and labeled as x-Ga2O3/AC, which x represents the weight ratio of Ga2O3 in the as-prepared composites. According to the above-mentioned way, a series of Ga2O3/AC composites with Ga2O3 weight ratio of 5%, 10%, 15%, 20% and 25% were prepared and denoted as 5%-Ga2O3/AC, 10%-Ga2O3/AC, 15%-Ga2O3/AC, 20%-Ga2O3/AC and 25%-Ga2O3/AC, respectively.
For comparison, TiO2/AC nanocomposite sample was also synthesized via in situ compositing process according to the recent report.30 Briefly, a certain amount of treated AC was dispersed into 30 mL DI water, which was stirred for 30 min to ensure the thorough dispersion of AC. Then, 2 mL of tetrabutyl titanate (TBOT) was mixed with 10 mL anhydrous alcohol and added dropwise to the above suspension of AC with magnetic stirring. After stirring for 3 h, the suspension was treated under microwave irradiation at 700 W for 15 min. The precipitates thus obtained were centrifuged, washed with DI water, and dried at 80 °C in an electric oven to prepare TiO2/AC.
2.3 Characterization of photocatalyst
The crystalline structure of as-synthesized Ga2O3/AC was identified by X-ray diffraction (XRD) on a Bruker D8 Advance diffractometer with Cu Kα radiation (λ = 0.15405 nm) in the region 2θ = 5–80°. The morphology of composites was observed with a scanning electron microscope (SEM, Hitachi, SU8010). Transmission electron microscopy (TEM) imaging was performed on a FEI Tecnai G2 microscope at an accelerating voltage of 200 kV. The X-ray photoelectron spectroscopy measurements were performed on a Thermo scientific ECALAB 250xi system with Mg Kα source. The binding energies were calibrated using that of C 1s (284.6 eV). Nitrogen adsorption and desorption measurements were performed at 77 K using Micromeritics ASAP2020 equipment. The samples were degassed at 200 °C before measurements. Photoluminescence spectra (PLs) of the composite catalysts were recorded using a FLsp 920 luminescence spectrophotometer (Edinburgh) at room temperature with an excitation wavelength of 220 nm. Electron spin resonance (ESR) signals were obtained by using a Bruker ER200-SRC spectrometer at ambient temperature with a Philip lamp of 254 nm as light source. 50 μL of sample solutions were put into quartz capillary tubes and sealed. The capillary tubes were inserted in the ESR cavity, and the spectra were recorded during the irradiation at a selected time. All the ESR measurements were performed using the following settings: 20 mW microwave power, 100 G scan range and 1 G field modulation.2.4 Photocatalytic oxidation of CH4
Photocatalytic oxidation of CH4 was implemented with a home-made fixed bed tubular quartz reactor of 500 mL capacity. The schematic diagram of photocatalytic experimental apparatus was shown in Fig. S1 (see, ESI†). All of the photocatalytic experiments were carried out at ambient temperature and pressure unless indicated otherwise. Firstly, 200 mg of composite catalyst was added to 10 mL of H2O and ultrasonicated for 20 min. The aqueous suspension was then coated uniformly on the surface of five glass sheets (each glass sheet is 2 cm × 8 cm), followed by drying at 60 °C until the water was completely removed. The as-obtained supported catalysts were horizontally put into the middle of the tubular reactor. Then, the reactor was vacuumed repeatedly to remove H2O and CO2 that adsorbed on the surface of catalysts and reactor inner-wall. CH4, O2, and N2 were mixed at a certain percentage via a gas mixer. The obtained gaseous mixture was used to afford a reactant stream. The initial concentration of CH4 in the stream was 1.56 mmol L−1. Before the irradiation, the reaction system was kept in the dark for 2 h to ensure an adsorption–desorption equilibrium state established between photocatalysts and reactants. Then, the photocatalysts were irradiated using a 10 W Philips low-pressure mercury lamp (with a wavelength centered at 254 nm) located in the middle of the quartz reactor. At a given time interval, 1.0 mL gas was collected from the reactor and analyzed using a Thermo gas chromatograph (GC) with a molecular sieve 13× column and a HP-Plot/U capillary column equipped with a thermal conductivity detector and a flame ionization detector. The experimental temperature was maintained at 25 ± 1 °C by recirculating a cooling water system. For comparison, the photocatalytic activity of 15%-TiO2/AC was also investigated under the same experimental conditions, as those used for 15%-Ga2O3/AC.In general, photocatalytic activity is determined by the formation of radical species, such as photo-holes (h+), electrons (e−), superoxide (O2˙−), and ˙OH. Comparative investigations of the effect of active species on the photocatalytic activity were conducted by using scavenger reagents to remove the different radicals. Potassium iodide (KI), potassium dichromate (K2Cr2O7), tert-butyl alcohol (TBA), and benzoquinone were employed as scavengers for h+, e−, O2˙−, and ˙OH, respectively. Typically, 200 mg of photocatalyst was mixed with 1 mM of the different trapping reagents in 10 mL of water and ultrasonicated for 20 min. Then, the aqueous suspensions were coated onto the glass sheets followed by drying at 60 °C until H2O was completely removed. The coated sheets were used in the photocatalytic experiments of CH4 oxidation as described above.
3. Results and discussion
3.1 Characterization of β-Ga2O3/AC composites
The crystallographic structure of as-synthesized Ga2O3/AC composites was investigated by XRD and the results were indicated in Fig. 1, as well as with the XRD patterns of bare Ga2O3 and AC shown for comparison. As can be seen from Fig. 1A, the XRD pattern of AC showed two weak broad peaks at about 24.7° and 43.8°, indicating that AC possessed a mainly amorphous structure. A sharp peak at 26.7° assigned to (002) crystallographic plane of hexagonal graphitic structure was also observed,31 which could be due to small regions of crystallinity in the commercially-obtained AC substrate. Bare Ga2O3 prepared by the hydrolysis of Ga(NO3)3 in ammonium solution exhibited the characteristic peaks at 2θ values of 31.7°, 35.4°, 43.5° and 64.5°, which can be indexed as (002), (111), (311) and (512) planes of monoclinic β-Ga2O3 (JCPDS no. 76-0573).32 It suggests that the as-prepared Ga2O3 was predominantly nanosized β-Ga2O3 after the hydrolysis product was calcined at 600 °C for 2 h. This result is well consistent with the previous research.28 Among the four polymorphs of Ga2O3 reported in the field of catalysis, β-Ga2O3 is the most stable on thermodynamics and all the other polymorphs can be ultimately transformed into β-Ga2O3 by calcination.33 As indicated in Fig. 1B, except the characteristic peaks at 24.7°, 26.7° and 43.8° belonging to amorphous AC, the diffraction peaks at about 31.7°, 35.4° and 64.5° corresponding to β-Ga2O3 were also observed, which indicated that Ga2O3/AC composites were successfully fabricated via the present experimental method. Additionally, it was obvious that the diffraction peak intensity of β-Ga2O3 increased with increasing the amount of Ga2O3 loaded on AC support.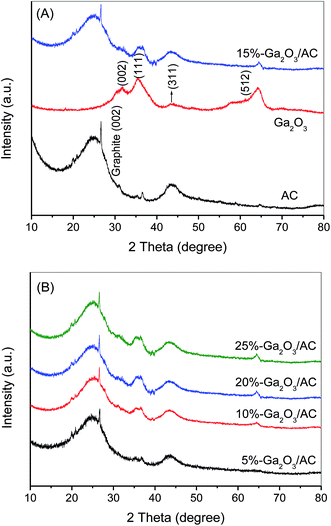 | ||
| Fig. 1 (A) XRD patterns of bare AC, Ga2O3 and 15%-Ga2O3/AC, (B) XRD patterns of Ga2O3/AC composites with different weight ratios of Ga2O3. | ||
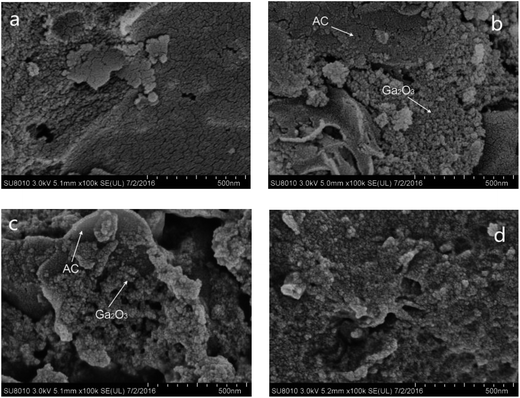
To investigate the morphology of Ga2O3/AC composites and the distribution of Ga2O3 particles on the surface of AC, SEM imaging was carried out and the results were presented in Fig. 2. Fig. 2a showed that AC had a clean and porous surface, which was usually employed as the support owing to its huge specific surface. When the weight ratio of Ga2O3 was low (e.g. 5.0%-Ga2O3/AC), nano-Ga2O3 particles were primarily dispersed on the meso-pore or macro-pore mouths of AC support, as indicated in Fig. 2b. With the increase of Ga2O3 weight ratios, spherical Ga2O3 nanoparticles occupied both the pore mouths and the outer surface of AC, as observed from Fig. 2c and d. This is similar to the previously reported TiO2/AC composites.34 Additionally, it was clearly seen from Fig. S2 of ESI† that bare Ga2O3 was composed of nanoparticles with an average size of 6–15 nm, whereas the obvious aggregation could be noted for bare Ga2O3 particles. By comparing SEM images of Ga2O3/AC and bare Ga2O3, it can be easily found that the loading on AC facilitates the uniform distribution of Ga2O3 nanoparticles.
To further investigate the microstructure of Ga2O3/AC composites, the TEM images were provided and shown in Fig. 3. It is clearly indicated that Ga2O3 nanoparticles (black dots) with nanosized dimension were uniformly deposited on the surface of AC (gray region), and the large scale agglomerate was not detected in 5.0%-Ga2O3/AC and 15%-Ga2O3/AC composites (Fig. 3a and b). A high-resolution TEM image of 15%-Ga2O3/AC was shown in Fig. 3d. The lattice fringes of d = 0.282 nm and d = 0.255 nm matched those of (002) and (111) crystallographic planes of β-Ga2O3, respectively.35 The intimate contact of activated carbon with β-Ga2O3 lattice was also evidenced from the HRTEM image. However, when the weight ratio of Ga2O3 increased up to 25%, the as-formed Ga2O3 particles were inclined to agglomerate (Fig. 3c). It indicates that the Ga2O3 nanoparticles are easier to agglomerate on the surface of Ga2O3/AC composites with increasing Ga2O3 weight ratios. It is well known that the catalytic activities of nanocomposite photocatalysts strongly depend on the distribution of active components on the surface of support. Compared with Ga2O3 particles deposited homogeneously on the surface of 15%-Ga2O3/AC, the agglomerated Ga2O3 nanoparticles in 25%-Ga2O3/AC composites may hamper the light incidence on the photoreactive sites and consequently reduce the photocatalytic oxidation efficiency.
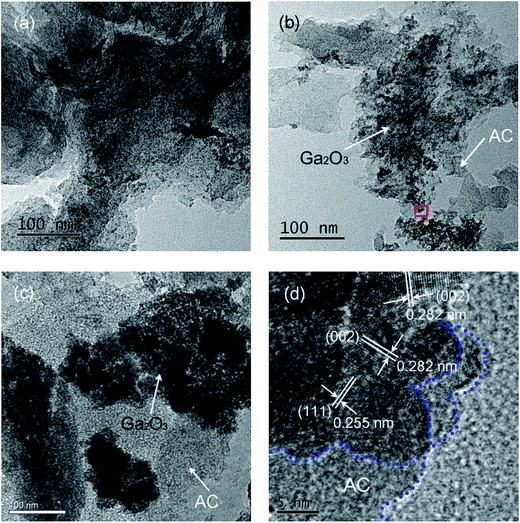 | ||
| Fig. 3 TEM images of (a) 5.0%-Ga2O3/AC, (b) 15%-Ga2O3/AC, (c) 25%-Ga2O3/AC, and (d) high-resolution TEM image of 15%-Ga2O3/AC. | ||
The chemical components and surface chemical states of Ga2O3/AC composites were confirmed using XPS, and the results were presented in Fig. 4. The typical XPS survey spectrum with energy ranging from 0 to 1200 eV obtained from 15%-Ga2O3/AC was shown in Fig. 4a, which reveal the peaks of the core level from Ga 2p, Ga 3d, Ga LMM Auger peak, C 1s and O 1s. The energy peaks positioned at 1149.2 and 1121.5 eV in Fig. 4b are known to stem from Ga 2p1/2 and Ga 2p3/2, representing the Ga–O bonding.36 The energy peak of Ga 3d centered at 23.6 eV can be ascribed to the presence of gallium in β-Ga2O3 (Fig. 4a). The O1s XPS signal observed at a binding energy of 532.4 eV (Fig. 4c) corresponded to the characteristic peak of β-Ga2O3.37 The XPS analysis confirmed that the as-prepared Ga2O3 was mainly nanosized β-Ga2O3, which accords with the XRD measurement. Fig. 4d showed the C 1s peak of 15%-Ga2O3/AC was at 284.6 eV, which was mainly owed to the AC and the pollutant carbon from the XPS instrument.38 Besides, the atomic contents of Ga and C in different Ga2O3/AC nanocomposite samples were calculated from XPS peak areas, which can be converted to the weight ratios of Ga2O3 to AC. As indicated in Table 1, the calculated weight ratios for Ga2O3 and AC are closely equal to the adding ratios in the preparation process, implying that gallium nitrate hydrate can be completely converted to Ga2O3 via the as-mentioned hydrolysis method.
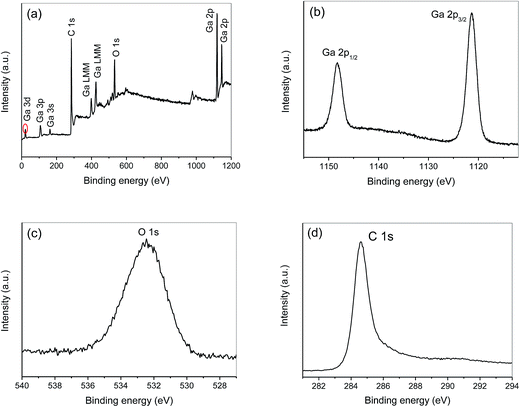 | ||
| Fig. 4 XPS of 15%-Ga2O3/AC nanocomposite sample: (a) survey spectrum, (b) Ga 2p, (c) O 1s, and (d) C 1s. | ||
| Samples | Weight ratio of Ga2O3 to AC | SBET (m2 g−1) | VT (cm3 g−1) | VM (cm3 g−1) | Pore size (nm) |
|---|---|---|---|---|---|
| a SBET, specific surface area obtained by BET equation; VT, total pore volume; VM, micropore volume; average pore size from pore size distribution by BJH method. | |||||
| AC | 907 | 0.618 | 0.269 | 1.61 | |
| Ga2O3 | 101 | 0.125 | 0.017 | 3.85 | |
| 5%-Ga2O3/AC | 5.6% | 836 | 0.420 | 0.120 | 2.26 |
| 10%-Ga2O3/AC | 10.9% | 758 | 0.302 | 0.056 | 3.09 |
| 15%-Ga2O3/AC | 14.3% | 685 | 0.237 | 0.025 | 3.48 |
| 20%-Ga2O3/AC | 21.0% | 652 | 0.226 | 0.023 | 3.53 |
| 25%-Ga2O3/AC | 26.4% | 630 | 0.219 | 0.022 | 3.51 |
Since heterogeneous photocatalysis is generally influenced by the specific surface area of catalysts, the pore structure and BET surface area of the synthesized composites were studied on the basis of N2 adsorption and desorption measurements. Fig. 5 showed N2 adsorption–desorption isotherms of bare Ga2O3 and 15%-Ga2O3/AC and the corresponding pore size distribution was given in the inset of Fig. 5. According to the IUPAC classification, the adsorption isotherms of bare Ga2O3 and 15%-Ga2O3/AC were of type IV isotherm, indicating the presence of mesoporous structures. The structural and textural characteristics of as-prepared composites can be obtained from N2 adsorption–desorption isotherms and the corresponding data were summarized in Table 1. For bare Ga2O3, the BET specific surface area (SBET) was 101 m2 g−1 and the average pore size was 3.85 nm with a narrow distribution of pore size. As indicated in Table 1, bare AC had a large SBET of 907 m2 g−1 and high total pore volume of 0.618 cm3 g−1 because of the porous property. After introducing Ga2O3 particles into AC matrix, SBET, total pore volume and micro-pore volume of the obtained Ga2O3/AC composites decreased significantly. Whereas the average pore diameter in the composites increased slightly, compared to bare AC, which could be due to the formation of meso-pores or macro-pores in the channels between the deposited Ga2O3 nanoparticles on the surface of AC. The decrease in micro-pore volume of Ga2O3/AC could be ascribed to the effects of meso-pores blocking by deposited Ga2O3, since these meso-pores acted as the primary passageway to micro porous regions in AC. On the other hand, small grain size and uniform distribution of Ga2O3 particles could inhibit the reduction of SBET and pore volume of Ga2O3/AC composites to some extent. A larger SBET can give rise to more active adsorption sites and photocatalytic reaction centers, which means higher SBET will be beneficial to improving the photocatalytic activity.39
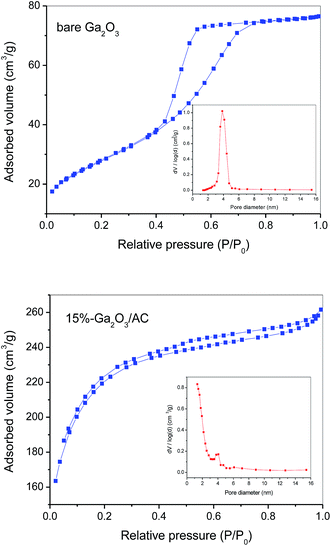 | ||
| Fig. 5 Nitrogen adsorption–desorption BET isotherms and pore size distribution curves (inset) of bare Ga2O3 and 15%-Ga2O3/AC. | ||
3.2 Photocatalytic properties of Ga2O3/AC composites
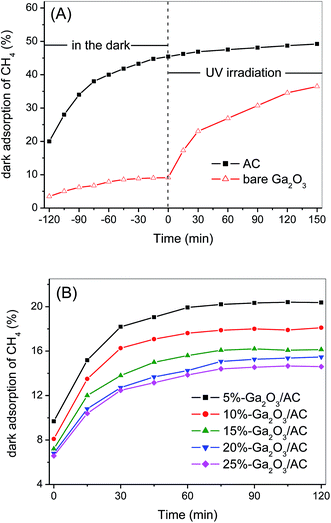
Surface adsorption is the precondition of photocatalytic reaction and strong adsorption of target reactants facilitates the catalytic oxidation between the adsorbed reactants and surface active species. Therefore, the dark-adsorption of CH4 on the surface of as-synthesized samples was investigated firstly. The adsorption capacity of Ga2O3/AC composites as well as bare Ga2O3 and AC was estimated by studying the removal rate of CH4 in a fixed-bed reactor and the results were presented in Fig. 6. For bare AC, the removal of CH4 increased gradually with the increase of adsorption time and about 45.1% of the initial CH4 was removed until reaching an adsorption equilibrium at the end of 120 min in the dark. Whereas, for bare Ga2O3, only 8.9% of the initial CH4 was removed in the dark-adsorption process. In the case of Ga2O3/AC composites, the initial removal of CH4 driven by dark adsorption was lower than unmodified AC. It can be obtained from Fig. 6B that the adsorption-induced removal percentages of CH4 were 20.4%, 18.1%, 16.2%, 15.5%, and 14.6% for 5%-Ga2O3/AC, 10%-Ga2O3/AC, 15%-Ga2O3/AC, 20%-Ga2O3/AC, and 25%-Ga2O3/AC, respectively. It was clearly found that the adsorption-induced removal of CH4 decreased gradually with the increased Ga2O3 loading. The results could be explained by SEM images and N2 adsorption–desorption experimental results, as indicated in Fig. 2 and Table 1. SEM images in Fig. 2 demonstrated that most of AC surface was covered by Ga2O3 nanoparticles. It would result in a negative effect on the adsorption ability of AC, especially for the internal adsorption sites in AC because of the pore blocking by Ga2O3 particles.In the present system, CH4 removal via the gas–solid catalytic reaction can be divided into two steps. One is the above-mentioned adsorption process in the darkness, the other step is photocatalytic oxidation process under UV illumination. For the unmodified AC, only 4.0% of CH4 was further removed after UV irradiation for 150 min, as indicated in Fig. 6A. In contrast to AC, after dark adsorption for 120 min, CH4 could be significantly decomposed by the photocatalytic oxidation over bare Ga2O3. It can be seen from Fig. 6A that CH4 removal increased dramatically with prolonging the time of UV illumination and CH4 removal efficiency reached approximately 36.5% after 150 min irradiation, which was mainly attributed to the photocatalytic oxidation process.
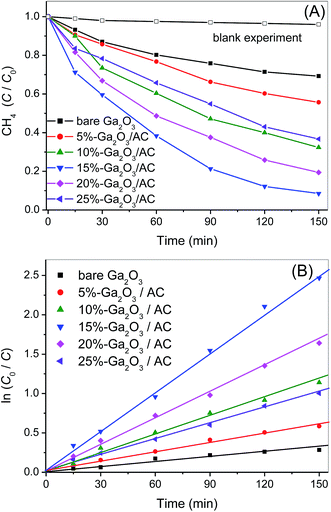
To investigate the kinetic behavior of CH4 oxidation, the concentration data of photocatalytic CH4 degradation were normalized by the initial concentration at the start of illumination, which was also regarded as the equilibrium concentration of dark-adsorption. The as-obtained degradation percentage (C/C0) of CH4 as a function of irradiation time was presented in Fig. 7A. The blank experiment in Fig. 7A referred to the photocatalytic oxidation of CH4 under UV irradiation in the absence of Ga2O3 or Ga2O3/AC composites. No obvious photocatalytic oxidation of CH4 was observed after illumination for 150 min in the absence of catalysts. Careful analysis of CH4 photo-oxidation revealed that the reactions follow pseudo-first-order kinetics and the integrated rate equation can be expressed by:
| Samples | k′ (min−1) | R2 |
|---|---|---|
| Bare Ga2O3 | 0.0023 | 0.9775 |
| 5%-Ga2O3/AC | 0.0039 | 0.9949 |
| 10%-Ga2O3/AC | 0.0081 | 0.9959 |
| 15%-Ga2O3/AC | 0.0171 | 0.9981 |
| 20%-Ga2O3/AC | 0.0113 | 0.9987 |
| 25%-Ga2O3/AC | 0.0067 | 0.9970 |
The photocatalytic oxidation of CH4 primarily proceeded on the outer surface of catalysts. Thus, the weight proportion and distribution of Ga2O3 particles on the exterior surface of Ga2O3/AC are the crucial factors in CH4 oxidation. The effect of Ga2O3 weight proportion on CH4 oxidation rate was shown in Fig. 7. From Fig. 7A, it can be found the oxidation rate of CH4 increased with the increase of irradiation time, possibly because of continuous formation of active radicals upon the surface of irradiated Ga2O3 particles. Photocatalytic CH4 oxidation rates of as-synthesized composites were greatly dependent on the weight ratio of Ga2O3 to AC. It could be obtained from Fig. 7B, the pseudo-first-order rate constant of photocatalytic oxidation CH4 over bare Ga2O3, 5%-Ga2O3/AC, 10%-Ga2O3/AC, 15%-Ga2O3/AC, 20%-Ga2O3/AC, and 25%-Ga2O3/AC was 0.0023, 0.0039, 0.0081, 0.0171, 0.0113, and 0.0067 min−1, respectively. The photocatalytic oxidation rate firstly increased with increasing the weight ratio of Ga2O3 to AC, and then reduced when the weight ratio was higher than 15%. The similar result has been reported in TiO2/AC photocatalytic system.39 When the weight ratio of Ga2O3 was low, photocatalytic rate of CH4 oxidation was also low, which might be due to the limited Ga2O3 particles loaded on the composites. With the increase of Ga2O3 loading, more Ga2O3 were deposited on the surface of AC. As a result, photo-reactive sites available on the surface of catalysts increased, which is beneficial for the gas–solid catalytic reaction of CH4 oxidation. It was clearly seen from Fig. 7 that 15%-Ga2O3/AC exhibited highest oxidation rate of CH4, revealing that appropriate weight ratio of Ga2O3 to AC was able to well disperse Ga2O3 nanoparticles and thus improve the migration of photogenerated electrons. This facilitated the separation of photoinduced electrons and holes, which could efficiently promote photocatalytic rate. However, when the weight proportion of Ga2O3 exceeded 15%, photocatalytic oxidation rates decreased with the increasing of Ga2O3 weight proportion. The reason could be due to the fact that a certain amount of nanosized Ga2O3 particles aggregated on the surface of Ga2O3/AC, which would reduce the efficient light absorption and reactive sites for photocatalytic oxidation. Besides, the reduction of SBET and pore volume (as shown in Table 1) resulted in the decrease of CH4 adsorption on the surface of Ga2O3/AC, which partly reduced the photo-activity for CH4 oxidation. The results further indicate that the weight proportion and dispersibility of Ga2O3 particles on the surface of composite photocatalysts are crucial for the improved photocatalytic activity.
To further understand the oxidation process of CH4 removal over as-prepared Ga2O3/AC samples, the effect of light intensity on the photocatalytic activity was investigated. Photocatalytic oxidation of methane upon the optimal composites 15%-Ga2O3/AC was normalized by the initial concentration at the end of dark adsorption. As indicated in Fig. S3 of ESI,† the CH4 removal driven by photocatalytic oxidation process on 15%-Ga2O3/AC was proportional to the irradiation intensity. This obviously demonstrates that a higher intensity of irradiation gives rise to a more efficient removal of CH4, suggesting the incident light intensity plays an important role in CH4 photocatalytic oxidation system. Under UV irradiation, stronger light intensities can excite more Ga2O3 catalysts and generate more charge carriers or active radical species, leading to higher CH4 oxidation rates. Meanwhile, the results confirm that the methane removal over Ga2O3/AC composite photocatalyst is truly driven by a photocatalytic oxidation process.
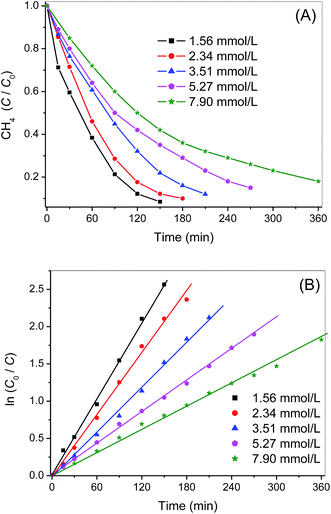
Photocatalytic oxidation of CH4 under different initial concentrations was also carried out and the results were indicated in Fig. 8. The photo-oxidation reactions under various initial CH4 concentrations also followed pseudo-first-order kinetics and the apparent rate constants k′ obtained from Langmuir–Hinshelwood model were 0.0171, 0.0134, 0.0102, 0.0070 and 0.0051 min−1, respectively, with increasing the initial CH4 concentration from 1.56 to 7.90 mmol L−1 (Fig. 8B). This clearly demonstrates that photocatalytic technique is more competent for eliminating low concentration of CH4. It is totally different from traditional thermal catalysis, which usually exhibits poor catalytic activity when the concentration of reactant is low.
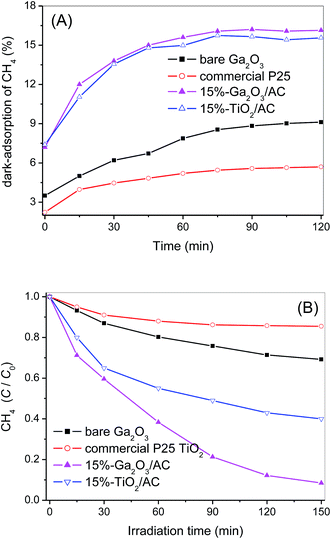
For the photocatalytic methane oxidation, the photo-generated holes or the lattice oxygen activated by photo-holes are considered as the primary active species toward abstracting H from CH4.40 This step is closely related to energy and intensity of irradiation. That is, when fixing the irradiation conditions, the reaction rates are primarily dependent on CH4 initial concentration, and proceed more quickly for lower concentration. To elucidate the excellent performance of Ga2O3-based photocatalysts for CH4 oxidation, dark-adsorption and photocatalytic process of commercial P25 and 15%-TiO2/AC were also investigated under the same experimental conditions. Commercial P25, as a recognized benchmark photocatalyst, is selected to compare with bare Ga2O3. As shown in Fig. 9A, only 5.7% of the initial CH4 was removed over commercial P25 at the end of dark-adsorption, which was slightly lower than that of bare Ga2O3 (8.9%). It can be due to the smaller SBET of P25 (∼50 m2 g−1), compared to as-prepared Ga2O3 (∼101 m2 g−1). 15%-TiO2/AC composite was also prepared via in situ synthesis strategy, as presented in the Experimental section. Similar to the synthesis of Ga2O3/AC composites, the preparation of nanosized TiO2 and the compositing of as-prepared TiO2 with AC were simultaneously carried out. The XRD pattern and SEM image of 15%-TiO2/AC sample were depicted in Fig. S4 and S5 of ESI.† The characteristic diffraction peaks at 25.4°, 37.9°, 48.1°, 54.7° and 63.1° were observed, indicating that as-obtained TiO2 was anatase phase. SEM images of 15%-TiO2/AC showed that TiO2 nanoparticles were uniformly dispersed and loaded upon the surface of AC. It can be found from Fig. 9B that although 15%-TiO2/AC and 15%-Ga2O3/AC exhibited similar adsorption capacity for CH4, the photocatalytic oxidation of CH4 over 15%-Ga2O3/AC was significantly greater than 15%-TiO2/AC. It suggests that high catalytic performance of Ga2O3/AC cannot be simply explained by the surface adsorption. CH4 removal induced by photocatalytic oxidation over bare Ga2O3 and Ga2O3/AC was higher than that over P25 and TiO2/AC. It could be associated with the band gap structures of Ga2O3 and TiO2. For semiconductor TiO2, the conduction band and valence band consist of Ti 3d and O 2p orbitals, respectively. In the case of Ga2O3, the valence band is composed of O 2p orbital, whereas the conduction band consists of hybridized Ga 4s4p orbital. The bandgap energy of Ga2O3 is 4.8 eV, much wider than that of TiO2 (3.2 eV). Additionally, the reported valence-band potential of Ga2O3 is −7.75 eV, which is lower than that of TiO2 −7.41 eV. Whereas, the conduction-band potential of Ga2O3 is −2.95 eV, which is higher than that of TiO2 −4.21 eV.28,29 As a result, the photo-holes and photo-electrons generated on Ga2O3 possess stronger redox ability than those formed on TiO2. The intrinsic energy-band structure of Ga2O3 contributes to the excellent photocatalytic activity for CH4 oxidation.
To examine the mineralization ratio during photocatalytic CH4 oxidation, the production of CO2 over 15%-Ga2O3/AC photocatalysts was detected and the corresponding result was presented in Fig. S6 of ESI.† Before UV light was turned on, no CO2 was detected, which indicated the dark-adsorption process cannot produce CO2. After the light was turned on, the concentration of CH4 decreased significantly with the irradiation time. Meanwhile, the amount of CO2 increased gradually and around 0.93 mmol L−1 of CO2 was produced from CH4 photooxidation under UV irradiation for 150 min. Besides, no other intermediate products, such as CO or ethane, were detected by GC during the CH4 photocatalytic oxidation. Carbon mass balance of 79.0% could be obtained based on the proportion of the sum of remaining CH4 (0.105 mmol L−1) and produced CO2 (0.93 mmol L−1) to carbon input (1.31 mmol L−1 CH4 at the end of adsorption process). This suggests that about 79.0% CH4 is mineralized to CO2 after UV irradiation for 150 min.
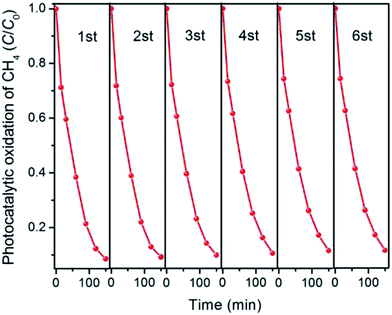
The stability or recyclability of a catalyst is an extremely crucial parameter for practical utilization. To test the stability of as-prepared Ga2O3/AC photocatalysts, a cycling CH4 photo-oxidation test over the optimal composite 15%-Ga2O3/AC was thus performed and the results were indicated in Fig. 10. After six cycles, the activity of 15%-Ga2O3/AC almost remained unchanged. Moreover, the crystal structure and chemical composition of recycled 15%-Ga2O3/AC sample were also investigated by XRD and XPS analysis. No noticeable differences between the freshly made and the repeatedly used samples were observed from Fig. S7 of ESI.† The results demonstrate Ga2O3/AC composites are stable and can be recycled toward CH4 photocatalytic oxidation.
3.3 Photocatalytic mechanism of CH4 oxidation over Ga2O3/AC composites
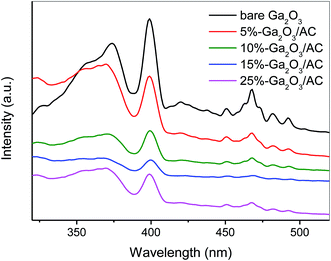
Photoluminescence (PL) generally arises from the charge recombination process of photoinduced electron and hole and thus the intensity of PL peak can represent the recombination extent of photogenerated charges. Low PL intensity usually demonstrates low recombination degree and efficient separation of h+ and e−. Fig. 11 showed the PL spectra of bare Ga2O3 and various Ga2O3/AC composites. The as-prepared samples exhibited the same PL peaks and similar curve shapes, which indicated introduction of AC did not generate new luminescence phenomena but the weight ratio of Ga2O3 indeed affected the PL intensity. The major luminescence signals were observed in the wavelength range of 350–480 nm. The peak at around 370 nm and 400 nm could be assigned to the recombination of self-trapped excitons, which mainly originated from the band edge emission.41,42 Furthermore, based on the previous reports, β-Ga2O3 contains two kinds of Ga3+ ions.41,42 One is Ga3+ ion in the tetrahedral site coordinated by four oxygen atoms and the other is that in the octahedral site coordinated by six oxygen atoms. An emission centered at 465 nm might be derived from the recombination of electrons trapped by oxygen vacancy and holes generated by either gallium vacancy or gallium–oxygen vacancy pairs.41,42 These vacancies could be formed by the thermal treatment during the synthesis process.More importantly, the incorporation of AC led to the decrease in the intensity of PL spectra, which suggests that the composite photocatalysts possess low recombination of h+ and e−. The intensity of luminescence peaks decreased in the order of bare Ga2O3 > 5%-Ga2O3/AC > 10%-Ga2O3/AC ≈ 25%-Ga2O3/AC > 15%-Ga2O3/AC. When the weight ratio of Ga2O3 was low, Ga2O3 particles were mainly dispersed on the meso-pore or macro-pore mouths of AC, as presented in Fig. 2b, resulting in the moderate decrease of PL intensity. As the weight ratio of Ga2O3 to AC increased, the PL intensity of Ga2O3/AC composites gradually decreased. A lower PL intensity usually indicates a slower recombination rate and higher separation efficiency of photoinduced charge carriers. 15%-Ga2O3/AC sample exhibited lowest PL intensity, which could be due to the highly dispersed Ga2O3 nanoparticles supported onto the surface of AC. It was beneficial for the separation of photo-induced electron/hole pairs and consequently improved the photocatalytic activity. However, when the weight ratio of Ga2O3 was too high, nanosized Ga2O3 particles could aggregate on the surface of AC, which reduced the efficient light absorption and separation of photogenerated h+ and e−.
The photocatalytic oxidation of methane generally involves the surface reactions of photogenerated holes and electrons, which may also produce oxidizing species, such as O2˙− and ˙OH to further the oxidation reactions. To identify the generation of reactive species and investigate the photocatalytic mechanism of Ga2O3/AC composites toward CH4 oxidation, ESR spectroscopy with spin trapping and labeling was chosen as an effective characterization technique. Here, we selected 5,5-dimethyl-1-pyrroline-N-oxide (DMPO)43 as a spin-trapping agent for O2˙− radicals and 2,2,6,6-tetramethylpiperidine-1-oxyl (TEMPO)44 as a spin-labeling agent for photogenerated electrons.
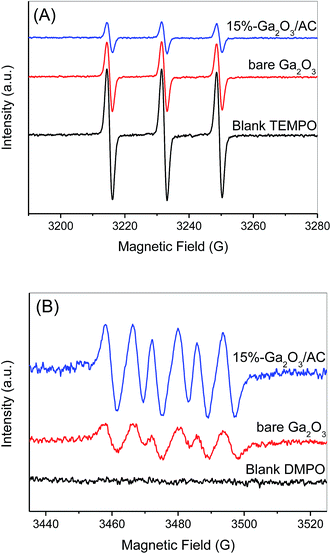
Photo-holes are considered as the predominant active species for photocatalytic oxidation of methane. It is demonstrated that the triplet ESR signal of TEMPO can diminish or even vanish if it is reduced by photogenerated electrons from semiconductors.44 As a result, the generation of photo-electrons can be monitored accurately by observing the changes in the intensity of TEMPO signals. ESR spectrum of an aqueous TEMPO solution showed a stable signal having triplet peaks with intensity of 1![[thin space (1/6-em)]](https://www.rsc.org/images/entities/char_2009.gif) :
:![[thin space (1/6-em)]](https://www.rsc.org/images/entities/char_2009.gif) 1
1![[thin space (1/6-em)]](https://www.rsc.org/images/entities/char_2009.gif) :
:![[thin space (1/6-em)]](https://www.rsc.org/images/entities/char_2009.gif) 1 (Fig. 12A). The signal intensity decreased moderately after 3 min irradiation in the presence of bare Ga2O3; however, a considerable decrease in the ESR signal was observed during the irradiation of 15%-Ga2O3/AC suspension. It indicates that the introduction of AC can enhance the generation of photoelectrons greatly. Furthermore, the presence of photoelectrons is invariably accompanied by the generation of photoholes. Hence, the reduction of ESR signal intensity shown in Fig. 12A can reflect the formation of photoholes over Ga2O3/AC composites indirectly. In addition, as shown in Fig. 12B, the characteristic peaks of DMPO-O2˙− can be observed in methanol suspensions of bare Ga2O3 upon irradiation for 3 min.43 For 15%-Ga2O3/AC composites, the signal intensity of DMPO-O2˙− increased obviously (about 3 times of bare Ga2O3) under the same conditions. These results demonstrate that O2˙− can be generated over bare Ga2O3 or Ga2O3/AC composites under UV irradiation and introduction of AC significantly enhanced the photogeneration of O2˙−.
1 (Fig. 12A). The signal intensity decreased moderately after 3 min irradiation in the presence of bare Ga2O3; however, a considerable decrease in the ESR signal was observed during the irradiation of 15%-Ga2O3/AC suspension. It indicates that the introduction of AC can enhance the generation of photoelectrons greatly. Furthermore, the presence of photoelectrons is invariably accompanied by the generation of photoholes. Hence, the reduction of ESR signal intensity shown in Fig. 12A can reflect the formation of photoholes over Ga2O3/AC composites indirectly. In addition, as shown in Fig. 12B, the characteristic peaks of DMPO-O2˙− can be observed in methanol suspensions of bare Ga2O3 upon irradiation for 3 min.43 For 15%-Ga2O3/AC composites, the signal intensity of DMPO-O2˙− increased obviously (about 3 times of bare Ga2O3) under the same conditions. These results demonstrate that O2˙− can be generated over bare Ga2O3 or Ga2O3/AC composites under UV irradiation and introduction of AC significantly enhanced the photogeneration of O2˙−.
The photocatalytic oxidation of CH4 over 15%-Ga2O3/AC composites was further explored through a series of control experiments. As depicted in Fig. 13, the oxidation of CH4 was almost unchanged after adding TBA (a scavenger of ˙OH45) into the reaction system, indicating that ˙OH had little effect on photocatalytic oxidation of CH4 over Ga2O3/AC composites. When KI was added to the reaction system to trap the holes,46 the CH4 oxidation was significantly inhibited, revealing that photogenerated holes were the major oxidative species for the photocatalytic CH4 oxidation. Addition of BQ (a scavenger of superoxide radicals47) clearly suppressed the CH4 oxidation, which suggests that O2˙− also play a critical role in the photocatalytic oxidation of CH4. Adding K2Cr2O7 (an electron scavenger48) into the reaction system led to moderate decrease of photocatalytic oxidation for CH4. All of the above experimental results were obtained in the presence of 79% N2 gas, 21% O2 gas and 1.56 mmol L−1 CH4.
However, when adding electron scavenger K2Cr2O7 in the presence of 100% O2 gas and 1.56 mmol L−1 CH4, the oxidation of CH4 exhibited slight increase. It might be ascribed to the fact that trapping of photogenerated electrons with K2Cr2O7 could benefit the generation of photoinduced holes. But the oxidation of CH4 was significantly restrained in the presence of K2Cr2O7, 100% N2 gas and 1.56 mmol L−1 CH4. During the photocatalytic process of CH4 oxidation, CH4 was activated primarily via extracting hydrogen by photoinduced holes, consequently generating methyl radicals (˙CH3). These experimental results imply that high concentration of O2 can also react with ˙CH3, although there is no superoxide radicals.
As it is known, CH4 is a highly flammable gas. CH4 is unstable under high concentration of O2 and can cause combustion and even explosive reactions. Hence, from the view of experimental safety, the photocatalytic experiments of CH4 oxidation were performed in the presence of 79% N2 gas and 21% O2 gas unless otherwise stated. On the basis of the above experimental results, it is concluded that the reaction between ˙CH3 and O2˙− is predominant for the photocatalytic oxidation of CH4 in the presence of 79% N2 gas and 21% O2 gas.
The ESR results in Fig. 12 indicate that Ga2O3/AC composites facilitate the generation of photo-induced active species, such as O2˙− and photo-holes. Meanwhile, the weight ratios of Ga2O3 have a decisive role in the photocatalytic activity of Ga2O3/AC composites (Fig. 7). Therefore, it was critical to investigate whether the weight ratios of Ga2O3 had similar effects on the photoinduced generation of active species. The effects of Ga2O3 weight ratios on the ESR signal intensity of DMPO-O2˙− and TEMPO were depicted in Fig. 14. A similar dependence on Ga2O3 weight ratios was observed for O2˙− radicals and photoholes. An initial increase in the ESR signal intensity was noted for Ga2O3/AC composites with weight ratio of Ga2O3 up to 15%. Diminishing ESR signal intensities were observed for composite samples having a higher weight ratio of Ga2O3. Importantly, it is of interest to note that the changes of ESR signals obtained for DMPO-O2˙− or TEMPO and the photocatalytic activity of CH4 oxidation had a similar dependence on the weight ratios of Ga2O3. This correlation implied a mechanistic connection between the generation of photoholes or O2˙− radicals and the photocatalytic performance. The results also indicate photogenerated holes and O2˙− radicals play dominant roles in the photocatalytic oxidation of CH4 over Ga2O3/AC composites, consistent with the results of active species trapping experiments.
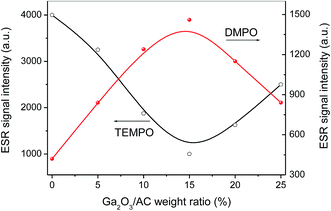 | ||
| Fig. 14 Effect of Ga2O3 weight ratios on the enhancement of photoinduced generation of superoxide radicals and photoelectrons. | ||
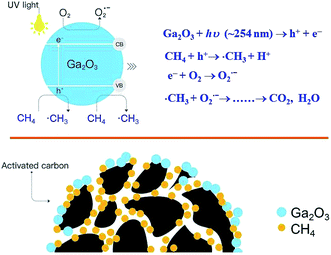
For the photocatalytic oxidation of CH4, Ga2O3/AC catalysts are thought to act through a dynamic adsorption-photocatalysis process under UV irradiation. Ga2O3/AC composites exhibit higher performance for CH4 oxidation compared with bare Ga2O3, which might be due to the following two aspects. One is the excellent adsorption capacity of AC for CH4 molecules. The interface created between AC and Ga2O3 phase facilitates the adsorption of CH4 onto AC and the transfer of adsorbed CH4 to catalytic active component Ga2O3. More importantly, AC support facilitates the dispersion of deposited Ga2O3 nanoparticles (Fig. 2), inhibiting the agglomeration of catalytic active components. On the basis of above results, the proposed mechanism for photocatalytic oxidation of CH4 upon Ga2O3/AC composites is depicted in Scheme 1. Under UV irradiation, photoinduced electrons and holes are generated upon the surface of Ga2O3 nanoparticles. The initial step of CH4 activation primarily involves the reaction with photogenerated holes. The photogenerated electrons can react with the adsorbed O2 upon the surface of catalysts and generate O2˙− radicals. The obtained methyl radicals via abstracting the hydrogen of CH4 are further oxidized by superoxide anion radicals. The introduction of AC would enhance the surface adsorption of CH4 molecules, the charge separation of photoinduced electron–hole pairs and the generation of active radical species, improving the photocatalytic properties toward CH4 oxidation.
4. Conclusions
A high-performance Ga2O3/AC composite photocatalysts were successfully synthesized via a facile hydrolysis method combined with impregnation process. Photocatalytic oxidation of CH4 was systematically investigated over bare Ga2O3 and Ga2O3/AC composites in a fixed-bed tubular quartz reactor. The adsorption capacity and photocatalytic activity of Ga2O3/AC were greatly affected by the weight ratios of Ga2O3 to AC. 15%-Ga2O3/AC composites exhibited the highest photocatalytic activity and 91.5% of CH4 was decomposed after 150 min UV irradiation, which could be ascribed to strong adsorption ability and efficient separation of photo-generated electrons and holes. Besides, the photocatalytic oxidation of CH4 obeys pseudo-first-order kinetics and the cycled experiment indicates that Ga2O3/AC composites possess stable photocatalytic performance for CH4 oxidation. Moreover, the underlying photo-oxidation mechanism is also proposed on the basis of the results of ESR measurements and radicals scavenging experiments. The adsorbed CH4 molecules upon the surface of Ga2O3/AC were activated primarily via the reaction with photo-generated holes and the as-obtained methyl radicals were further oxidized by superoxide anion radicals. The introduction of AC can enhance the surface adsorption of CH4 molecules, the separation of photoinduced electron–hole pairs and the generation of active radical species, thus improving the photocatalytic performance of CH4 oxidation. Hence, the photocatalytic technique with Ga2O3/AC composites could be considered as a promising method toward the removal of low concentration CH4.5. Conflict of interest
There are no conflicts of interest to declare.Acknowledgements
This work was supported by the National Natural Science Foundation of China (21307027, 51574112, 51404100), the Program for Innovative Research Team in University of Ministry of Education of China (IRT_16R22), the Natural Science Foundation of Henan Province (14A440007), the Key Project of Chinese Ministry of Education (213022A), the Innovation Scientists and Technicians Troop Construction Projects of Henan Province (164100510013) and the Funding scheme for the young backbone teachers of higher education institutions in Henan Province (2015GGJS-071).Notes and references
- J. Schmale, D. Shindell, E. von Schneidemesser, I. Chabay and M. Lawrence, Nature, 2014, 515, 335–337 CrossRef CAS PubMed.
- T. V. Choudhary, S. Banerjee and V. R. Choudhary, Appl. Catal., A, 2002, 234, 1–23 CrossRef CAS.
- R. A. Alvarez, S. W. Pacala, J. J. Winebrake, W. L. Chameides and S. P. Hamburg, Proc. Natl. Acad. Sci. U. S. A., 2012, 109, 6435–6440 CrossRef CAS PubMed.
- J. Schmale, D. Shindell, E. V. Schnedemesser, I. Chabay and M. Lawrence, Nature, 2014, 515, 335–337 CrossRef CAS PubMed.
- D. A. Lashof and D. R. Ahuja, Nature, 1990, 344, 529–531 CrossRef CAS.
- P. Gélin and M. Primet, Appl. Catal., B, 2002, 39, 1–37 CrossRef.
- A. J. Zarur and J. Y. Ying, Nature, 2000, 403, 65–67 CrossRef CAS PubMed.
- S. Hu, R. J. Zeng, L. C. Burow, P. Lant, J. Keller and Z. G. Yuan, Environ. Microbiol. Rep., 2009, 1, 377–384 CrossRef CAS PubMed.
- A. Boetius, K. Ravenschlag, C. J. Schubert, D. Rickert, F. Widdel, A. Gieseke, R. Amann, B. B. Jørgensen, U. Witte and O. Pfannkuche, Nature, 2000, 407, 623–626 CrossRef CAS PubMed.
- J. P. Wei, B. S. Yu, J. Yang and J. Dai, Saf. Sci., 2012, 50, 873–877 CrossRef.
- N. Tian, Y. H. Zhang, X. W. Li, K. Xiao, X. Du, F. Dong, G. I. N. Waterhouse, T. R. Zhang and H. W. Huang, Nano Energy, 2017, 38, 72–81 CrossRef CAS.
- R. Y. Zhang, W. C. Wan, D. W. Li, F. Dong and Y. Zhou, Chin. J. Catal., 2017, 38, 313–320 CrossRef CAS.
- H. W. Huang, K. Xiao, Y. He, T. R. Zhang, F. Dong, X. Du and Y. H. Zhang, Appl. Catal., B, 2016, 199, 75–86 CrossRef CAS.
- X. Chen, X. Huang and Z. Yi, Chem.–Eur. J., 2014, 20, 17590–17596 CrossRef CAS PubMed.
- I. Dhada, P. K. Nagar and M. Sharma, Ind. Eng. Chem. Res., 2015, 54, 5381–5387 CrossRef CAS.
- C. F. Lien, M. T. Chen, Y. F. Lin and J. L. Lin, J. Chin. Chem. Soc., 2004, 51, 37–42 CrossRef CAS.
- S. I. In, M. G. Nielsen, P. C. K. Vesborg, Y. D. Hou, B. L. Abrams, T. R. Henriksen, O. Hansen and I. Chorkendorff, Chem. Commun., 2011, 47, 2613–2615 RSC.
- Z. Zhang, Y. Zhou, Y. Zhang, S. Zhou, J. Shi, J. Kong and S. Zhang, Dalton Trans., 2013, 42, 5004–5012 RSC.
- S. M. Chang and C. Y. Lee, Appl. Catal., B, 2013, 132–133, 219–228 CrossRef CAS.
- J. Taranto, D. Frochot and P. Pichat, Ind. Eng. Chem. Res., 2009, 48, 6229–6236 CrossRef CAS.
- Y. Yang, K. Chiang and N. Burke, Catal. Today, 2011, 178, 197–205 CrossRef CAS.
- J. Yang, X. X. Shen, Y. J. Li, L. Y. Bian, J. Dai and D. S. Yuan, ChemCatChem, 2016, 8, 1399–1409 CrossRef CAS.
- Y. K. Chih and M. Ch. Yang, J. Taiwan Inst. Chem. Eng., 2014, 45, 833–839 CrossRef CAS.
- H. Q. Wang, J. Z. Li, M. J. Zhou, Q. F. Quan, Z. Y. Lu, P. W. Huo and Y. S. Yan, J. Ind. Eng. Chem., 2015, 30, 64–70 CrossRef CAS.
- J. G. McEvoy and Z. S. Zhang, Appl. Catal., B, 2014, 160–161, 267–278 CrossRef.
- Y. Li, D. W. Li, Y. Rao, X. B. Zhao and M. B. Wu, Carbon, 2016, 105, 454–462 CrossRef CAS.
- A. Arami-Niya, T. E. Rufford and Z. H. Zhu, Carbon, 2016, 103, 115–124 CrossRef CAS.
- Y. D. Hou, X. C. Wang, L. Wu, Z. X. Ding and X. Z. Fu, Environ. Sci. Technol., 2006, 40, 5799–5803 CrossRef CAS PubMed.
- Y. D. Hou, L. Wu, X. C. Wang, Z. X. Ding, Z. H. Li and X. Z. Fu, J. Catal., 2007, 250, 12–18 CrossRef CAS.
- M. Q. Yang, N. Zhang and Y. J. Xu, ACS Appl. Mater. Interfaces, 2013, 5, 1156–1164 CAS.
- W. Z. Li, C. H. Liang, W. J. Zhou, J. S. Qiu, Z. H. Zhou, G. Q. Sun and Q. Xin, J. Phys. Chem. B, 2003, 107, 6292–6299 CrossRef CAS.
- S. Q. Jin, X. Wang, X. L. Wang, M. G. Ju, S. Shen, W. Z. Liang, Y. Zhao, Z. C. Feng, H. Y. Playford, R. I. Walton and C. Li, J. Phys. Chem. C, 2015, 119, 18221–18228 CAS.
- H. Y. Playford, A. C. Hannon, E. R. Barney and R. I. Walton, Chem.–Eur. J., 2013, 19, 2803–2813 CrossRef CAS PubMed.
- X. Zhang and L. Lei, J. Hazard. Mater., 2008, 153, 827–833 CrossRef CAS PubMed.
- X. F. Li, X. Z. Zhen, S. G. Meng, J. J. Xian, Y. Shao, X. Z. Fu and D. Z. Li, Environ. Sci. Technol., 2013, 47, 9911–9917 CrossRef CAS PubMed.
- L. W. Chang, J. W. Yeh, C. F. Li, M. W. Huang and H. C. Shih, Thin Solid Films, 2009, 518, 1434–1438 CrossRef CAS.
- H. D. Xiao, H. L. Ma, C. S. Xue, H. Z. Zhuang, J. Ma, F. J. Zong and X. J. Zhang, Mater. Chem. Phys., 2007, 101, 99–102 CrossRef CAS.
- H. Q. Wang, X. Q. Yang, J. Z. Zi, M. J. Zhou, Z. F. Ye, J. Z. Li, Q. F. Guan, P. Lv, P. W. Huo and Y. S. Yan, J. Ind. Eng. Chem., 2016, 35, 83–92 CrossRef CAS.
- D. D. Liu, Z. S. Wu, F. Tian, B. C. Ye and Y. B. Tong, J. Alloys Compd., 2016, 676, 489–498 CrossRef CAS.
- X. X. Chen, Y. P. Li, X. Y. Pan, D. Cortie, X. T. Huang and Z. G. Yi, Nat. Commun., 2016, 7, 12273 CrossRef CAS PubMed.
- K. Girijia, S. Thirumalairajan, G. S. Avadhani, D. Mangalaraj, N. Ponpandian and C. Viswanathan, Mater. Res. Bull., 2013, 48, 2296–2303 CrossRef.
- K. Girija, S. Thirumalairajan and D. Mangalaraj, Chem.–Eur. J., 2014, 236, 181–190 CAS.
- H. B. Fu, W. Zhang, S. C. Zhang, Y. F. Zhu and J. C. Zhao, J. Phys. Chem. B, 2006, 110, 3061–3065 CrossRef CAS PubMed.
- J. N. Schrauben, R. Hayoun, C. N. Valdez, M. Braten, L. Fridley and J. M. Mayer, Science, 2012, 336, 1298–1301 CrossRef CAS PubMed.
- S. C. Yan, Z. S. Li and Z. G. Zou, Langmuir, 2010, 26, 3894–3910 CrossRef CAS PubMed.
- Z. J. Wang, S. Ghasimi, K. Landfester and K. A. I. Zhang, Adv. Mater., 2015, 27, 6265–6270 CrossRef CAS PubMed.
- T. T. Zhang, W. Y. Lei, P. Liu, J. A. Rodriguez, J. G. Yu, Y. Qi, G. Liu and M. H. Liu, J. Phys. Chem. C, 2016, 120, 2777–2786 CAS.
- L. Wang and X. Z. Jiang, Environ. Sci. Technol., 2008, 42, 8492–8497 CrossRef CAS PubMed.
Footnote |
| † Electronic supplementary information (ESI) available: The schematic diagram of photocatalytic experimental apparatus; SEM image of bare Ga2O3 nanoparticles; the effect of light intensity on the photocatalytic oxidation of CH4; XRD pattern and SEM image of as-prepared 15%-TiO2/AC composite; the amount of produced CO2 during the photocatalytic oxidation of CH4; the comparison of XRD patterns and XPS spectra between freshly prepared and recycled 15%-Ga2O3/AC photocatalyst. See DOI: 10.1039/c7ra05692c |
| This journal is © The Royal Society of Chemistry 2017 |

