 Open Access Article
Creative Commons Attribution 3.0 Unported Licence
Red-emitting p53-protected gold nanoclusters and their screening of anti-tumor agents from Chinese medicine†
Xin-Xin Yuan,
Xiang-Yu Jia,
Hong-Wei Li ,
Xu Yu and
Yuqing Wu
 *
*
State Key Laboratory of Supramolecular Structure and Materials, Institute of Theoretical Chemistry, Jilin University, No. 2699 Qianjin Street, Changchun 130012, China. E-mail: yqwu@jlu.edu.cn
First published on 7th July 2017
Abstract
The tumor suppressor protein p53 has been a famous biomarker for many years both in biological and medical science. The core domain of it (residues 94–292) plays an important role for specific DNA binding. The involved 9 tyrosine and 9 cysteine residues provide the possibility to reduce and combine with gold to get metal nanoclusters such as BSA–AuNCs. In the present study, we develop a new method to synthesize red-emitting nanoclusters, p53–AuNCs, by using p53 core as both reductant and template. The synthetic procedure is one-step, straightforward and ecofriendly. In addition, the p53–AuNCs are found to be a sensitive fluorescence probe to detect and screen myricetin from Chinese medicine, providing a bridge between the kind of tumor-related protein and metallic nanoclusters. Particularly, these AuNCs are highly biocompatible as shown by cytotoxicity experiments and can be readily internalized by Hela cells, illustrating dual functions as a red-emitting material in bioimaging and a potential nanocarrier in drug delivery.
Introduction
Gold nanoclusters (AuNCs) have been considered as one of the most fascinating nano-materials. Owing to nontoxicity, good stability and high ability in bio-labelling and imaging, protein-stabilized AuNCs have attracted more and more attention recently. In comparison to those protected by small thiol compounds such as glutathione1 or dihydrolipoic acid,2 the AuNCs templated by proteins with large size have greater potential in application. Actually, a great deal of research for protein–AuNCs has been reported since BSA-protected gold nanoclusters were reported firstly in 2009 by Xie et al.3 Different kinds of proteins such as trypsin,4 lysozyme,5 pepsin,6 egg white7 etc. have been used to fabricate AuNCs with better or poorer luminescence properties. In extending their application, most of them showed high selectivity and/or sensitivity for the determination of proteins,8,9 biologically active small molecules such as dopamine,10 H2O2![[thin space (1/6-em)]](https://www.rsc.org/images/entities/char_2009.gif) 11,12 or metal ions such as Hg2+, Cu2+ and Fe3+.13–17 Intrinsically, the Au–S bond is vital for the fabrication of protein-protected AuNCs owing to the two important residues involved, tyrosine and cysteine. Generally, the former reduces Au(III) to Au(I) or Au(0) under alkaline condition while the latter forms stable Au–S encapsulating with the re-folded protein.18
11,12 or metal ions such as Hg2+, Cu2+ and Fe3+.13–17 Intrinsically, the Au–S bond is vital for the fabrication of protein-protected AuNCs owing to the two important residues involved, tyrosine and cysteine. Generally, the former reduces Au(III) to Au(I) or Au(0) under alkaline condition while the latter forms stable Au–S encapsulating with the re-folded protein.18
The tumor suppressor protein p53 is well known to be a master regulator responding to cell apoptosis, senescence, metabolism etc.,19,20 and it has been active for many years in the fight to prevent human cancer. However, the full-length p53 is unstable and can exist for only a very short time in a system.21 The p53 core domain (residues 94–292) plays an important role in the activity for specific DNA binding22 and is quite stable even in vitro.23,24 As 9-cysteine and 9-tyrosine residues are involved, it is possible to reduce Au(III) to Au(I) and/or Au(0); then combine with Au(I) via Au–S bond to protect the Au(0) core; and finally to get metal nanoclusters being similar to BSA–AuNCs. Therefore, the p53 core is a potential candidate to prepare fluorescent nanoclusters for medical screening and/or clinical diagnosis in the future.
In addition, metal nanoclusters emitting in the red and/or infrared region25,26 undoubtedly have low toxicity, ultra-stability and strong significance in biological investigations as bio-probes in imaging.27,28 In the present study, we will report a new improved method to synthesize p53-protected gold nanoclusters, p53–AuNCs. The synthetic procedure is one-step, straightforward and ecofriendly. Particularly, the products are red-emitting and will have potential application in biology.
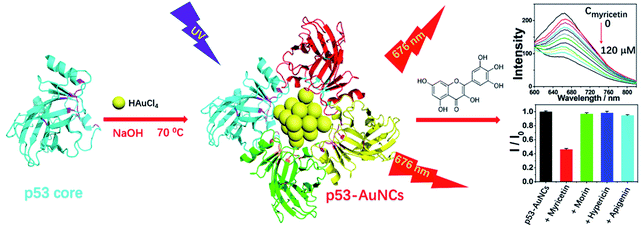
Furthermore, cancer, having been fought for many years, is still a serious threat to human health. Among various kinds of anti-tumor medicines, myricetin29,30 has shown great potential against human colon cancer, skin carcinoma, hepatocarcinoma etc. Thus, to bring myricetin into tumor cells will be critical. Of course, binding of it to a carrier tightly is the precondition, and exploring a fluorescence probe to monitor the process is equally important. Though several methods such as high performance liquid chromatography (HPLC)31,32 have been reported for the detection of this flavonoid molecule, the disadvantages of a complicated process and expensive equipment should be overcome. Therefore, in this study the newly obtained p53–AuNCs are explored for sensitive determination of myricetin. Therefore, the present study will be meaningful to extend the applications of protein-protected nanoclusters to the field of medical detection. The synthesis method of p53–AuNCs and the results of their screening of myricetin are shown in Scheme 1.
Methods
Reagents and materials
HAuCl4, NaOH, NaCl, KCl, Na2HPO4·12H2O and KH2PO4 were purchased from Beijing Chemical Factory (China) with purities of more than 99%. Chinese medicines morin, myricetin, hepericin and apigenin were bought from TCI (Shanghai) Development Co. Ltd with purities higher than 99%. Ultrapure water obtained from a Millipore Milli-Q water purification system was used throughout the experiments. The protein of p53 core (residues 94–292) was constructed in fusion with a GST tag, and expressed according to a reported method.33 After purification with a GST column and size exclusion chromatography, SDS-PAGE was performed. 10× phosphate buffer solution (PBS) was prepared with 80.0 g NaCl, 2.0 g KCl, 35.8 g Na2HPO4·12H2O and 2.4 g KH2PO4 and then stored at room temperature for further use.Synthesis of red-emitting p53–AuNCs
At room temperature, 200 μL of a 1 mM aqueous solution of NaOH was put into 1 ml of 20 mM PBS (pH = 7.4) containing 20 mg p53 core protein. After that, 300 μL of a 10 mM HAuCl4 solution was mixed with it under vigorous stirring. In 2 min the reaction solution turned from yellow to colorless. Afterwards, the whole solution was allowed to react at 37, 55, 70 and 80 °C, separately, for 0–24 h. Along with the reaction going on, 50 μL samples were taken out from time to time. After diluting to 500 μL in water it was monitored by fluorescence spectroscopy. Meanwhile, both colorimetric and luminescence measurements (λex = 365 nm) were made in parallel to monitor the formation of nanoclusters.After the reaction was stopped, dialysis was performed with a membrane of 10 kDa for 24 h to remove the redundant reactants, and particularly to refold the protein to its natural state as much as possible. Finally, the products were stored at 4 °C for further characterization and applications.
Instruments and characterization
A Shimadzu (Japan) RF-5301 fluorescence spectrophotometer was used to obtain all fluorescence spectra. UV-visible absorption spectra of p53–AuNCs were recorded with a Shimadzu UV-3600 spectrophotometer, being performed in 1 cm × 1 cm quartz cuvettes for all samples. Time-resolved fluorescence spectra were obtained with an FLS980 (Edinburgh Instruments), where the excitation wavelength was fixed at 375 nm. X-ray photoelectron spectroscopy (XPS) was performed with a monochromic X-ray source (Al Kα line, 1486.6 eV) combined with an ESCALAB 250 spectrometer. The absolute photoluminescence quantum yield was measured by using a Quantaurus-QY (Edinburgh Instruments) including an excitation light source being composed of a Xe lamp and monochromator. Transmission electron microscopy (TEM) measurements of p53–AuNCs were conducted with a JEM-2200FS (Jeol Ltd, Japan) working with an accelerating voltage of 200 kV. Cell fluorescent images were recorded through a laser confocal inverted microscope (FV1000, Olympus, Japan).Testing and screening of anti-tumor agents
The potential anti-tumor agents morin, myricetin, hepericin and apigenin were dissolved in DMSO firstly to get an initial concentration of 50 mM each. Then 1 μL of each solution was added to 1 ml aqueous solution containing p53–AuNCs (0.01 mg ml−1). Meanwhile, 1 μL DMSO was added to an aqueous solution containing p53–AuNCs (0.01 mg ml−1) but no flavonol as a control experiment. For each sample, after mixing and an incubation of 80 min, the fluorescence spectrum was measured 3 times with an excitation wavelength of 420 nm at room temperature.Cell imaging
In order to verify whether the obtained p53–AuNCs can enter into cells or not, confocal microscopy was used for the corresponding fluorescence imaging. The culture environment for Hela cells was fixed at 500 μL freshly prepared DMEM with 10% serum, being surrounded with 5% CO2 for 16 h at 37 °C. Following that, 500 μL of another kind of culture medium containing 0.6 mg ml−1 p53–AuNCs was substituted to the cells in the same environment and then kept for 3 h. Ultimately, the Hela cells were fixed with 4% paraformaldehyde and observed via cell confocal inverted fluorescence imaging photographs with excitation at 405 nm and emission ranging from 620 to 700 nm.Results and discussion
Synthesis of p53–AuNCs and condition optimization
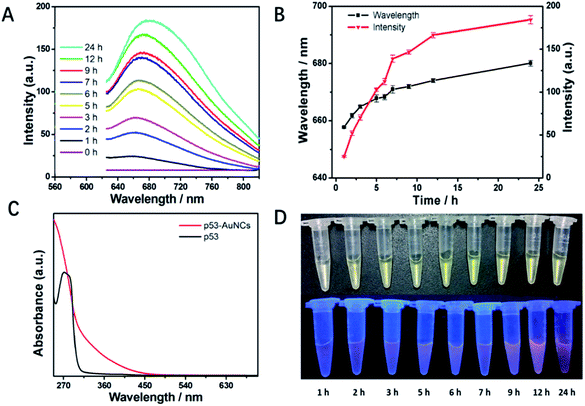
Fig. 1A shows the time-dependent luminescence spectra to monitor the synthesis process of p53–AuNCs. Under excitation at 420 nm the mixture of final concentration of 2 mM HAuCl4 and 13.3 mg ml−1 p53 core in PBS (pH = 12.0) shows just a flat line at first. However, 1 h later being heated at 70 °C a weak emission band at 656 nm appears (Fig. 1A), being proposed as the spontaneous luminescence of gold–p53 complex or just the bare AuNCs. Of note, with increasing reaction time the intensities increase continually showing stronger luminescence emission (red line in Fig. 1B). Simultaneously, the wavelength of the emission peak changes from 656 to 676 nm with increasing time up to 24 h (black line in Fig. 1B). Meanwhile, the UV-vis absorption spectra of p53 and the final product of p53-AuNCs are measured and compared (Fig. 1C). The absence of a peak in the 450–800 nm range indicates no big nanoparticle of gold with plasmon absorption is formed in the process. In addition, both the colorimetric and luminescence photographs (λex = 365 nm) in monitoring the reaction process in Fig. 1D supply visual observations of the above process, where indeed no great change for the colorimetric but increasing brightness for the luminescence photographs are seen with reaction time. Of note, the plots in Fig. 1B demonstrate more clearly the changing tendency both for luminescence intensity and peak position at the same time. After that, the products were subjected to dialysis to remove the excessive reductants, particularly to refold the protected protein to its natural state, and finally to recover its biological function as much as possible.Moreover, in order to obtain nanoclusters with better luminescence property, both the molar ratio of HAuCl4 to p53 core protein and the reaction temperature were optimized, and the results are shown in Fig. S2A and B,† respectively. At an initial concentration of 10 mM HAuCl4 the presence of 5 mg ml−1 p53 results in only a weak emission at 665 nm. The addition of more p53 increases the luminescence intensity obviously, being almost saturated at around 20 mg ml−1 protein. So the ratio of 10 mM HAuCl4 and 20 mg ml−1 p53 core is chosen as the best, at least for the present condition. Then, fixing this recipe we tried to perform the synthesis of p53–AuNCs at 37 °C, mimicking the procedure and condition for the fabrication of AuNCs@BSA reported before.3 However, for the first 12 h reaction time almost no luminescence can be detected for the products; even after 24 h only very weak emission appears at 662 nm (Fig. S2B†). That is, the fabrication of p53–AuNCs almost failed when following the conditions for AuNCs@BSA synthesis. In considering the extreme stability of the p53 core, then we increased the reaction temperature up to 55, 70 and 80 °C, successively, to fully denature the protein and expose the buried residues of cysteine and tyrosine. After further treatments of dialysis to refold the protein and remove the abundant reactants, finally the products obtained at 70 °C emit strongest with similar peak position as those obtained at 37 and 55 °C.
However, for those products obtained at 80 °C the emission intensity decreases in a broader but redder peak obviously. Therefore, higher temperature may benefit the production of red emission but not be good for improving the luminescence efficiency, which may be because of too fast a reaction and deposition of gold atoms in particles at high temperature.34 In addition, as a control experimental result, Fig. S3† shows that p53 with NaOH cannot form fluorescent material in the absence of HAuCl4. Taken all together, this indicates the best conditions to synthesize p53–AuNCs are 10 mM HAuCl4 and 20 mg ml−1 p53 core, in an alkaline solution (pH 12.0), being heated at 70 °C for 24 h. Finally, the obtained AuNCs show medium luminescence intensity at 676 nm. That is, new nanoclusters with red emission, being protected by a tumor-related protein, p53, are achieved in the present study.
Characterization of p53–AuNCs
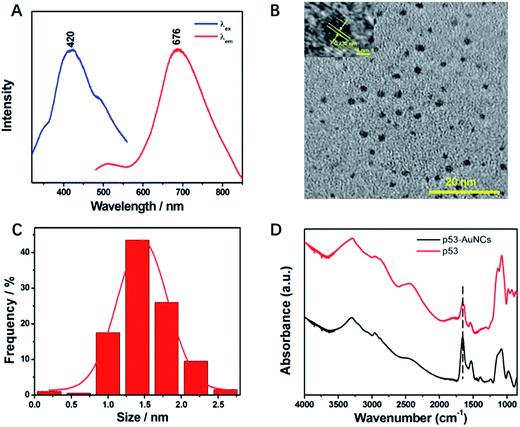
Of note, the luminescence of p53–AuNCs appears at 676 nm under an excitation of 420 nm (Fig. 2A). It is of interest to observe so wide a Stokes shift of 256 nm for the newly developed AuNCs, which will be perfect for minimizing the overlap between the excitation and emission bands and thereby reduce the loss of self-absorption in practice.35 In addition, the absolute quantum yield36,37 of the optimized p53–AuNCs is measured to be 2.5%. Although this value is not very high, it is noted that a probe with >1% absolute quantum yield is qualified for NIR imaging in vivo.38 Moreover, the tolerance of the luminescent p53–AuNCs toward high ionic strength was tested. As shown in Fig. S4,† even in the presence of as high a concentration as 1.0 M NaCl the luminescence spectrum of the p53–AuNCs (0.01 mg ml−1) is kept quite constant, showing the high tolerance of them to salt and the good potential to be used as a fluorescence probe in biological systems. Furthermore, the luminescence responses of p53–AuNCs to different pH and buffer solutions have been tested and the results are shown as Fig. S5.† p53–AuNCs stay stable in alkaline conditions; but the luminescence is quenched a little bit in acid environment while it is strongest in neutral one (pH 7.0). However, the luminescence intensity of p53–AuNCs is pretty stable in different kinds of buffer solution such as PBS, Tris–HCl and HEPES at pH 7.4. To further verify the p53-protected nanoclusters, TEM imaging was then used to assay the size distribution and morphology of the metal core (Fig. 2B). The particles are well dispersed and the statistical mean diameter is 1.4 nm (Fig. 2C) based on 200 individual particles (Fig. S6A†). In addition, the energy dispersive spectrum presented in Fig. S6B† confirms well the high content of Au in the particles. Therefore, the good homogeneity of size for p53–AuNCs adds strong luster to the materials in practical applications. Moreover, infrared (IR) spectroscopy was used to characterize the secondary structure of protein before and after binding with AuNCs. The band of amide I, primarily C![[double bond, length as m-dash]](https://www.rsc.org/images/entities/char_e001.gif) O stretching, is located in the 1600–1700 cm−1 region, and that of amide II, C–N stretching, is situated at 1548 cm−1 (Fig. 2D).
O stretching, is located in the 1600–1700 cm−1 region, and that of amide II, C–N stretching, is situated at 1548 cm−1 (Fig. 2D).
The wavenumbers and relative intensity of bands between p53 and p53–AuNCs do not change much, indicating the structure of the capping protein for AuNCs is almost kept, and therefore showing great potential of the newly developed nanomaterial in biological investigations in future.
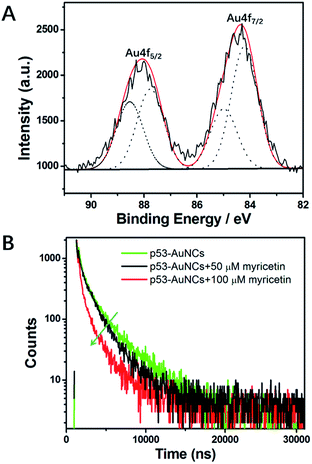
Then XPS was applied to evaluate the oxidation states of Au in the material protected by p53 core. As shown in Fig. 3A, a freeze-dried sample is characterized by gold clearly. The results support that for the valence of gold there exists two fitting peaks at 88.1 eV and 84.2 eV, respectively, corresponding to binding energies of Au4f5/2 and Au4f7/2 in Au atoms. Among them, Au(0) accounts for 57% of the total Au atoms, which confirms well the reduced HAuCl4 and indicates a stable nanocluster for further research. Moreover, as shown in the time-resolved fluorescence spectrum (Fig. 3B), the p53–AuNCs are of two components of a short lifetime τ1 = 0.6262 μs (16.64%) and a long lifetime τ2 = 3.136 μs (83.36%), with a χ2 of 1.171 based on the curve-fitting of the decay curve. The dominant long-lifetime component has a value comparable to that found by other researchers for AuNCs–BSA,39–41 which was attributed to metal–metal and metal–ligand charge transfer and to the oxidation state of the metal.40
Detection and screening of myricetin using p53–AuNCs
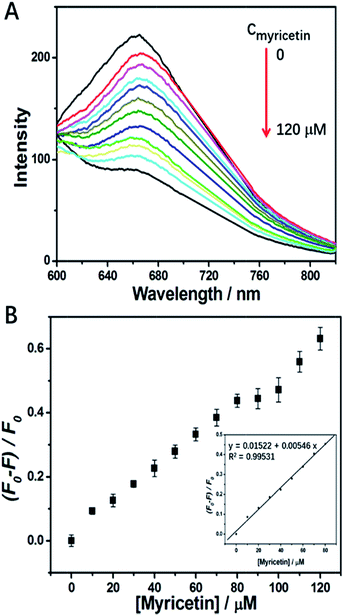
Myricetin, as a representative flavonol, has been demonstrated to exhibit anti-tumor effects against various cancers.42–45 For example, quite recently Huang et al.44 reported myricetin inhibited proliferation of cisplatin-resistant cancer cells through a p53-dependent apoptotic pathway. Duerksen-Hughes et al.45 reported flavonol such as myricetin and imidazole derivatives blocked HPV16 E6 activities and reactivated apoptotic pathways in HPV+ cells. Thus, it will be meaningful to discover a satisfactory method to bring myricetin into tumor cells. Of course, binding of it to a carrier tightly is the precondition, and a fluorescence probe to monitor such binding is necessary. However, up to now a method for such purposes has not been fully developed. Luckily, we have found that p53–AuNCs can function as a desired probe with quenching response in the red region to a micro-molar level of myricetin, which supplies a fluorescence platform to detect myricetin and screen it from other flavonols, and also possibly to carry it into cells.Fig. S7A† shows myricetin has the ability to integrate with the as-prepared p53–AuNCs in showing strong quenching of luminescence, while three other flavonols do not. Therefore, p53–AuNCs can be used to detect myricetin and, particularly, to distinguish it well from other flavonols via the induced quenching response. Fig. S7B† shows the corresponding fluorescence spectra of the flavonol agents alone being excited at 420 nm. Generally the strong emission of morin as well as the medium emission from myricetin make it possible to be affected in their detection. However, being far away from them, the unique emission of p53–AuNCs in the red region overcomes this problem well. Therefore, it is the red emission of p53–AuNCs that establishes a platform to detect myricetin and differentiate it from other flavonols. While for materials with blue and/or green emission it would be difficult to achieve this. Moreover, in order to improve the assay we optimize the response time of the p53–AuNCs to myricetin in water. The results shown in Fig. S8† indicate that 80 min after adding myricetin the emission intensity of p53–AuNCs becomes stable, but before that it is quenched gradually with time. Therefore, 80 min is finally chosen as an incubation time to ensure a thorough binding of p53–AuNCs to myricetin. Meanwhile, a time as long as 80 min for saturation of the binding also suggests the strength of such interaction may not be very great for the present condition. Therefore, the fluorescence responses of p53–AuNCs to myricetin are then detected after an incubation of them together for 80 min. Fig. 4 suggests that the corresponding fluorescence intensity of p53–AuNCs depends on the concentration of myricetin from 0 to 120 μM, where a linear relationship is observed in the range of 0–80 μM (inset in Fig. 4B). Meanwhile, the limit of detection (LOD) is evaluated to be 9.81 μM for 0.01 mg ml−1 p53–AuNCs in water.
The LOD achieved here is not as good as that from HPLC,31 but the assay process is favorable for being more simple, convenient and direct toward myricetin. Therefore, it shows potential in application for further medical monitoring.
Finally, the fluorescence quenching mechanism of p53–AuNCs by myricetin is explored. In principle, the fluorescence quenching in this system could occur by the nonfluorescent ground-state complex, aggregation of AuNCs, energy transfer or electron transfer. Among them, electron transfer is most likely in the quenching process. Fig. S9† shows the UV-visible absorption spectra of p53, myricetin and myricetin in the presence of different concentrations of p53 (1.0, 1.5 mM). A new absorption peak at ∼380 nm appears and red-shifts with more p53 addition (red, green and blue line, Fig. S9†), indicating myricetin is combined with p53 in forming a complex first and then aggregation of AuNCs. Furthermore, the TEM image in Fig. S10† of p53–AuNCs and myricetin provides direct evidence of the induced aggregation of AuNCs. This is further examined by using fluorescence decay kinetics. The time-resolved decay curves of 0.6 mg ml−1 p53–AuNCs in the presence of 50 μM (black line) and 100 μM (red line) myricetin were measured and are compared with that of p53–AuNCs alone in Fig. 3B. The fluorescence decay curves of all samples can be fitted well using a biexponential function, and the obtained results are listed and compared in Table S1.† It is calculated that after mixing with myricetin both the lifetime and its proportion change largely. For example, the long lifetime of p53–AuNCs is decreased from 3.136 × 10⁻⁶ s (83.36%) to 2.002 × 10⁻⁶ s (73.68%) in the presence of myricetin (50 μM). When more myricetin (100 μM) is added, such changing tendency is continued, as shown in Table S1.† Previous reports suggest that the dominant long-lifetime component from BSA–AuNCs arises from metal–metal and metal–ligand charge transfer and from the oxidation state of the metal.40,41 The decrease of them upon myricetin binding suggests a dynamic quenching of p53–AuNC luminescence.41 Also, the addition of myricetin induces the average lifetime to change from 3.040 × 10⁻⁶ s to 1.805 × 10⁻⁶ s finally for p53–AuNCs. So, this suggests the binding site of myricetin on p53 may be located close to the metal core; an in-depth investigation will be performed to reveal this in the future.
Luminescence images of p53–AuNCs in Hela cells
To assess the capability of red-emitting p53–AuNCs to serve as a possible bio-imaging material, we chose Hela cells for such a purpose and incubated them with p53–AuNCs for 3 h at 37 °C. As shown in Fig. 5 the fluorescence imaging of Hela cells (left) presents red emission successfully with a final concentration of 0.6 mg ml−1 for p53–AuNCs in the medium. And the corresponding bright field (middle) and overlay (right) images of them with cells confirm well the presence of p53–AuNCs inside cells. In contrast, two control experiments with Hela cells in the absence and presence of p53 (2 mg ml−1), without the participation of p53–AuNCs, show almost no fluorescence (Fig. S11†). Therefore, we can use these nanoclusters protected by p53 as an eco-friendly way for bioimaging. In addition, we have also used E. coli as a model to evaluate the cytotoxicity of p53–AuNCs based on the optical density (OD) at 600 nm (Fig. S12A†). The slight difference observed between two curves obtained in the absence and presence of 0.6 mg ml−1 p53–AuNCs in the medium indicates no obvious toxicity of p53–AuNCs on E. coli growth. Meanwhile, MTT assay with different concentrations of p53–AuNCs (Fig. S12B†) shows 80% Hela cells can survive well at a concentration of 3.6 mg ml−1 of p53–AuNCs.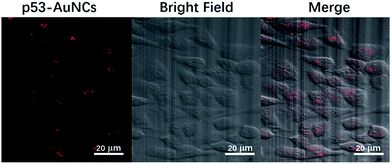 | ||
| Fig. 5 (Left) Fluorescence image of p53–AuNCs in Hela cells after 3 h incubation. (Middle) Bright field image of Hela cells. (Right) The overlay of the bright field and fluorescence images. | ||
Conclusions
In summary, we have developed a simple and fast method to synthesize p53-protected Au nanoclusters, p53–AuNCs. The synthesized nanoclusters exhibit desired properties of red emission, small size (<2 nm), large Stokes shift (256 nm), high tolerance to salt and pH, and especially selective fluorescence quenching by anti-tumor agent myricetin. Therefore, the newly developed p53–AuNCs can be used to detect and screen myricetin well from other flavonols, which will be meaningful for further cancer research. Particularly, these AuNCs are highly biocompatible as shown by cytotoxicity experiments and can be readily internalized by Hela cells, illustrating dual functions as a red-emitting material in bioimaging and a potential nanocarrier in drug delivery. Therefore, the present study affords a red-emitting cell marker and it should be enlightening for biochemical research in the future.Acknowledgements
We greatly appreciate the financial support from the projects of NSFC (no. 21373101, 21003061 and 91027027) and the Innovation Program of the State Key Laboratory of Supramolecular Structure and Materials, Jilin University.Notes and references
- Y. Negishi, K. Nobusada and T. Tsukuda, J. Am. Chem. Soc., 2005, 127, 5261–5270 CrossRef CAS PubMed.
- L. Shang, L. Yang, F. Stockmar, R. Popescu, V. Trouillet, M. Bruns, D. Gerthsen and G. U. Nienhaus, Nanoscale, 2012, 4, 4155–4160 RSC.
- J. Xie, Y. Zheng and J. Y. Ying, J. Am. Chem. Soc., 2009, 131, 888–889 CrossRef CAS PubMed.
- H. Kawasaki, K. Yoshimura, K. Hamaguchi and R. Arakawa, Anal. Sci., 2011, 27, 591 CrossRef CAS PubMed.
- W. Y. Chen, J. Y. Lin, W. J. Chen, L. Luo, E. Wei-Guang Diau and Y. Chen, Nanomedicine, 2010, 5, 755–764 CrossRef CAS PubMed.
- H. Kawasaki, K. Hamaguchi, I. Osaka and R. Arakawa, Adv. Funct. Mater., 2011, 21, 3508–3515 CrossRef CAS.
- J. Tian, L. Yan, A. Sang, H. Yuan, B. Zheng and D. Xiao, J. Chem. Educ., 2014, 91, 1715–1719 CrossRef CAS.
- Y. Wang, Y. Wang, F. Zhou, P. Kim and Y. Xia, Small, 2012, 8, 3769–3773 CrossRef CAS PubMed.
- H. Lin, L. Li, C. Lei, X. Xu, Z. Nie, M. Guo and S. Yao, Biosens. Bioelectron., 2013, 41, 256–261 CrossRef CAS PubMed.
- Y. Tao, Y. Lin, J. Ren and X. Qu, Biosens. Bioelectron., 2013, 42, 41–46 CrossRef CAS PubMed.
- L. Shang and S. Dong, Anal. Chem., 2009, 81, 1465–1470 CrossRef CAS PubMed.
- L. Shang, H. Chen, L. Deng and S. Dong, Biosens. Bioelectron., 2008, 23, 1180–1184 CrossRef CAS PubMed.
- J. Xie, Y. Zheng and J. Y. Ying, Chem. Commun., 2010, 46, 961–963 RSC.
- B. C. Ye and B. C. Yin, Angew. Chem., Int. Ed., 2008, 47, 8386–8389 CrossRef CAS PubMed.
- G. Zhang, Y. Li, J. Xu, C. Zhang, S. Shuang, C. Dong and M. M. Choi, Sens. Actuators, B, 2013, 183, 583–588 CrossRef CAS.
- Y. Chen, Y. Wang, C. Wang, W. Li, H. Zhou, H. Jiao, Q. A. Lin and C. Yu, J. Colloid Interface Sci., 2013, 396, 63–68 CrossRef CAS PubMed.
- H. J. Annie, H. C. Chang and W. T. Su, Anal. Chem., 2012, 84, 3246–3253 CrossRef PubMed.
- L. Shang, S. Dong and G. U. Nienhaus, Nano Today, 2011, 6, 401–418 CrossRef CAS.
- A. J. Levine, J. Momand and C. A. Finlay, Nature, 1991, 351, 453 CrossRef CAS PubMed.
- D. W. Meek, Biochem. J., 2015, 469, 325–346 CrossRef CAS PubMed.
- S. W. Lowe and A. W. Lin, Carcinogenesis, 2000, 21, 485–495 CrossRef CAS PubMed.
- Y. Cho, S. Gorina, P. D. Jeffrey and N. P. Pavletich, Science, 1994, 265, 346–355 CAS.
- A. C. Joerger and A. R. Fersht, Oncogene, 2007, 26, 2226–2242 CrossRef CAS PubMed.
- G. Selivanova, Curr. Cancer Drug Targets, 2004, 4, 385–402 CrossRef CAS PubMed.
- F. Aldeek, M. A. H. Muhammed, G. Palui, N. Zhan and H. Mattoussi, ACS Nano, 2013, 7, 2509–2521 CrossRef CAS PubMed.
- M. A. H. Muhammed, F. Aldeek, G. Palui, L. Trapiella Alfonso and H. Mattoussi, ACS Nano, 2012, 6, 8950–8961 CrossRef CAS PubMed.
- H. Wang, J. Liu, A. Han, N. Xiao, Z. Xue, G. Wang and D. Ding, ACS Nano, 2014, 8, 1475–1484 CrossRef CAS PubMed.
- J. Liu, G. Feng, D. Ding and B. Liu, Polym. Chem., 2013, 4, 4326–4334 RSC.
- M. E. Kim, T. K. Ha, J. H. Yoon and J. S. Lee, Anticancer Res., 2014, 34, 701–706 CAS.
- H. Huang, A. Y. Chen, Y. Rojanasakul, X. Ye, G. O. Rankin and Y. C. Chen, J. Funct. Foods, 2015, 15, 464–475 CrossRef CAS PubMed.
- S. H. Häkkinen, S. O. Kärenlampi, I. M. Heinonen, H. M. Mykkänen and A. R. Törrönen, J. Agric. Food Chem., 1999, 47, 2274–2279 CrossRef.
- J. Xia, A. Kotani, H. Hakamata and F. Kusu, J. Pharm. Biomed. Anal., 2006, 41, 1401–1405 CrossRef CAS PubMed.
- J. M. Huibregtse, M. Scheffner and P. M. Howley, EMBO J., 1991, 10, 4129 CAS.
- Y. Yu, Q. Zhang, Q. Yao, J. Xie and J. Y. Lee, Acc. Chem. Res., 2014, 47, 3530–3540 CrossRef CAS PubMed.
- X. Le Guével, B. Hötzer, G. Jung and M. Schneider, J. Mater. Chem., 2011, 21, 2974–2981 RSC.
- P. Zhang, J. Lan, Y. Wang and C. Z. Huang, Biomaterials, 2015, 36, 26–32 CrossRef CAS PubMed.
- H. H. Deng, F. F. Wang, X. Q. Shi, H. P. Peng, A. L. Liu, X. H. Xia and W. Chen, Biosens. Bioelectron., 2016, 83, 1–8 CrossRef CAS PubMed.
- Y. Wang and X. P. Yan, Chem. Commun., 2013, 49, 3324–3326 RSC.
- L. Shang, N. Azadfar, F. Stockmar, W. Send, V. Trouillet, M. Bruns and G. U. Nienhaus, Small, 2011, 7, 2614–2620 CrossRef CAS PubMed.
- X. L. Guével, B. Hötzer, G. Jung, K. Hollemeyer, V. Trouillet and M. Schneider, J. Phys. Chem. C, 2011, 115, 10955–10963 Search PubMed.
- B. Aswathy and G. Sony, Microchem. J., 2014, 116, 151–156 CrossRef CAS.
- S. A. Hundahl, I. D. Fleming, A. M. Fremgen and H. R. Menck, Cancer, 1998, 83, 2638–2648 CrossRef CAS PubMed.
- M. E. Kim, T. K. Ha, J. H. Yoon and J. S. Lee, Anticancer Res., 2014, 34, 701–706 CAS.
- H. Huang, A. Y. Chen, X. Ye, B. Li, Y. Rojanasakul, G. O. Rankin and Y. C. Chen, Int. J. Oncol., 2015, 47, 1494–1502 CAS.
- C. H. Yuan, M. Filippova, J. L. Krstenansky and P. J. Duerksen-Hughes, Cell Death Dis., 2016, 7, 2060 CrossRef PubMed.
Footnote |
| † Electronic supplementary information (ESI) available: Additional SDS-PAGE results of p53 core, fluorescence spectra and TEM images. See DOI: 10.1039/c7ra05630c |
| This journal is © The Royal Society of Chemistry 2017 |

