 Open Access Article
Creative Commons Attribution 3.0 Unported Licence
Modification of the intermediate band and thermoelectric properties in Se-doped CoSbS1−xSex compounds†
Yonghui Youa,
Xianli Su*a,
Wei Liua,
Yonggao Yana,
Tiezheng Hua,
Ctirad Uherb and
Xinfeng Tang *a
*a
aState Key Laboratory of Advanced Technology for Materials Synthesis and Processing, Wuhan University of Technology, Wuhan 430070, China. E-mail: suxianli@whut.edu.cn; tangxf@whut.edu.cn
bDepartment of Physics, University of Michigan, Ann Arbor, MI 48109, USA
First published on 10th July 2017
Abstract
Paracostibite (CoSbS), a naturally occurring mineral composed of earth abundant elements, is a newly developed and environmentally friendly thermoelectric material for medium temperature power generation applications, and has attracted considerable attention. In this work, in order to study the influence of Se doping on the site of S, CoSbS1−xSex (0 ≤ x ≤ 0.09) compounds were synthesized by vacuum melting and annealing and compacted by spark plasma sintering. Alloying S with Se decreased the band gap and the impurity activation energy. Moreover, Se substitution on the site of S not only improved the electronic transport properties, but it also dramatically suppressed the thermal conductivity. The maximum power factor as high as 1.1 × 10⁻³ Wm−1 K−2 was achieved in CoSbS0.99Se0.01 at 900 K. Due to the improved power factor and the decreased thermal conductivity, the ZT reached 0.26, exceeding the figure of merit of undoped CoSbS by about 37%.
Introduction
Thermoelectric (TE) materials are able to convert heat into electricity by purely solid-state means and have drawn widespread attention in recent years.1 Generally, the thermoelectric performance is characterized by the dimensionless figure of merit ZT = α2σT/(κL + κc), where α is the Seebeck coefficient, σ is the electrical conductivity, κL is the lattice thermal conductivity, κc is the electronic thermal conductivity and T is the absolute temperature.2,3 An excellent thermoelectric material should simultaneously possess high electrical conductivity, large Seebeck coefficient and low thermal conductivity. However, the above mentioned transport parameters are mutually interdependent and it is a challenge to improve the overall ZT value. So far, numerous investigations have focused on band structure modifications,4,5 trying to find new thermoelectric materials, creating nanometer-scale secondary phases in the matrix,6–8 and making use of hierarchical architectures9–12 in order to improve the thermoelectric performance. Although these approaches have greatly improved thermoelectric properties of materials such as Bi2Te3 (ref. 13,14), bulk chalcogenides15,16 and other thermoelectrics,17,18 many of them are not suitable for large-scale applications given the toxicity of their constituent elements, limited availability, complex synthesis processing and poor stability at high temperatures. Thus, it is important to develop new, efficient, inexpensive and environmentally benign thermoelectric materials. During the past few years, certain minerals consisting of transition metal chalcogenide compounds have attracted extensive attention for their potential as prospective TE materials. Such minerals are earth abundant, environmentally friendly, and several of them are narrow band gap semiconductors.19–24Paracostibite (CoSbS) is one of such minerals, first found in Broken Hill, N.S.W., Australia and the Red Lake area of Ontario in Canada and reported on by Cabri et al.25 It crystallizes in the orthorhombic structure with the space group 61 (Pbca), having a band gap around 0.75 eV,26 and a relatively high Seebeck coefficient at medium temperatures. Unfortunately, the thermoelectric performance of the pristine CoSbS compound is poor due to its intrinsically low carrier concentration (n ∼ 1017 cm−3). Many investigations have focused on devising a synthesis process to yield a high purity single phase CoSbS compound and on optimization of the carrier concentration through doping with Ni or Te to enhance its thermoelectric properties.26–31 However, a strong ionic bond between Co and S, having the origin in a large electronegativity difference between S and Co atoms, leads to the intrinsically low carrier mobility (μ ∼ 4 cm2 V−1 s−1) and high thermal conductivity. This has hindered any significant improvement of the TE properties. Thus, decreasing the ionic character of the Co–S bond and weakening the effect of deep impurity levels on the transport properties are crucial steps towards improving the TE performance of CoSbS-based compounds.
In this work, we have synthesized a series of Se-doped CoSbS1−xSex (x = 0–0.09) compounds by vacuum melting and annealing followed by SPS processing, and we evaluate their structural and transport properties.
Experimental
To avoid the influence of commonly found impurities (Fe, Ni, As) in mineral forms of paracostibite and to study its intrinsic properties, we synthesized pure CoSbS and investigated the effect of Se dopants on the structural and transport properties.Appropriate amounts of cobalt (shot, 99.99%), antimony (shot, 99.99%), sulphur (pieces, 99.99%), and Se (small chunks, 99.99%) were weighed according to the stoichiometric composition of CoSbS1−xSex (x = 0–0.09). The charge was loaded into a quartz tube and then sealed under vacuum. The tubes were placed in the furnace and heated up to 1273 K over a period of 10 h. After soaking at 1273 K for 30 h, the samples were quenched in supersaturated salt water and then annealed at 973 K for 3 days. Following cooling down to a room temperature, the obtained ingots were pulverized and compacted by the spark plasma sintering process with a pressure of 65 MPa at 973 K for 8 minutes.
The phase composition of the samples was determined by powder X-ray diffraction (XRD, Empyrean, PANalytical) with Cu Kα radiation. The chemical composition of the samples was characterized by electron probe microanalysis (EPMA, JXA-8230/INCAX-ACT). The electrical conductivity and the Seebeck coefficient were measured simultaneously using the commercial equipment (ZEM-3, Ulvac Riko, Inc.) by the standard four-probe method under He atmosphere. The thermal diffusivity λ was obtained by a laser flash technique on a Netzsch LFA-457 apparatus. The heat capacity Cp at constant pressure was measured by a comparison method with a DSC (TA Instrument Q20). The experimental density d was evaluated by the Archimedes method. The thermal conductivity κ was then calculated using the formula κ = λCpd. All physical properties were measured in the temperature range of 300–900 K. Uncertainties in measurements of the electrical conductivity, Seebeck coefficient and thermal conductivity are estimated as ±5%, ±2% and ±5%, respectively.
Results and discussion
Phase composition and lattice constant
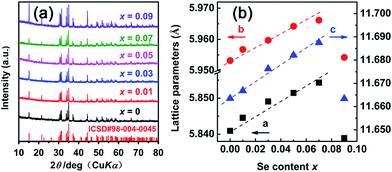
Fig. 1(a) shows XRD patterns of the CoSbS1−xSex (x = 0–0.09) compounds. The patterns show that all compounds are single phase materials with all peaks corresponding to the peaks of the CoSbS compound that crystallizes in the orthorhombic structure, space group 61 (Pbca). Even for the highest Se doping content x = 0.09, there is no trace of any secondary phase within the XRD detection limit. Fig. 1(b) displays the lattice constants of the sintered samples as a function of the content of Se calculated by the Rietveld refinement method through a program called Fullproof. The lattice parameters increase linearly with the increasing Se content (except for the sample with x = 0.09), mainly due to the larger covalent radius of Se (1.16 Å) in comparison to that of S (1.02 Å), which is consistent with the Vegard's law. For the sample with x = 0.09, the lattice constants behave anomalously because of a small amount of the secondary phase present that was detected by means more sensitive than XRD (more about it below). | ||
| Fig. 1 (a) XRD patterns of the CoSbS1−xSex (0 ≤ x ≤ 0.09) compounds; (b) lattice parameters of CoSbS1−xSex (0 ≤ x ≤ 0.09) as a function of the content of Se. | ||
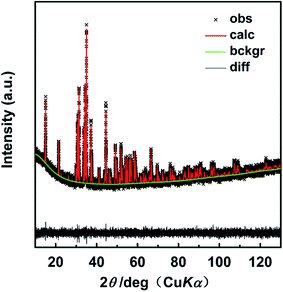
The Rietveld refinement was done on the XRD data of the x = 0.01 compound (a slow scan with the step size 0.00656° within the angular range of 10°–130°). Fig. 2 displays the Rietveld refinement results and Table 1 lists the refined parameters with the quality factors Rwp, Rp, χ2 of 0.0382, 0.0311 and 1.151, respectively, proving the reliability of the refinement process. The above results verify that the Se atoms successfully enter the sites of S in the crystal lattice.
 | ||
| Fig. 2 Rietveld refinement of XRD pattern for CoSbS0.99Se0.01. The difference (black line) between the observed (black cross) and the calculated (red line) data is shown at the bottom. | ||
| (a) | ||||
|---|---|---|---|---|
| Atom | X | Y | Z | Occupancy |
| Co | 0.021443 | 0.162091 | 0.384402 | 1 |
| Sb | 0.117535 | 0.049662 | 0.178686 | 1 |
| S | −0.124641 | 0.318852 | 0.063298 | 0.99 |
| Se | −0.124641 | 0.318852 | 0.063298 | 0.01 |
| (b) | |||
|---|---|---|---|
| Data collection parameters | Quality factors | ||
| X-ray radiation | Cu Kα | Rwp | 0.0382 |
| Monochromator | Graphite | ||
| 2θ, degree | 10–130 | Rp | 0.0311 |
| Step width, degree | 0.00656 | ||
| Counts time, s | 43 | χ2 | 1.151 |
| Temperature, K | 300 | ||
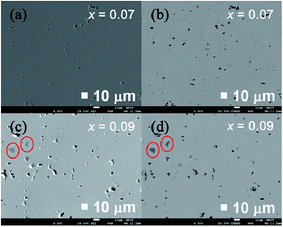
Fig. 3 displays FESEM images and back-scattering electron images (BSI) obtained on polished surfaces of sintered samples with x = 0.07 and 0.09. The FESEM results in Fig. 3(a) and (c) show that both samples are fully condensed. A few pits on the surface formed during the polishing process. No contrast is seen on the back-scattering electron image (BSI) of sample x = 0.07 in Fig. 3(b), indicating that the structure is a homogeneous single phase material. In contrast, the sample with x = 0.09 in Fig. 3(d) shows a trace amount of a secondary phase of composition CoS, verified by EDS and consistent with the abnormal behaviour of the lattice constants in this highest Se content sample. Thus, we can conclude that CoSbS1−xSex compounds with the content of Se below 0.07 are single phase structures. As the content of Se exceeds 0.07, a secondary CoS phase is observed. Therefore, the solubility limit of Se in CoSbS1−xSex is around x = 0.07.
 | ||
| Fig. 3 (a, c) FESEM images and (b, d) back-scattering electron images of polished surfaces of sintered CoSbS1−xSex (x = 0.07, 0.09) compounds. | ||
Electronic transport properties
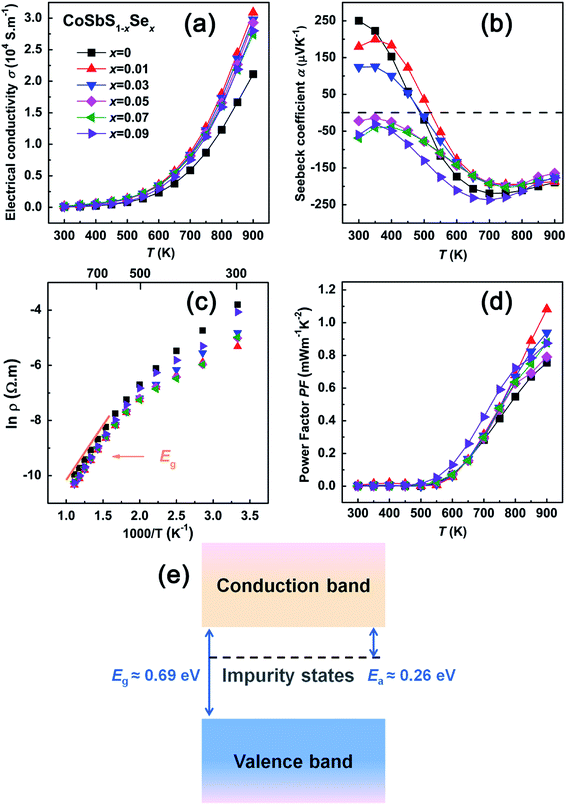
Fig. 4 displays the temperature dependence of electronic transport properties of CoSbS1−xSex compounds. Fig. 4(a) is the temperature dependent electrical conductivity σ. The data shows that, with the increasing content of Se, the electrical conductivity increases. This may be due to a smaller ionization energy of Se (941.0 KJ mol−1) compared to that of S (999.6 KJ mol−1). Since the ionization energy difference and the covalent radius difference between Se and Sb are smaller than that between S and Sb, it is also possible that it is easier for Se to substitute on the site of Sb, forming SeSb antisite defects, which will move the Fermi level closer to the conduction band minimum by increasing the concentration of electrons. Moreover, Se substituting on the site of S may weaken the ionic character of the Co–S bond in the compound, and thus improve the carrier mobility, which is beneficial to achieving a higher σ.32–34As Fig. 4(a) also documents, in the entire temperature range covered, σ of all CoSbS1−xSex compounds increases with the increasing temperature in a roughly similar fashion, displaying a typical semiconducting behavior. In addition, a specific thermal activated behavior can be seen in Fig. 4(a) where, as the temperature increases the conductivity σ increases more sharply. This likely arises from thermal excitations of electrons from the in-gap impurity states followed by across-the-gap electronic excitations at higher temperatures. To shed light on this issue, an Arrhenius plot of the resistivity ρ vs. the inverse temperature is presented in Fig. 4(c). From the Arrhenius plot it follows that, at temperature below and above 700 K, there are two distinct linear dependences between ln![[thin space (1/6-em)]](https://www.rsc.org/images/entities/char_2009.gif) ρ and 1/T. This indicates the presence of two different transport mechanisms acting. At low and medium temperatures, the transport behavior is controlled by in-gap impurity state excitations, while at high temperatures, thermal excitations across the band gap are the dominant process. The electrical resistivity can be described35–37 by the following model,
ρ and 1/T. This indicates the presence of two different transport mechanisms acting. At low and medium temperatures, the transport behavior is controlled by in-gap impurity state excitations, while at high temperatures, thermal excitations across the band gap are the dominant process. The electrical resistivity can be described35–37 by the following model,
 | (1) |
| Sample | Eg | Ea |
|---|---|---|
| x = 0 | 0.69 | 0.26 |
| x = 0.01 | 0.65 | 0.19 |
| x = 0.03 | 0.65 | 0.19 |
| x = 0.05 | 0.64 | 0.18 |
| x = 0.07 | 0.63 | 0.14 |
| x = 0.09 | 0.72 | 0.24 |
Fig. 4(e) schematically visualizes the band structure of CoSbS. Impurity states in the band gap at energy Ea below the conduction band edge start to be ionized at temperatures above 500 K, generating electrons that sharply increase the electrical conductivity around that temperature. Thermal excitation of electrons across the band gap requires higher temperatures and, from the slope in Fig. 4(c), the band gap is about 0.69 eV.
Fig. 4(b) shows the temperature dependence of the Seebeck coefficient for CoSbS1−xSex compounds. The transport process in compounds with the Se content below 0.05 is dominated by positive charge carriers (holes) up to about 550 K. At higher temperatures, as the electrons thermally excited from the in-gap impurity states start to contribute to the transport, the Seebeck coefficient crosses over and becomes negative. In contrast, the compounds with the Se content exceeding 0.05 are n-type conductors at all temperatures. The diminishing magnitude of the Seebeck coefficient observed at temperatures above about 700 K is a consequence of intrinsic (across the gap) electron excitations. Typical Seebeck coefficients at 700 K reach values as much as −200 μV K−1. Consequently, small and flat power factors of CoSbS1−xSex compounds at temperatures below 500 K turn rapidly into reasonably large power factors at high temperatures with values on the order of 1 × 10⁻³ Wm−1 K−2 at 900 K.
Thermal transport properties
Fig. 5(a) and (b) display the temperature dependent total thermal conductivity κ and the lattice thermal conductivity κL of CoSbS1−xSex compounds. The lattice thermal conductivity κL is derived using the Wiedemann–Franz law, κL = κ − LσT, where the Lorenz number L is obtained from eqn (2)–(6), employing a simple parabolic band (SPB) model under the relaxation time approximation and assuming the dominance of acoustic phonon scattering (the scattering factor r = −1/2).38–40
 | (2) |
 | (3) |
 | (4) |
 | (5) |
 | (6) |
 | ||
| Fig. 5 Temperature dependence of (a) thermal conductivity, (b) lattice thermal conductivity and (c) ZT of CoSbS1−xSex (0 ≤ x ≤ 0.09) compounds. | ||
The total and the lattice thermal conductivities κ and κL decrease smoothly and continuously with the increasing temperature, as shown in Fig. 5(a) and (b). Except for the compound with x = 0.09, which contains secondary phases, the lattice thermal conductivity decreases as the content of Se increases.
The alloy scattering, i.e., the presence of Se on sites of S, has two aspects: it induces mass fluctuations (mass difference between S and Se), and it causes strain fluctuations (due to the size difference between atoms of S and Se). In order to separate the two contributions, we use the theory of Callaway.41–43 The calculated mass fluctuation scattering parameter ΓM and the strain field fluctuation scattering parameter ΓS are presented in Table S1 (in ESI†) and the calculation process in detail is in the ESI.†
The results in Table S1† show that, the scattering parameter Γ = ΓM + ΓS increases with the increasing content of Se as both the mass defect and strain field fluctuation contributions increase as more Se enters the crystal lattice.
The dimensionless figure of merit ZT
Using the measured values of the electrical conductivity, Seebeck coefficient and thermal conductivity, the dimensionless thermoelectric figure of merit ZT was calculated and its temperature dependence is presented in Fig. 5(c) for all CoSbS1−xSex (0 ≤ x ≤ 0.09) compounds. With the increasing temperature, the ZT value increases rapidly, primarily because of ionization of the in-gap impurity levels and intrinsic excitations. Due to the enhanced power factor and the decreased thermal conductivity, the maximum ZT of 0.26 is achieved at about 900 K in CoSbS0.99Se0.01. This is about 37% enhancement in the figure of merit compared to the undoped CoSbS compound at the same temperature.Conclusions
A series of CoSbS1−xSex (0 ≤ x ≤ 0.09) compounds was prepared by vacuum melting and annealing followed by SPS processing. The solubility limit for Se on the site of S is about 0.07. The electrical conductivity increases rapidly with the increasing temperature due to the ionization of impurity levels at around 500 K and due to intrinsic excitations setting in above 700 K. The introduction of Se on the sites of S increases the electron density and the carrier mobility, leading to an increase in the electrical conductivity of Se-containing compounds. The Seebeck coefficient reflects a crossover from the p-type to n-type dominated carrier transport in low Se content compounds, while compounds with the Se content equal or exceeding x = 0.05 are invariably n-type conductors. The highest power factor of 1.1 × 10⁻³ Wm−1 K−2 at 900 K is measured in CoSbS0.99Se0.01. Owing to enhanced phonon scattering in compounds containing Se, the lattice thermal conductivity κL is markedly reduced and, together with the enhanced power factor, results in improved values of the dimensionless thermoelectric figure of merit. The highest value of ZT = 0.26 at 900 K is achieved in CoSbS0.99Se0.01. This represents about 37% improvement over the figure of merit of pure CoSbS compound.Acknowledgements
The authors wish to acknowledge support from the National Basic Research Program of China (973 program) under project 2013CB632502, the Natural Science Foundation of China (Grant No. 51402222, 51172174, 51521001, 51401153), and the 111 Project of China (Grant No. B07040).Notes and references
- G. J. Snyder and E. S. Toberer, Nat. Mater., 2008, 7, 105–114 CrossRef CAS PubMed.
- J. R. Sootsman, D. Y. Chung and M. G. Kanatzidis, Angew. Chem., Int. Ed., 2009, 48, 8616–8639 CrossRef CAS PubMed.
- A. Minnich, M. Dresselhaus, Z. Ren and G. Chen, Energy Environ. Sci., 2009, 2, 466–479 CAS.
- W. Liu, X. Tan, K. Yin, H. Liu, X. Tang, J. Shi, Q. Zhang and C. Uher, Phys. Rev. Lett., 2012, 108, 166601 CrossRef PubMed.
- Y. Pei, A. LaLonde, S. Iwanaga and G. J. Snyder, Energy Environ. Sci., 2011, 4, 2085–2089 CAS.
- W. Xie, X. Tang, Y. Yan, Q. Zhang and T. M. Tritt, Appl. Phys. Lett., 2009, 94, 102111 CrossRef.
- W. Xie, J. He, H. J. Kang, X. Tang, S. Zhu, M. Laver, S. Wang, J. R. Copley, C. M. Brown and Q. Zhang, Nano Lett., 2010, 10, 3283–3289 CrossRef CAS PubMed.
- B. Poudel, Q. Hao, Y. Ma, Y. Lan, A. J. Minnich, B. Yu, X. Yan, D. Wang, A. Muto and D. Vashaee, Science, 2008, 320, 634–638 CrossRef CAS PubMed.
- G. J. Tan and M. G. Kanatzidis, in Materials Aspect of Thermoelectricity: All-Scale Architecture, ed. C. Uher, CRC press, Boca Raton, 2016, p. 125 Search PubMed.
- X. Su, P. Wei, H. Li, W. Liu, Y. Yan, P. Li, C. Su, C. Xie, W. Zhao, P. Zhai, Q. Zhang, X. Tang and C. Uher, Adv. Mater., 2017, 1602013 CrossRef PubMed.
- L. Zhao, V. P. Dravid and M. G. Kanatzidis, Energy Environ. Sci., 2014, 7, 251–268 CAS.
- Y. Zheng, Q. Zhang, X. Su, H. Xie, S. Shu, T. Chen, G. Tan, Y. Yan, X. Tang and C. Uher, Adv. Energy Mater., 2015, 5, 1401391 CrossRef.
- S. K. Mishra, S. Satpathy and O. Jepsen, J. Phys.: Condens. Matter, 1997, 9, 461–470 CrossRef CAS.
- X. B. Zhao, X. Ji, Y. H. Zhang, T. J. Zhu, J. P. Tu and X. B. Zhang, Appl. Phys. Lett., 2005, 86, 062111 CrossRef.
- A. P. Goncalves and C. Godart, Eur. Phys. J. B, 2014, 87, 1–29 CrossRef.
- C. Han, Z. Li, G. Q. Lu and S. X. Dou, Nano Energy, 2015, 15, 193–204 CrossRef CAS.
- F. E. Akkad, B. Mansour and T. Hendeya, Mater. Res. Bull., 1981, 16, 535–539 CrossRef.
- S. Ballikaya, H. Chi, J. R. Salvador and C. Uher, J. Mater. Chem., 2013, 1, 12478–12484 RSC.
- X. Lu and D. T. Morelli, Phys. Chem. Chem. Phys., 2013, 15, 5762–5766 RSC.
- X. Lu, D. T. Morelli, Y. Xia, F. Zhou, V. Ozolins, H. Chi, X. Zhou and C. Uher, Adv. Energy Mater., 2013, 3, 342–348 CrossRef CAS.
- E. J. Skoug, J. D. Cain and D. T. Morelli, J. Electron. Mater., 2012, 41, 1232–1236 CrossRef CAS.
- N. Tsujii, F. Meng, K. Tsuchiya, S. Maruyama and T. Mori, J. Electron. Mater., 2016, 45, 1642–1647 CrossRef CAS.
- Y. Zhang, E. J. Skoug, J. D. Cain, V. Ozoliņs, D. T. Morelli and C. Wolverton, Phys. Rev. B: Condens. Matter Mater. Phys., 2012, 85, 054306 CrossRef.
- T. Wei, F. Li and J. Li, J. Electron. Mater., 2014, 43, 2229–2238 CrossRef CAS.
- L. J. Cabri, D. C. Harris and J. M. Stewart, Can. Mineral., 1970, 10, 232–246 CAS.
- D. Parker, A. F. May, H. Wang, M. A. Mcguire, B. C. Sales and D. J. Singh, Phys. Rev. B: Condens. Matter Mater. Phys., 2013, 87, 045205 CrossRef.
- Z. Liu, H. Geng, J. Shuai, Z. Wang, J. Mao, D. Wang, Q. Jie, W. Cai, J. Sui and Z. Ren, J. Mater. Chem. C, 2015, 3, 10442–10450 RSC.
- R. Carlini, C. Artini, G. Borzone, R. Masini, G. Zanicchi and G. A. Costa, J. Therm. Anal. Calorim., 2010, 103, 23–27 CrossRef.
- R. Chmielowski, S. Bhattacharya, W. Xie, D. Pere, S. Jacob, R. Stern, K. Moriya, A. Weidenkaff, G. K. H. Madsen and G. Dennler, J. Mater. Chem. C, 2016, 4, 3094–3100 RSC.
- W. Yao, D. Yang, Y. Yan, K. Peng, H. Zhan, A. Liu, X. Lu, G. Wang and X. Zhou, ACS Appl. Mater. Interfaces, 2017, 9(12), 10595–10601 CAS.
- R. Chmielowski, S. Bhattacharya, S. Jacob, D. Pere, A. Jacob, K. Moriya, B. Delatouche, P. Roussel, G. Madsen and G. Dennler, Sci. Rep., 2017, 7, 46630 CrossRef CAS PubMed.
- S. Wang, J. Yang, L. Wu, P. Wei, J. Yang, W. Zhang and Y. Grin, Chem. Mater., 2015, 27, 1071–1081 CrossRef CAS.
- Y. Qin, P. Qiu, R. Liu, Y. Li, F. Hao, T. Zhang, D. Ren, X. Shi and L. Chen, J. Mater. Chem. A, 2016, 4, 1277–1289 CAS.
- S. M. Kauzlarich, S. R. Brown and G. J. Snyder, Dalton Trans., 2007, 21, 2099–2107 RSC.
- S. Ray, A. Kumar, S. Majumdar, E. V. Sampathkumaran and D. D. Sarma, J. Phys.: Condens. Matter, 2001, 13, 607–616 CrossRef CAS.
- L. Fang, R. G. Iyer, G. Tan, D. J. West, S. Zhang and M. G. Kanatzidis, J. Am. Chem. Soc., 2014, 136, 11079–11084 CrossRef CAS PubMed.
- I. Shiozaki, M. Ohashi and H. Kadowaki, J. Phys. Soc. Jpn., 2000, 69, 3873–3877 CrossRef CAS.
- S. Bux, M. T. Yeung, E. S. Toberer, G. J. Snyder, R. B. Kaner and J. Fleurial, J. Mater. Chem., 2011, 21, 12259–12266 RSC.
- B. Abeles, Phys. Rev., 1963, 131, 1906–1911 CrossRef.
- G. A. Slack, Phys. Rev., 1957, 105, 829–831 CrossRef CAS.
- J. A. Callaway and H. C. Von Baeyer, Phys. Rev., 1960, 120, 1149–1154 CrossRef CAS.
- J. Yang, G. P. Meisner and L. Chen, Appl. Phys. Lett., 2004, 85, 1140–1142 CrossRef CAS.
- G. Zheng, X. Su, T. Liang, Q. Lu, Y. Yan, C. Uher and X. Tang, J. Mater. Chem. A, 2015, 3, 6603–6613 CAS.
Footnote |
| † Electronic supplementary information (ESI) available. See DOI: 10.1039/c7ra05609e |
| This journal is © The Royal Society of Chemistry 2017 |

