 Open Access Article
Creative Commons Attribution 3.0 Unported Licence
A correlation between the degradability of poly(butylene succinate)-based copolyesters and catalytic behavior with Candida antarctica lipase B
Min Zhang *ab,
Xiao-ning Ma
 a,
Cheng-tao Li
 b,
Dong Zhaoa,
Yong-lei Xingc and
Jian-hui Qiud
aKey Laboratory of Auxiliary Chemistry & Technology for Chemical Industry, Ministry of Education, Shaanxi University of Science & Technology, Xi'an 710021, China. E-mail: yanjiushi206@163.com
bSchool of Environmental Science & Engineering, Shaanxi University of Science & Technology, Xi'an 710021, China
cElectronic Materials Research Laboratory, International Center for Dielectric Research, Xi'an Jiaotong University, Xi'an 710049, China
dAkita Prefectural University, Akita 015-0055, Japan
First published on 5th September 2017
Abstract
Polyesters can be degraded by Candida antarctica lipase B (CALB). Herein, the poly(butylene succinate) (PBS) based random copolyesters of a third monomer 1,3-propanediol (PDO), 1,5-pentanediol (PeD) and 1,6-hexanediol (HDO) were successfully synthesized using a melt polycondensation method, and the action of CALB in the buffer solution for 5 days was studied to analyze the degradation mechanism of the copolyesters with high number average molecular weight. Molecular simulations were employed to investigate the binding free energy and interaction between copolyesters and enzymes during degradation. In addition, the weight loss rate and liquid chromatography-mass spectrometry (LC-MS) were used to evaluate the degradability of the synthesized materials. The results showed that the degradation percentage of copolyesters modified with a third monomer were higher than that of pure PBS, with the order of the degradation performance being P(BS-co-PeD) > P(BS-co-HDO) > P(BS-co-PDO) > PBS. Notably, the maximum value, achieved in P(BS-co-20%PeD), was 85%. Molecular dynamics and docking simulations revealed the changes in CALB amino acid residues and binding free energy, demonstrating that both P(BS-co-PeD) and P(BS-co-HDO) polyesters can interact strongly with CALB, which can explain the enzymatic degradation behavior of the copolyesters from the molecular point of view. This research provides a new perspective in the study of interactions between lipase and polyesters.
Introduction
Polymer materials have been widely applied in various fields because of their excellent performances. However, the excessive use of polymers has led to major environmental damage due to their resistance to physical aging and biological attack, resulting in tremendous damage to the environment.1,2 In order to address these severe problems, new degradable materials with competitive performance properties, i.e., aliphatic polyesters3 have been developed as an alternative to non-biodegradable plastics. Poly(butylene succinate) (PBS), obtained by the direct polymerization of succinic acid and butanediol, is one of the most widely used aliphatic polyesters due to its good biodegradability, biocompatibility properties, excellent processing properties and satisfactory mechanical properties.4–7 Recently, chain extended multi-block aliphatic polyesters and PBS bionanocomposites8–10 have been prepared for a wide range of applications such as food packaging,11,12 drug delivery,13 biomedical14 and engineering materials.15 In view of the biodegradability of PBS, much work has been performed to demonstrate the feasibility of the degradation of PBS by bacteria, soil and enzymes.16–20Lipases (EC 3.1.1.3) have been exploited on a large scale as an efficient catalyst for the hydrolysis of the ester bond between alcohol and carboxylic acid in the aqueous media. Candida antarctica lipase B (CALB), serine protease, is a potent biocatalyst for polyester degradation with the crucial advantages of a broad substrate specificity and a stable performance.20,21 The sequence and crystal structure of CALB have been determined by Uppenberg,22,23 CALB has an α/β type and a Ser–His–Asp catalytic triad in the active site that plays a decisive role in catalyzing the substrate.24 Due to its high stability, stereoselectivity and strong activity,21,25 various studies focus on enantiomeric recognition, the evaluation of the activity and the stability in organic solvents.26–29 However, to the best of our knowledge, few works have been devoted to the polymers degradation by CALB. Therefore, the present study investigates the degradation mechanism of polyesters by CALB.
It is well known that the degradation of aliphatic polyesters is affected by the chemical structure of the repeat unit, which can further influence their flexibility, crystallinity, thermal properties and morphological properties.15,30 To date, various studies has made the degradation controllable by developing various PBS copolymers or their composites.31,32 Indeed, the synthesis of PBS-based copolymers can efficiently alter its chemical structure and tune its degradation behavior. Significantly, reports on the effect of the structure of PBS copolymers with different chain lengths on their degradation by CALB remain scarce. In the present paper, we synthesized PBS and there of its copolyesters modified by the monomers of different chain lengths to study the degradation performance of copolyesters and the catalytic behavior of CALB, as well as to understand the degradation mechanism.
In this regard, the molecular simulation is an essential way to figure out the details of ligand–protein complex.33,34 Combining molecular dynamics and molecular docking,35,36 we aimed to understand the conformational changes of CALB in water and the positions of its ligands. Simultaneously, we obtained the binding free energy of the ligand–receptor, as well as the information about the active site pocket. We reasonably designed the docking model used to study the recognition of the substrate by CALB and the substrate conformational changes, the interaction around the active pocket were also obtained. This research provides theoretical guidance of the degradation of large molecular weight polyesters degraded by CALB at the molecular level.
Experimental
Materials
The PBS homopolymer and P(BS-co-PDO), P(BS-co-PeD), and P(BS-co-HDO) copolyesters were synthesized from succinic acid and diols. 1,4-Succinic acid (S) and 1,4-butanediol (BDO) were obtained from Sinopharm Chemical Reagent Co. Ltd. 1,3-Propanediol (PDO), 1,5-pentanediol (PeD), and 1,6-hexanediol (HDO) were purchased from Alfa Aesar Chemical Reagent Co. Ltd., CALB was purchased from Novozymes (China) Investment Co. Ltd. All reagents in this study were of analytical grade, and were used without further purification.Experimental procedures
![[thin space (1/6-em)]](https://www.rsc.org/images/entities/char_2009.gif) :
:![[thin space (1/6-em)]](https://www.rsc.org/images/entities/char_2009.gif) 1.1, and the feed molar ratio of PDO, PeD, and HDO in the copolyesters were 0%, 5%, 10%, 15%, and 20%, respectively. The reactor was filled with nitrogen to protect the reaction from oxidation and then the reaction mixture was heated to 180 °C to dehydrate until the theoretical amount of H2O was collected. The polycondensation process was carried out at 230 °C under a vacuum of 5.5 Pa for approximately 2 h, and then washed with ethanol for several times and dried under the vacuum for further use.
1.1, and the feed molar ratio of PDO, PeD, and HDO in the copolyesters were 0%, 5%, 10%, 15%, and 20%, respectively. The reactor was filled with nitrogen to protect the reaction from oxidation and then the reaction mixture was heated to 180 °C to dehydrate until the theoretical amount of H2O was collected. The polycondensation process was carried out at 230 °C under a vacuum of 5.5 Pa for approximately 2 h, and then washed with ethanol for several times and dried under the vacuum for further use.Gel permeation chromatography was performed by P230 GPC (Dalian Yilite Analytical Instruments, China) equipped with a refractive index detector Shodex RI-201H to determine the molecular weight and molecular weight distribution of polyesters. Chloroform was used as the mobile phase at a flow rate of 1.0 mL min−1, and 20 μL of a 1.0 w/v% solution was injected in all analyses. The column temperature was maintained at 40 °C, and polystyrene standards were obtained from Shodex to be a calibration curve for the number-average (Mn) and weight-average molecular weights (Mw).
The thermal stabilities of the polyesters were studied by thermogravimetric analysis (TGA, Q500, TA Instruments) in a nitrogen atmosphere. All samples (∼5 mg) were heated from room temperature to 500 °C at a heating rate of 10 °C min−1.
The basic thermal parameters were determined by differential scanning calorimetry (DSC, Q500, TA Instruments). A specimen of approximately 3–5 mg was encapsulated in aluminium pans under a high-purity nitrogen atmosphere. Samples were heated to 160 °C at a rate of 10 °C min−1 for 5 min to eliminate their thermal history, and cooled to −60 °C at a rate of 5 °C min−1, and finally, reheated to 160 °C at a rate of 10 °C min−1.
Wide-angle X-ray diffraction (WAXD) analysis was performed by Rigaku D/Max-3c with Cu Kα radiation. The scanning range was from 5° to 40° at a rate of 6° min−1 with a step of 0.02°.
The chromatographic analysis system consisted of a Waters, WASAD2/E2695* (Waters, Technology, Co. Ltd.) coupled to a triple quadrupole mass spectrometer using an electrospray ionization source (ESI) to identify the degradation products. The scan range was from 100 to 1200 m/z, with a capillary voltage of 4000 V, and nitrogen as the auxiliary gas.
Results and discussion
Synthesis and characterization of polyesters
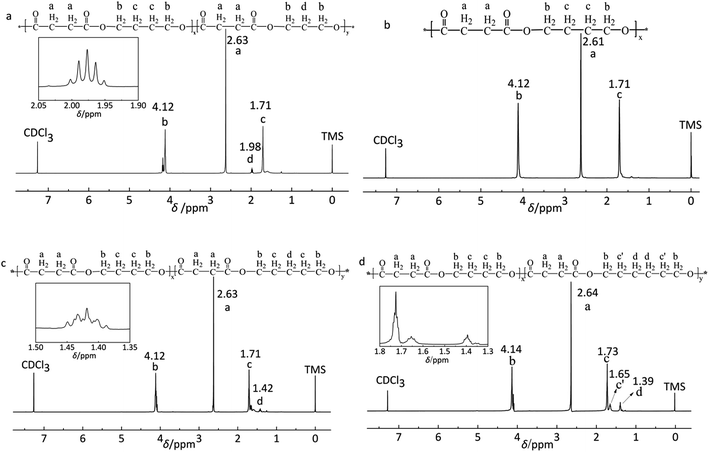
The polyesters were synthesized through melt polycondensation at varing feed molar ratio of the third monomer to improve the degradation properties of PBS. The typical 1H NMR spectra are shown in Fig. 1. The data concerning copolyesters molecular characterization are reported in Table 1. All the copolyesters and PBS homopolymer were of high molecular weight (Fig. 2). Further, the real compositions of each polyester was determined by 1H NMR, closed to the feed one (see Table 1). The peak at 1.98 ppm (d labelled protons) shown in Fig. 1a was attributed to the methylene of PDO. The typical methylene protons resonances of S at 2.61 ppm (a labelled protons) and at 4.12 ppm (b labelled protons) and 1.71 ppm (c labelled protons) from BDO in Fig. 1b were the typical absorption peaks of PBS. Two peaks at 1.71 ppm (c labelled protons) and at 1.42 ppm (d labelled protons) were assigned to the methylene of PeD in Fig. 1c. The chemical shifts at 1.65 ppm (c′ labelled protons) and 1.39 ppm (d labelled protons) were corresponded to the methylene of HDO (Fig. 1d). The 1H NMR spectra indicated that the polyesters obtained were the expected products.| Polyester | FPDO/PeD/HDOa (mol%) | Mnb kDa | Mwc kDa | PDId |
|---|---|---|---|---|
| a Compositions of polymers determined by 1H NMR.b Number average molecular weight measured by GPC analysis.c Weight average molecular weight measured by GPC analysis.d Polydispersity index measured by GPC analysis. | ||||
| PBS | 0.0 | 67.5 | 134.3 | 1.99 |
| P(BS-co-5%PDO) | 4.8 | 55.9 | 123.0 | 2.20 |
| P(BS-co-10%PDO) | 10.0 | 66.0 | 131.6 | 1.99 |
| P(BS-co-15%PDO) | 14.5 | 59.3 | 139.4 | 2.35 |
| P(BS-co-20%PDO) | 18.6 | 56.1 | 105.2 | 1.87 |
| P(BS-co-5%PeD) | 5.0 | 61.8 | 124.6 | 1.97 |
| P(BS-co-10%PeD) | 9.7 | 65.2 | 126.1 | 1.94 |
| P(BS-co-15%PeD) | 14.8 | 65.9 | 143.9 | 2.18 |
| P(BS-co-20%PeD) | 19.2 | 71.2 | 132.7 | 1.86 |
| P(BS-co-5%HDO) | 5.0 | 59.1 | 138.1 | 2.34 |
| P(BS-co-10%HDO) | 9.8 | 59.6 | 128.4 | 2.15 |
| P(BS-co-15%HDO) | 14.5 | 70.5 | 144.8 | 2.05 |
| P(BS-co-20%HDO) | 20.0 | 71.4 | 151.1 | 2.11 |
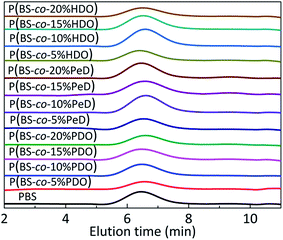 | ||
| Fig. 2 GPC diagrams of polyesters. Stack plot of GPC traces of PBS and their polyesters. RI signal is reported as a function of elution time (min). | ||
Enzymatic hydrolysis of polyesters
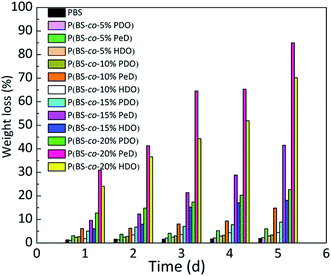
Since the degradability of copolyesters was different due to their various structures, the weight loss rate of the different polyesters in the presence of CALB was studied in an aqueous medium shown in Fig. 3. Obviously, it was found that all three copolyesters with the third monomer showed a higher mass loss than that of PBS, and the values increased as the amount of the third monomer increased. Overall, the P(BS-co-20%PeD) polyester had the maximum weight loss rate, which reached 85% in 5 days, followed by P(BS-co-20%HDO), reaching 70%. P(BS-co-20%PDO) had a minimum value of 23% after 5 days. Significantly, the weight loss of neat PBS was only about 2%.It was suspected that the neat spiral chain structure of PBS would break in the presence of the third monomer due to a decrease in the degree of crystallinity, thus offering more free segments for CALB to attack. Nevertheless, when PeD and HDO were introduced, the chain was considerably more flexible than that of PBS, and beneficial for the combination of the enzyme and substrates, and resulting in an accelerated degradation of polyesters based on this point. There will be a more in-depth discussion in next section. It's well-known that the degradation rate is affected by many factors. For example, compared with P(BS-co-PeD), the ester bond density of P(BS-co-HDO) was lower with the same molar fraction, because the former could afford more ester bonds to CALB, enhancing the affinity to enzyme. The more details of this phenomenon would be studied by molecular simulation.
Thermal properties and crystallization ability
DSC was utilized to evaluate the thermal properties of copolyesters. The thermal parameters are listed in Table 2, and the second heating curves and cooling curves are shown in Fig. 4. As compared with the melting temperature (Tm, 108.68 °C), melting enthalpy (ΔHm, 58.64) and crystallinity (Xc-DSC, 53.06) of PBS homopolymer, the Tm, ΔHm and Xc-DSC values of copolyesters decreased with the third monomer increased. This may be due to the reduction of the third monomer decreased the chain regularity and then the imperfect crystals appeared, resulting in a decrease in crystallization temperature (Tc) and crystallization enthalpy (ΔHc). WAXD measurements were performed to analyze the crystalline performance of the copolyesters, as shown in Fig. 5. The three main diffraction peaks were located at 19.6°, 21.9°, 22.8°, corresponding to the (202), (021) and (110) planes of the α-crystal form. In addition, the copolyesters exhibited similar diffraction peaks, indicating that the copolyesters had the same crystal phase. It can be seen that the diffraction peaks became less intense as the third monomer increased, revealing that the copolyesters had a lower crystallinity. Among these copolyesters, P(BS-co-PeD) had the lowest Xc, followed by P(BS-co-HDO), thus P(BS-co-PeD) had the excellent degradability. It well known that the enzyme is more susceptible to degrade the amorphous region. P(BS-co-PeD) could supply more amorphous with CALB to attack first.| Samples | Td-5%a (°C) | Td-maxb (°C) | Tcc (°C) | ΔHcc (J g−1) | Tmd (°C) | ΔHmd (J g−1) | Xc-DSCe (%) | Xc-XRDf (%) |
|---|---|---|---|---|---|---|---|---|
a Decomposition temperature of copolyesters at weight loss of 5%.b Decomposition temperature of copolyesters at the maximum weight loss.c Determined by the cooling scan from the melt at 5 °C min−1.d Determined by the 2nd heating scan at 10 °C min−1.e The crystallinity degree Xc-DSC of polyesters were calculated by dividing the obtained ΔHm from the second heating trace by the theoretical value (110.5 J g−1) for a 100% crystalline PBS.  , ,  .f The crystallinity degree Xc-XRD of polyesters were calculated by WAXD analyses. .f The crystallinity degree Xc-XRD of polyesters were calculated by WAXD analyses. |
||||||||
| PBS | 324.97 | 389.23 | 83.26 | 65.55 | 108.68 | 58.64 | 53.06 | 54.60 |
| P(BS-co-5%PDO) | 320.96 | 389.00 | 72.08 | 57.91 | 96.81 | 49.97 | 45.22 | 47.15 |
| P(BS-co-10%PDO) | 323.00 | 380.76 | 77.54 | 54.07 | 98.88 | 49.03 | 44.37 | 43.53 |
| P(BS-co-15%PDO) | 317.16 | 378.76 | 73.16 | 58.46 | 95.50 | 47.19 | 42.71 | 41.77 |
| P(BS-co-20%PDO) | 324.99 | 387.83 | 67.88 | 55.72 | 90.75 | 45.66 | 41.32 | 40.58 |
| P(BS-co-5%PeD) | 317.95 | 386.00 | 80.97 | 56.48 | 102.55 | 47.37 | 42.87 | 42.99 |
| P(BS-co-10%PeD) | 322.54 | 388.05 | 73.25 | 56.88 | 98.52 | 48.49 | 43.89 | 42.93 |
| P(BS-co-15%PeD) | 326.00 | 393.70 | 74.42 | 55.52 | 96.74 | 45.11 | 40.82 | 41.90 |
| P(BS-co-20%PeD) | 327.28 | 390.75 | 63.12 | 44.06 | 88.67 | 34.46 | 31.19 | 30.56 |
| P(BS-co-5%HDO) | 321.99 | 389.10 | 77.88 | 60.05 | 103.42 | 52.25 | 47.28 | 44.25 |
| P(BS-co-10%HDO) | 314.42 | 389.18 | 74.52 | 50.18 | 97.92 | 44.47 | 40.24 | 39.80 |
| P(BS-co-15%HDO) | 328.74 | 392.00 | 65.60 | 49.45 | 92.31 | 43.64 | 39.49 | 38.18 |
| P(BS-co-20%HDO) | 323.28 | 388.93 | 61.48 | 49.05 | 86.35 | 41.10 | 37.19 | 35.69 |
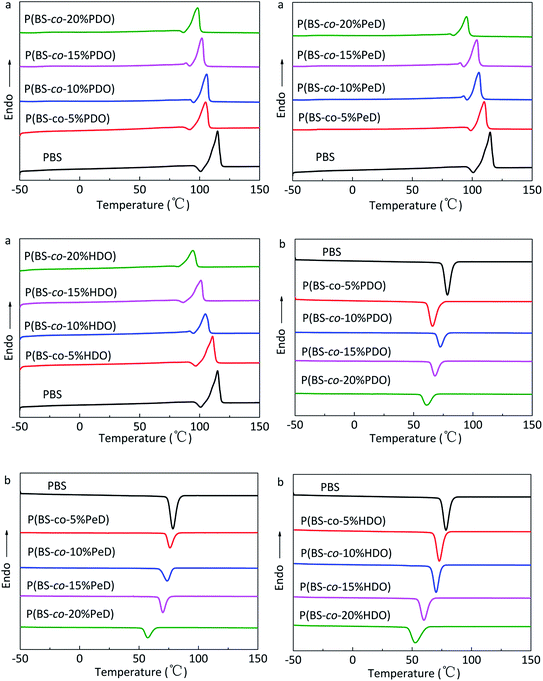 | ||
| Fig. 4 DSC curves of copolyesters: (a) second heating scan at 10 °C min−1 and (b) cooling scan at 5 °C min−1. | ||
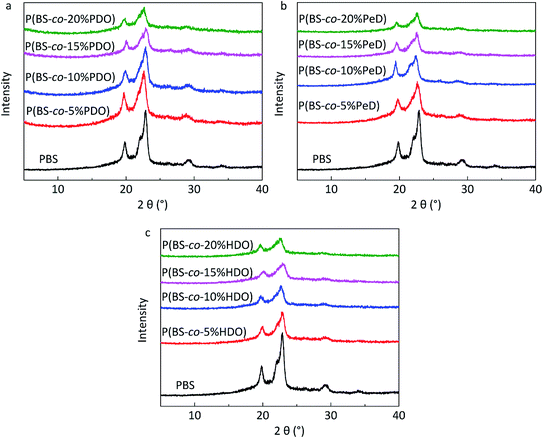 | ||
| Fig. 5 WAXD profiles (0.02° step, 50 s per step) of copolyesters: (a) P(BS-co-PDO). (b) P(BS-co-PeD). (c) P(BS-co-HDO). | ||
The thermal stability of the copolyesters were determined by TGA. Fig. 6 shows the TGA curves of P(BS-co-PDO), P(BS-co-PeD) and P(BS-co-HDO). Overall, copolyesters had similar profiles and weight loss in a single main decomposition process in the range of 280–420 °C, and the decomposition temperatures of PBS homopolymer and its derivatives were above 300 °C at 5% weight loss, illustrating that the copolyesters had adequate thermal stability. However, the decomposition temperatures Td-5% and Td-max of all the PBS-based copolyesters were lower than that of the pure PBS, indicating that the presence of modifying monomers slightly decreased thermal stability of copolyesters. This phenomenon is attributed to the introduction of the third component leading to the disruption of the regularity and symmetry of the chain segment of polyesters, and particularly of the spiral structure of PBS. On the other hand, the movement of the structured molecular chains requires more energy, so the neat PBS has high initial decomposition temperature. Several increased values are due to the relative higher molecular weight.
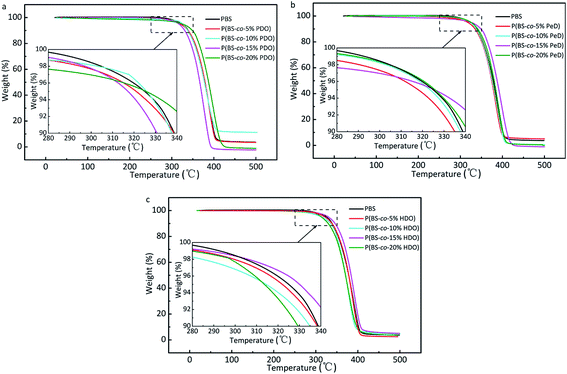 | ||
| Fig. 6 TGA curves under nitrogen atmosphere (10 °C min−1) of copolyesters: (a) P(BS-co-PDO). (b) P(BS-co-PeD). (c) P(BS-co-HDO). | ||
LC-MS analysis
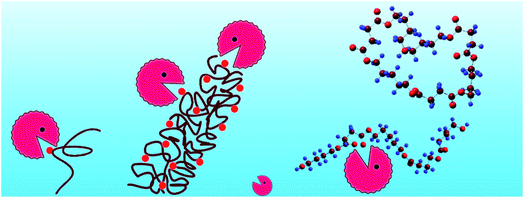
The enzymatic degradation process was accompanied by hydrolysis. As the degradability of polyesters was dominated by their chemical structure, the degradation products of copolyesters was identified by LC-MS method. It is worth mentioning that the degradation products will not come from the ionic degradation of the LC-MS process.From the mass-to-charge ratio (m/z) of [M − H]− in Fig. 7 and the degradation products listed in Table 3, it is notable that the B, S, P and H are the abbreviations of BDO, SA, PDO and HDO respectively. It was further observed that the modified PBS was degraded into different oligomers by CALB in aqueous solution after 5 days, indicating that the presence of the monomers resulted in an acceleration in the degradation process. This was certified by the detection of SA in all three copolyesters, further revealing that the SA was easily dissociated itself from the oligomers of the copolymers during the period of degradation. As a result, 13 kinds of products were obtained for P(BS-co-20%PeD), whereas 10 and 9 kinds for P(BS-co-20%HDO) and P(BS-co-20%PDO), respectively, indicating that the P(BS-co-20%PeD) was more efficiently degraded by CALB. Indeed, in terms of P(BS-co-20%PeD), the relative abundance of higher ion peaks were attributed to m/z 189.21 of L (BS), m/z 461.60 of L (BS)(PeDS)PeD, L (PeDS)2B, L (PeDS)(BS)PeD and m/z of 601.90 C (BS)3PeD, C(BS)2(PeDS)B, corresponding to the dimer, trimer, and pentamer with linear (L) and cyclic (C) oligomers (Table 3), suggesting that cyclization occurred during the process (Scheme 1). The use of CALB as a catalyst for polymerization under relatively mild conditions has been reported previously.20
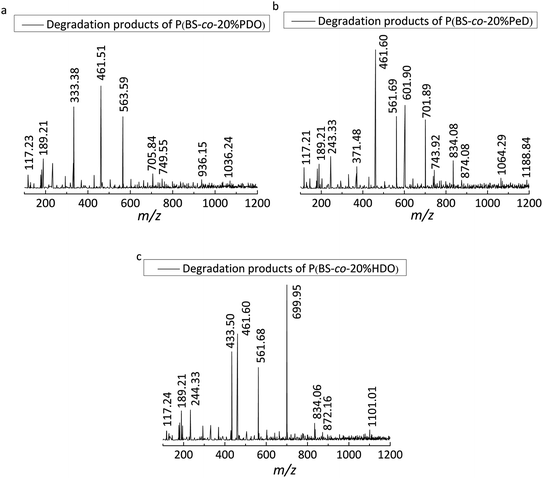 | ||
| Fig. 7 LC-MS spectra (ESI-under nitrogen atmosphere) of the degradation products of polyesters: (a) P(BS-co-20% PDO), (b) P(BS-co-20%PeD), (c) P(BS-co-20%HDO). | ||
| Polyestersa | [M − H]− (m/z) b | Mn c | Products |
|---|---|---|---|
| a Polyesters were degraded after 5 days.b m/z the mass-to-charge ratio.c The number average molecular weight.d Liner.e Cyclic. | |||
| P(BS-co-20%PDO) | 117.23 | 118.23 | Ld S |
| 189.21 | 190.21 | Ld BS | |
| 333.38 | 334.38 | Ld PS | |
| 461.51 | 462.51 | Ld S(BS)2 | |
| 563.59 | 564.59 | Ld (PS)3B, Ld (PS)2 (BS)P | |
| 705.84 | 706.84 | Ld S(BS)3B | |
| 749.55 | 750.55 | Ld S(PS)4 | |
| 936.15 | 937.15 | Ld (BS)5P, Ld (BS)4 (PS)B | |
| 1036.24 | 1037.24 | Ld (BS)5 (PS), Ld S(BS)5P | |
| P(BS-co-20%PeD) | 117.21 | 118.21 | Ld S |
| 189.21 | 190.21 | Ld BS | |
| 243.33 | 244.33 | Ce BSB | |
| 371.48 | 372.48 | Ce (PeDS)2 | |
| 461.60 | 462.60 | Ld (BS)(PeDS)PeD, Ld (PeDS)2B, Ld (PeDS) (BS)PeD | |
| 561.69 | 562.69 | Ld (PeDS)2 (BS) | |
| 601.90 | 602.90 | Ce (BS)3PeD, Ce (BS)2 (PeDS)B | |
| 701.89 | 702.89 | Ce (BS)3 (PeDS) | |
| 743.92 | 744.92 | Ce (PeDS)4 | |
| 834.08 | 835.08 | Ld (PeDS)4B, Ld (PeDS)3 (BS) PeD | |
| 874.08 | 875.08 | Cd (BS)4 (PeDS), Cd S(BS)4PeD | |
| 1064.29 | 1065.29 | Ld (BS)5(PeDS), Ld S(BS)5PeD | |
| 1188.84 | 1189.84 | Ce (PeDS)5 (BS)PeD | |
| P(BS-co-20%HDO) | 117.24 | 118.24 | Ld S |
| 189.21 | 190.21 | Ld BS | |
| 244.33 | 245.33 | Ce BSB | |
| 433.50 | 434.50 | Ld (BS)2B | |
| 461.60 | 462.60 | Ld (BS)2H, Ld (BS)(HS)B | |
| 561.68 | 562.68 | Ld (BS)2(HS), Ld S(BS)2H | |
| 699.95 | 700.95 | Ce (HS)3H, Ce S(HS)3 | |
| 834.06 | 835.06 | Ld (BS)3 (HS)H, Ld S(BS)3 (HS) | |
| 872.16 | 873.16 | Ce (HS)4B | |
| 1101.01 | 1102.01 | Ce (HS)5H, Ce S(HS)5 | |
MD and alignment
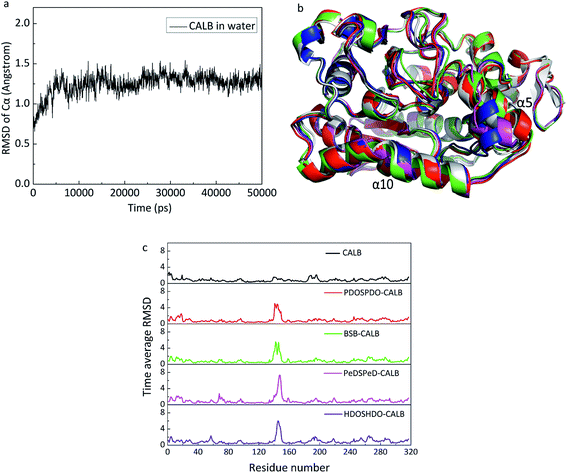
MD was carried out to explain the catalytic behavior of CALB on the copolyesters from a molecular perspective. In the computational simulation, CALB was adopted as the starting structure. CALB belongs to the serine proteases, with catalytic triad Ser105–His224–Asp187, helix α5 (142–146) and α10 (268–287), which form the accessible active site and have a high mobility to change conformation for the substrate binding. The hydrophobic residues, Leu278, Ala281 and Ile285 are located at the entrance of the active pocket to accommodate the ligand. In addition, Leu144, Val154 and Val149 are located at the top of the active pocket to stabilize the tetrahedral substrate. The CALB average structure of stable stage derived from 50 ns MD simulation, which supported the root-mean-square deviation (RMSD) of Cα, represented the equilibrium state of the protein and was the monitor to evaluate the structural integrity of protein. In Fig. 8a, at the beginning of the simulation below 10 ns, the protein underwent intramolecular movement and the structure was largely adjusted to accommodate the entire water system. Therefore, the RMSD value had a large range of changes. At 10–25 ns, although the local structure of the protein remained better, relative movement occurred at the various domains of the protein, resulting in overall RMSD fluctuations. After 25 ns, the smaller volatility indicated that the overall structure of the protein tended to be stable. Finally, the stable output conformation was used for subsequent simulation studies. With regards to the substrates, it is necessary to investigate the selection, as is well known that the acyl group can excite enzymes. Taking the mole ratio of feed materials into the consideration, we can know that the substrates include hydroxyl terminal groups. The docking procedure can get all the possible poses of substrates binding to the enzymes.We also carried out the MD simulations of every copolyester with both wanted ligands and unwanted ligands to get the average structure of each system (Fig. 8b). The superimposition revealed that the CALB of the five systems maintained a stable state of the structure and the maximum difference occurred at the helix α5, indicating that the helix α5, as a very mobile element, is an important channel for the ligand to entering the CALB active pocket. In order to further explore the changes in CALB structure caused by the interaction with the substrate in all systems, the averaged RMSD values of radical individual residues were calculated (Fig. 8c). The RMSD values of residues were independently less than 2 Å in each system except for the residues at 140–148 around helix α5. Compared with CALB, it can be seen that the ligand-containing systems exhibited higher RMSD values of in the vicinity of the helix α5 (140–148) and helix α10 (265–270), elucidating that the presence of the substrate led to a response in helix α5, where interactions between the substrate and CALB. The order of RMSD values can be presented as follows: PDOSPDO-CALB ≈ BSB-CALB < PeDSPeD-CALB ≈ HDOSHDO-CALB, revealing that the latter two copolyesters had a higher flexibility in helix α5. During the catalytic processes, the helix α5 exhibited very high flexibility and significance for CALB function. The higher the flexibility of the helix α5, the easier it is for the combination between CALB and the substrate. Therefore, the latter two are more likely to carry out enzymatic reactions.
Molecular docking analysis
Molecular docking studies can provide a structural insight into the interactions between compounds and the pocket residues of CALB. On the basis of the degradation results, we set about investigating the molecular interpretation of the interaction sites between ligands and receptors of binding free energies and the conformational changes during the combination process. The calculated docking results based on the molecular force field are listed in Table 4, which consists of binding free energy (Ebinding), intermolecular energy (Einter-mol), including van der Waals (vdW), hydrogen bonding (h bond), and desolvation potential (desolv), electrostatic energy (Eelec), total internal energy (Etotal-internal), unbond energy (Eunbond) and torsional energy (Etorsional).44 According to the formula, that is, Ebinding = Einter-mol + Etotal-internal + Etorsional − Eunbond, and Einter-mol = EvdW + Ehbond + Edesolv + Eelec, we can clearly understand the relationship between all these energies. In addition, the Etorsional only depends on the number of torsion bond.| Enzyme | Ligand | Ebindingb (kcal mol−1) | Einter-molc (kcal mol−1) | Etotal-internald (kcal mol−1) | Etorsionale (kcal mol−1) | EvdW–hbond–desolvf (kcal mol−1) | Eelecg (kcal mol−1) |
|---|---|---|---|---|---|---|---|
| a The binding results were obtained by analyzing the 200 docking poses performed by AutoDock 4.2.b Binding free energy.c Intermolecular energy.d Total internal energy.e Torsional energy.f Energies of van der Waals, hydrogen bonding, desolvation potential.g Electrostatic energy. | |||||||
| CALB | BSB | −4.04 | −8.51 | −1.25 | 4.47 | −8.33 | −0.22 |
| PDOSPDO | −4.61 | −8.49 | −1.47 | 3.88 | −8.17 | −0.29 | |
| PeDSPeD | −4.76 | −9.83 | −0.71 | 5.07 | −9.74 | −0.24 | |
| HDOSHDO | −4.67 | −10.34 | −1.09 | 5.67 | −10.27 | −0.21 | |
In Table 4, the biding free energies of PDOSPDO-CALB, PeDSPeD-CALB and HDOSHDO-CALB were successfully calculated to be −4.61, −4.76 and −4.67 kcal mol−1, which were lower than that of CALB-BSB, −4.04 kcal mol−1. In accordance with our analyses of the enzymatic degradation, the free energy of binding CALB-PeDSPeD was the lowest, indicating that the enzyme was more preferred to bind to PeDSPeD so that the copolyester P(BS-co-PeD) performed the best behavior during degradation.
Protein–ligand interaction analysis
As previously stated, the ligands rotate chemical bonds and expose acyl groups to the favourable residues to obtain hydrogen bonds in order to adjust and enter the acyl-binding pocket with the catalytic triad of Ser105–His224–Asp187 triumphantly further to surely implement the chemical reaction. The key hydrogen bonds were analyzed to get more details about the binding between the ligand and enzyme, shown in Fig. 9. Owing to the docking type, the hydrogen bond formed in Ser105 and His224 was fixed at 1.7 Å and remained unchanged. According to the analysis, the nitrogen of His224 formed a hydrogen bond with the ligand in four complexes, PeDSPeD had the minimum value of 1.9 Å, whereas the maximum value of 2.5 Å was BSB. The shorter distance of hydrogen bond, the easier the catalytic reactions. Once the ligand was in contact with the active site, the tetrahedral intermediate formed, and the Thr40 and Gln106 formed an oxyanion hole and donate three hydrogen bonds to maintain the stability of the tetrahedral substrate to ensure the catalytic processes.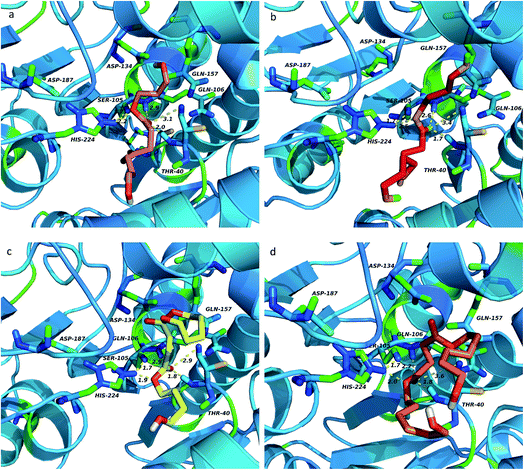 | ||
| Fig. 9 Key hydrogen bonds analysis of ligands top-ranking conformations binding to enzyme: (a) PDOSPDO, (b) BSB, (c) PeDSPeD, (d) HDOSHDO. The hydrogen bonds were depicted in yellow dot lines. | ||
According to the analysis, Thr40 and Gln106 offered the shortest and most stable hydrogen bonds to the PeDSPeD ligand, followed by BSB, HDOSHDO, PDOSPDO in turn. Although Thr40 and Gln106 donated the shorter hydrogen bonds to ligand BSB than to HDOSHDO, the first accepted hydrogen bond from His224 was longer, which can't make the catalytic reaction run smoothly like others. Meanwhile, Thr40, Asp134 and Gln157 formed a hydrogen bond network to allow solvent accessibility. On the other hand, with the number of carbon atoms on the main chain increases, the flexibility of the substrate is improved, providing more conformations to fit the active enzyme pocket.
Thus, it is notable that the formation and stability of tetrahedral intermediate can guarantee the success of enzyme-induced catalytic reaction. In addition, the complex PeDBPeD-CALB created the most stable system, which was consistent with the previous experiment and simulation, and the copolyester P(BS-co-PeD) showed excellent degradability of all.
A two-dimensional view displays a simplified representation of the ligand–receptor interactions, as depicted in Fig. 10. As discussed above, hydrogen bond interactions between the ligands and the active site indeed occurred with support from Thr40 and Gln60. Hydrophobic residues, such as Ile189, Leu278 and Ile285, were surrounding the ligand, representing the hydrophobic region around the active pock of enzyme. With the increased in carbon chain length, the hydrophobic effects of enzyme and substrate increased, leading to a more stable transition state and further facilitating the catalytic process. The hydrophobic effects of the four complexes was in the orders of PDOSPDO-CALB ≈ BSB-CALB < PeDSPeD-CALB ≈ HDOSHDO-CALB, which was in accordance with the experimental results. At the same time, the solvent entered into the active pocket through a hydrogen bond network formed by Thr40, Asp134 and Gln157, followed by an exposed ligand, thus facilitating the reaction take place smoothly.
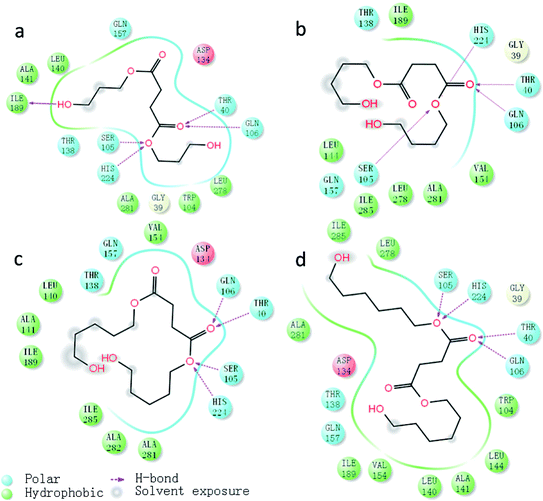 | ||
| Fig. 10 Two-dimensional view of ligand–receptor interactions, hydrogen bonds were in purple dash line: (a) PDOSPDO-CALB, (b) BSB-CALB, (c) PeDSPeD-CALB, (d) HDOSHDO-CALB. | ||
Conclusions
In this study, we have introduced the different third monomers to alter the degradability of pure PBS. Molecular simulation was performed in order to provide a molecular explanation to the interaction of the ligand–protein complex. The experiment results showed that the order of degradation rate was P(BS-co-PeD) > P(BS-co-HDO) > P(BS-co-PDO) > PBS, indicating that all the copolyesters modified by the short chain monomers were more easily degraded than pure PBS due to the irregular chain segment breaking the spiral structure of PBS, thus providing more amorphous region for CALB to interact.Combined with molecular simulations, MD revealed that the overall conformation of CALB was stable in water. The enzyme, adhering to the substrates PeD and HDO, exhibited a higher flexibility in helix α5 that can make CALB more easily bind to the substrate, thereby facilitating the enzymatic reaction and resulting in better degradation performance. As for molecular docking, it can be seen that PeDSPeD-CALB had the lowest free energy of binding, and presented the outstanding degradability for the copolyester P(BS-co-PeD). Moreover, the shortest and strongest hydrogen bonds of PeDSPeD-CALB around the active site pocket also showed a the tight combination, indicating that the presence of PeD did accelerate the degradation of PBS. All the molecular simulations match well with the experimental results and provide another potential way to get insight into the degradation mechanism of polyesters.
Conflicts of interest
There are no conflicts to declare.Acknowledgements
We acknowledge the financial support from the Research Fund at the People's Government of Shaanxi Province of China (2016CG-10), and the research is funded by Shaanxi University of Science and Technology (BJ15-21).Notes and references
- D. Lithner, A. Larsson and G. Dave, Sci. Total Environ., 2011, 409, 3309–3324 CrossRef CAS PubMed.
- E. H. Chelsea, M. Rochman, B. T. Hentschel and S. Kaye, Environ. Sci. Technol., 2013, 47, 1646–1654 Search PubMed.
- C. Vilela, A. F. Sousa, A. C. Fonseca, A. C. Serra, J. F. J. Coelho, C. S. R. Freirea and A. J. D. Silvestrea, Polym. Chem., 2014, 5, 3119–3141 RSC.
- Y. Sasanuma, Y. Nonaka and Y. Yamaguchi, Polymer, 2013, 56, 327–339 CrossRef.
- M. A. Hillmyer and W. B. Tolman, Acc. Chem. Res., 2014, 47, 2390–2396 CrossRef CAS PubMed.
- Z. Wu, K. Zheng, J. Zhang, T. Tang, H. Guo, A. R. Boccaccini and J. Wei, J. Mater. Chem. B, 2016, 4, 7974–7988 RSC.
- M. Zhang, M. L. Ding, T. Zhang and J. M. Yang, Chem. J. Chin. Univ., 2010, 31, 612–615 CAS.
- J. Wang, L. Zheng, C. Li, W. Zhu, D. Zhang and G. Guan, Ind. Eng. Chem. Res., 2012, 51, 10785–10792 CrossRef CAS.
- M. Gigli, M. Govoni, N. Lotti and E. D. Giordano, RSC Adv., 2014, 4, 32965–32976 RSC.
- G. Totaro, L. Sisti, A. Celli, H. Askanian, V. Verney and F. Leroux, RSC Adv., 2016, 6, 4780–4791 RSC.
- L. Genovese, N. Lotti, M. Gazzano, V. Siracusa, M. Dalla and A. Munari, Polym. Degrad. Stab., 2016, 132, 191–201 CrossRef CAS.
- V. Siracusa, N. Lotti, A. Munari and M. Dalla Rosa, Polym. Degrad. Stab., 2015, 119, 35–45 CrossRef CAS.
- A. Jäger, D. Gromadzki, E. Jäger, F. C. Giacomelli, A. Kozlowska, L. Kobera, J. Brus, B. Říhová, M. El Fray, K. Ulbrich and P. Štěpánek, Soft Matter, 2012, 8, 4343–4354 RSC.
- M. Gigli, M. Fabbri, N. Lotti, R. Gamberini, B. Rimini and A. Munari, Eur. Polym. J., 2016, 75, 431–460 CrossRef CAS.
- J. Wang, L. Zheng, C. Li, W. Zhu, D. Zhang, G. Guan and Y. Xiao, Ind. Eng. Chem. Res., 2012, 51, 10785–10792 CrossRef CAS.
- M. Gigli, A. Negroni, M. Soccio, G. Zanaroli, N. Lotti, F. Fava and A. Munari, Green Chem., 2012, 14, 2885–2893 RSC.
- H. Maeda, Y. Yamagata, K. Abe, F. Hasegawa, M. Machida, R. Ishioka, K. Gomi and T. Nakajima, Appl. Microbiol. Biotechnol., 2005, 67, 778–788 CrossRef CAS PubMed.
- M. Gigli, A. Negroni, M. Soccio, G. Zanaroli, N. Lotti, F. Fava and A. Munari, Polym. Degrad. Stab., 2013, 98, 934–942 CrossRef CAS.
- M. Gigli, A. Negroni, G. Zanaroli, N. Lotti, F. Fava and A. Munari, React. Funct. Polym., 2013, 73, 764–771 CrossRef CAS.
- M. Suhartini, H. Mitomo, F. Yoshii, N. Nagasawa and T. Kume, J. Polym. Environ., 2001, 9, 163–171 CrossRef CAS.
- Y. Jiang, A. J. J. Woortman, G. O. R. A. van Ekenstein and K. Loos, Biomolecules, 2013, 3, 461–480 CrossRef PubMed.
- B. Réjasse, T. BessonEn, M.-D. Legoy and S. Lamare, Org. Biomol. Chem., 2006, 4, 3703–3707 Search PubMed.
- J. Uppenberg, M. T. Hansen, S. Patkar and T. A. Jones, Structure, 1994, 2, 293–308 CrossRef CAS PubMed.
- J. Uppenberg, N. öhrner, M. Norin, K. Hult, G. J. Kleywegt, S. Patkar, V. Waagen, T. Anthonsen and T. A. Jones, Biochemistry, 1995, 34, 16838–16851 CrossRef CAS PubMed.
- M. Skjøt, L. De Maria, R. Chatterjee, A. Svendsen, S. A. Patkar, P. R. Østergaard and J. Brask, ChemBioChem, 2009, 10, 520–527 CrossRef PubMed.
- F. van Rantwijk, F. Secundo and R. A. Sheldon, Green Chem., 2006, 8, 282–286 RSC.
- T. Zisis, P. L. Freddolino, P. Turunen, M. C. F. van Teeseling, A. E. Rowan and K. G. Blank, Biochemistry, 2015, 54, 5969–5979 CrossRef CAS PubMed.
- M. Happe, P. Grand, S. Farquet, S. Aeby, J.-C. Héritier, F. Corthay, E. Mabillard, R. Marti, E. Vanoli, A.-F. Grogg, S. Nussbaum, A. Roduit, F. Tièche, S. Salem, C. Constantin, E. Schmitt, S. Zahno, C. Ellert, A. Habib, J. Wyss and F. Fischer, Green Chem., 2012, 14, 2337–2345 RSC.
- Q. Wu, P. Soni and M. T. Reetz, J. Am. Chem. Soc., 2013, 135, 1872–1881 CrossRef CAS PubMed.
- S. Jung, J. Kim and S. Park, RSC Adv., 2013, 3, 2590–2594 RSC.
- Z. Gan, H. Abe and Y. Doi, Biomacromolecules, 2001, 2, 313–321 CrossRef CAS PubMed.
- F. Jbilou, C. Joly, S. Galland, L. Belard, V. Desjardin, R. Bayard, P. Dole and P. Degraeve, Polym. Test., 2013, 32, 1565–1575 CrossRef CAS.
- J. C. Hermann, R. Marti-Arbona, A. A. Fedorov, E. Fedorov, S. C. Almo, B. K. Shoichet and F. M. Raushel, Nature, 2007, 448, 775–779 CrossRef CAS PubMed.
- H. Farrokhpour, V. Pakatchian, A. Hajipour, F. Abyar, A. Najafi Chermahini and F. Fakhari, RSC Adv., 2015, 5, 68829–68838 RSC.
- J. Qin, M. Zhang, C. Zhang, C. Li, Y. Zhang, J. Song, H. M. Asif Javed and J. Qiu, RSC Adv., 2016, 6, 17896–17905 RSC.
- D. S. Goodsell and A. J. Olson, Proteins: Struct., Funct., Genet., 1990, 8, 195–202 CrossRef CAS PubMed.
- B. A. Tejo, A. B. Salleh and J. Pleiss, J. Mol. Model., 2004, 10, 358–366 CrossRef CAS PubMed.
- E. Krieger, G. Koraimann and G. Vriend, Proteins: Struct., Funct., Genet., 2002, 47, 393–402 CrossRef CAS PubMed.
- T. Darden, D. York and L. Pedersen, J. Chem. Phys., 1993, 98, 10089–10092 CrossRef CAS.
- G. M. Morris, R. Huey, W. Lindstrom, M. F. Sanner, R. K. Belew, D. S. Goodsell and A. J. Olson, J. Comput. Chem., 2009, 30, 2785–2791 CrossRef CAS PubMed.
- G. M. Morris, D. S. Goodsell, R. S. Halliday, R. Huey, W. E. Hart, R. K. Belew and A. J. Olson, J. Comput. Chem., 1998, 19, 1639–1662 CrossRef CAS.
- J.-L. Stigliani, V. Bernardes-Génisson, J. Bernadou and G. Pratviel, Org. Biomol. Chem., 2012, 10, 6341–6349 CAS.
- W. L. DeLano, PyMOL: An Open-Source Molecular Graphics Tool, DeLano Scientific, San Carlos, CA, USA, 2002 Search PubMed.
- X. Hou, J. Du, J. Zhang, L. Du, H. Fang and M. Li, J. Chem. Inf. Model., 2012, 53, 188–200 CrossRef PubMed.
| This journal is © The Royal Society of Chemistry 2017 |

