 Open Access Article
Creative Commons Attribution 3.0 Unported Licence
DNA methylation differences of the BPI promoter among pig breeds and the regulation of gene expression†
HaiFei Wanga,
Jiayun Wua,
Sen Wua,
ShengLong Wuab and
WenBin Bao *ab
*ab
aKey Laboratory for Animal Genetics, Breeding, Reproduction and Molecular Design of Jiangsu Province, College of Animal Science and Technology, Yangzhou University, Yangzhou 225009, China. E-mail: wbbao@yzu.edu.cn
bJoint International Research Laboratory of Agriculture & Agri-Product Safety, Yangzhou University, Yangzhou 225009, Jiangsu, China
First published on 12th October 2017
Abstract
The bactericidal/permeability-increasing protein (BPI) exerts broad-spectrum bactericidal effects against Gram-negative bacteria and contributes to natural defenses. The expression patterns of BPI among different pig breeds and the underlying regulatory mechanisms remain elusive. In this study, we presented that the pig breeds of Yorkshire, Sutai and Meishan showed distinct BPI expression and promoter DNA methylation patterns. The promoter methylation level in Yorkshire pigs was significantly higher than that in Meishan pigs (P < 0.05), while the gene expression level displayed a reverse trend. Correlation analyses revealed a strong negative correlation between BPI promoter methylation and mRNA expression. Luciferase assay indicated that DNA methylation of BPI promoter can result in the reduction of BPI transcriptional activity in vitro. Furthermore, animals differing in E. coli F18 susceptibility showed that sensitive individuals had significantly higher promoter methylation and lower gene expression levels than those of resistant individuals (P < 0.05). Our study showed distinct BPI promoter methylation and gene expression patterns among different pig breeds, and provided evidence for the potential link between BPI promoter methylation, BPI expression and disease susceptibility. The findings bring us a step forward towards the understanding of regulatory mechanisms underlying BPI expression and provide fundamental information for further studies on elucidating the contribution of BPI to intestinal immunity.
Introduction
Bactericidal/permeability-increasing protein (BPI) is an antibacterial protein that is mainly secreted by neutrophils. BPI has several known biological functions, such as the ability to kill Gram-negative bacteria, neutralize free lipopolysaccharide, inhibit angiogenesis and the release of inflammatory mediators, and to reduce endotoxemia.1,2 The pig BPI protein has been shown to improve the resistance of pigs to Escherichia coli (E. coli) infection3 and neutralize endotoxins as well as kill Gram-negative bacteria.4 Balakrishnan et al. reported that injection of recombinant BPI protein could significantly attenuate endotoxemia caused by acute lung injury in pigs.5 The Meishan pigs and European pigs demonstrated pronounced discrepancies in the resistance to pathogenic infections including bacteria and viruses.6,7 In addition, Meishan and Large White pigs differed in innate immune traits including neutrophil, monocyte and lymphocyte counts.6 Thus the BPI gene could be an interesting candidate to interpret the variability of resistance of pigs to bacterial infection.DNA methylation is an epigenetic modification that is associated with various biological processes such as embryonic development, transcriptional regulation of a gene, genomic imprinting and inflammation.8 DNA methylation is stably inherited via cell division, and thus represents a major epigenetic modification.9 It is known that promoter methylation can repress the expression of genes by influencing the binding of transcription factors.10 Furthermore, we previously reported that promoter CpG island methylation of the BPI gene was negatively associated with the expression of this gene in the Sutai pigs.11 However, the functional consequences of BPI promoter methylation have not been illuminated.
The objectives of this study were to identify whether the BPI promoter exhibits distinct DNA methylation patterns in different pig breeds, and elucidate the molecular mechanisms underlying BPI expression. We measured the DNA methylation levels of BPI promoter in Meishan, Yorkshire and Sutai (Duroc × Taihu intercross) pig breeds. We have also performed functional analysis of the relationship between BPI promoter methylation and BPI expression. In addition, we explored the potential link between BPI promoter methylation, BPI expression in animals differing in disease susceptibility.
Experimental
Ethics statement
The animal study proposal was approved by the Institutional Animal Care and Use Committee (IACUC) of the Yangzhou University Animal Experiments Ethics Committee (permit number: SYXK (Su) IACUC 2012-0029). All experimental procedures were performed following the Regulations for the Administration of Affairs Concerning Experimental Animals approved by the State Council of the People's Republic of China.Animals and sample collection
The three pig breeds of Chinese domestic Meishan pigs, Western commercial Yorkshire pigs and hybrid Sutai (Duroc × Taihu) pigs (n = 5 per breed) at 35 days old were obtained from our three experimental farms, Changzhou Kangle Farming Co., Ltd. (National core pig breeding farm), Sutai Pig Breeding Center in Suzhou City of Jiangsu Province and Meishan Pig Conservation Breeding Company of Kunshan City, respectively. To circumvent the potential impacts of environmental factors such as feed type, weaning age and vaccination usage, the farms adopted the same feeding procedures for these individuals. The animals were allowed access to feed and water, and humanely sacrificed via intravenous injection of sodium pentobarbital. As representing the largest compartment of the immune system and being the main site for adhesion and colonization of enterotoxigenic E. coli,12,13 the small intestine was collected and used for subsequent analyses. In addition, we previously performed transcriptomic and proteomic analyses of the duodenum section which is one of the important sites of E. coli F18 strain colonization and replication.14–16 To extend our previous findings and better elucidate the molecular mechanisms underlying E. coli F18 infection, the duodenum section of the intestine was thus used in this study. The distal part of duodenum (approximately 2 cm circle segments) was collected and rinsed with phosphate buffer saline, and then placed in 1.5 mL nuclease-free tubes, immediately snap-frozen in liquid nitrogen and stored at −80 °C until analysis.In addition, six duodenum samples obtained from three pairs of Sutai pigs differing in E. coli F18 susceptibility were also used in this study. The E. coli F18 susceptibility was defined by the adherence assays, in which the animals whose intestinal epithelial cells showed nearly no adherence with E. coli F18 were defined as the resistant individuals, and those showed clear adherence were defined as the susceptible individuals. Verification of the susceptibility to E. coli F18 by the type V secretion system and collection of the duodenum samples have been described in our previous study.14
Bioinformatic analysis of BPI promoter
The 3 kb sequences (chr17: 41356468-41359467) upstream of the BPI gene were downloaded from the Ensembl database and analyzed for CpG island identification. CpG island was predicted using the online MethPrimer program17 and defined as the DNA regions greater than 100 bp with a C + G content equal to or greater than 50% and an observed CpG/expected CpG in excess of 0.6. Potential transcription factor binding sites (TFBS) within the CpG island were identified using the online tool AliBaba 2.1 (http://www.gene-regulation.com/pub/programs/alibaba2/index.html).Normal DNA PCR products sequencing
Genomic DNA was extracted from porcine duodenal tissues by standard phenol/chloroform method. The DNA sequence of a 489 bp fragment containing the CpG island was amplified to screen for single nucleotide polymorphisms (SNPs) in all individuals. PCR primer sequences are provided in ESI Table S1.† The PCR system contained 1.0 μL template DNA, 2 μL PCR buffer (10×), 0.8 μL dNTPs (10 mM), 2.2 μL Mg2+ (25 mM), 1.0 μL (10 μM) of each primer, 0.2 μL Taq DNA polymerase (5 U μL−1) and 12.8 μL sterilized distilled water. The PCR protocol was 5 min initial denaturation at 95 °C, followed by 40 cycles of 30 s at 95 °C, 30 s at 53 °C, 30 s at 72 °C, and a final extension step of 10 min at 72 °C. The PCR products were checked by electrophoresis in 1% agarose gels and sequenced by Invitrogen (Shanghai, China). The sequences were aligned to the pig reference genome (Sus scrofa 10.2) for SNP identification using the software BLAST (https://blast.ncbi.nlm.nih.gov/Blast.cgi).Bisulfite sequencing PCR methylation analysis
Genomic DNA was subjected to bisulfite conversion using the EpiTect bisulfite kit (Qiagen, Valencia, CA, USA) following the manufacturer's instructions. PCR assays were performed to amplify the bisulfite-treated DNA. The PCR primer sequences are provided in ESI Table S1.† The 50 μL reactions included 3 μL DNA template, 3 μL 10× PCR buffer, 2 μL Mg2+ (25 mmol L−1), 1 μL forward and reverse BSP primer (10 μM L−1), 1 μL dNTPs (10 mmol L−1), 0.8 μL Taq polymerase (5 U μL−1) and 38.2 μL distilled deionized water. The following reaction conditions were used: 98 °C for 4 min, then 20 cycles of 94 °C for 45 s, 66 °C for 45 s (reduced by 0.5 °C with each cycle) and 72 °C for 1 min; 20 cycles of 94 °C for 45 s, 56 °C for 45 s and 72 °C for 1 min, with a final extension at 72 °C for 10 min. The products (195 bp) were electrophoresed on 1% agarose gels and purified with TIANquick Midi purification kit (Tiangen Biotech, Beijing) according to the manufacturer's protocols. Purified PCR products were then cloned into the pMD18-T vector (Takara, Dalian, China) following the manufacturer's guidelines. Colony PCR assays were performed for the identification of positive clones. A total of 10–20 positive clones for each sample were randomly selected for sequencing (Invitrogen Biotechnology, Shanghai, China). The bisulfite sequence data for CpG methylation level were analyzed by quantification tool for methylation analysis (QUMA) software.18Luciferase assays
The 1195 bp (chr17: 41357119-41358313) of BPI promoter sequences including the CpG island and 500 bp of upstream and downstream sequences were cloned into a CpG-free luciferase reporter vector kindly provided by Dr Klug and Dr Rehli.19 The sequence with SpeI and NcoI restriction sites was synthesized by Invitrogen Biotechnology (Shanghai, China). The sequence was then ligated into the CpG-free vector between SpeI-NcoI sites and transformed into BW23473 competent cells for plasmid construction. The constructs were treated with DNA methyltransferase SssI (NEB, Beijing, China) to methylate all cytosine residues at CpG sites. The methylated constructs were purified by TIANquick Midi purification kit (Tiangen Biotech, Beijing) according to the manufacturer's protocols and quantified using a Nanodrop Spectrophotometer (Thermo Scientific, Wilmington, USA). IPEC-J2 cells were co-transfected with 100 ng CpG-free vector either with or without respective insert together with 2 ng of pRL-TK vector as an internal control reporter, using Lipofectamine 2000 (Invitrogen, Carlsbad, USA) in 96-well plates following the manufacturer's instructions. Luminescence was tested after 24 hours transfection using the dual-luciferase reporter assay system (Promega, Madison, USA) on a Tecan Infinite 200 microplate reader (Tecan, Switzerland).Real-time PCR
Total RNA was extracted from the duodenal tissues using RNAiso Plus and reversely transcribed into cDNA using PrimerScript RT reagent Kit with gDNA Eraser (TaKaRa, Dalian, China) following the manufacturer's protocols. The real-time PCR (RT-PCR) assay was performed in 20 μL reaction mixtures containing 2 μL (100 ng) cDNA, 0.4 μL of each forward and reverse primer (10 μmol L−1), 10 μL SYBR Green RT-PCR Master Mix (2×), 0.4 μL ROX Reference Dye II (50×), and 6.8 μL distilled deionized water. The RT-PCR reactions were amplified at 95 °C for 30 s, followed by 40 cycles of 95 °C for 5 s and 62 °C for 34 s. Each sample was tested in triplicate in three independent experiments to ensure the reproducibility of the data. Glyceraldehyde-3-phosphate dehydrogenase (GAPDH) was used as an internal reference, and the 2−ΔΔCt method was used to determine the mean relative expression levels of BPI.20 All primers (ESI Table S1†) were synthesized by Invitrogen Biotechnology (Shanghai, China).Statistical analyses
Statistical analyses were carried out using SPSS 15.0 software (SPSS Inc., Chicago, IL, USA). The BPI promoter methylation and gene expression levels of five individuals in each breed were averaged respectively. To analyze the statistical significance of differences in methylation level and mRNA expression among the three breeds, the least significant difference (LSD) method was performed to determine the significance at a 5% significance level. Pearson's correlation was conducted to analyze the associations between BPI promoter methylation and gene expression levels, and the significance level was set at 5%.Results
Identification of CpG island and transcription factor binding sites in the BPI promoter
One CpG island located in chr17: 41357619-41357813 was identified in the 3 kb sequence upstream of the BPI gene (ESI Fig. S1†). Five putative transcription factor binding sites (TFBS) were predicted in the CpG island (ESI Fig. S2†), of which the sites for transcription factors AP-2, NF-1 and Pax-3 contained CpG sites.Verification of the PCR products of normal DNA and bisulfite-modified DNA
The PCR products were checked by 1% gel electrophoresis (ESI Fig. S3†). The sizes of PCR products had expected length (489 bp and 195 bp) and the product bands were specific, indicating that the PCR products could be used for subsequent analysis.SNPs identification, CpG methylation and BPI expression
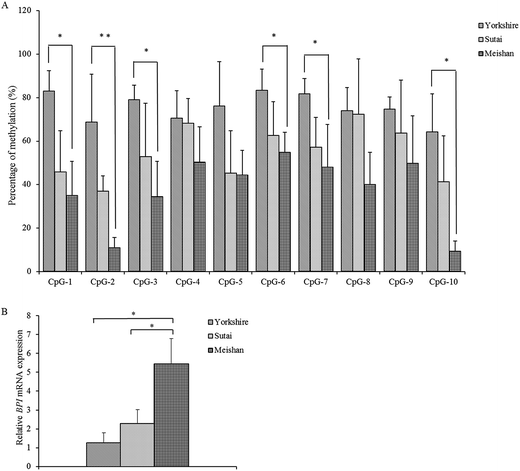
The PCR products of a 489 bp fragment containing the CpG island for all individuals were sequenced using Sanger sequencing. After alignment to the pig reference genome, no SNPs were identified within the sequence. The CpG methylation levels of each CpG site within the CpG island are presented in Fig. 1A. The methylation levels of CpG-1, CpG-2, CpG-3, CpG-6, CpG-7 and CpG-10 in Yorkshire pigs were significantly higher than in Meishan pigs (P < 0.05). The BPI expression level was significantly lower in Yorkshire pigs than in Meishan pigs (P < 0.05, Fig. 1B).Correlation between expression of BPI and the overall methylation level of the CpG island
Bisulfite sequencing PCR revealed a strong negative correlation (R = −0.8125, r0.01 = 0.64, r0.01 is the correlation coefficient threshold) between expression of the BPI gene and the overall methylation status of the CpG island in the BPI promoter region in duodenum across the three pig breeds. Moreover, the mRNA expression level of BPI ranged from low to high in Yorkshire, Sutai and Meishan pigs, whereas the overall methylation status of BPI promoter CpG island exhibited an opposite trend (Fig. 2). The expression of BPI mRNA was significantly higher in Meishan pigs than in Yorkshire pigs (P < 0.05), while the overall methylation status of the CpG island was significantly lower in Meishan pigs than in Yorkshire pigs (P < 0.05).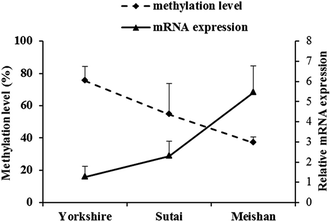 | ||
| Fig. 2 Relationship between BPI gene relative mRNA expression and promoter CpG island methylation levels in the duodenum of three pig breeds. | ||
Correlation between expression of BPI and methylation of individual CpG sites
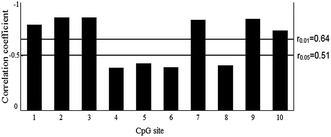
The methylation status of all ten CpG sites in the CpG island of the BPI promoter was obtained. Pearson correlation analysis was performed to test the relationship between the methylation level of each CpG site and BPI expression. The results revealed a negative correlation between BPI expression and the methylation level of the ten CpG sites (Fig. 3). The CpG site methylation level in relation to BPI expression for each individual is shown in ESI Fig. S4.† The negative relationship was statistically significant for CpG-1, CpG-2, CpG-3, CpG-7, CpG-9 and CpG-10 (P < 0.01).Functional analysis of BPI promoter CpG island methylation
Luciferase assays were conducted to functionally test if DNA methylation in BPI promoter regulates gene expression. The 1195 bp BPI promoter sequences were inserted into a CpG-free luciferase reporter vector that can be utilized to test the effects of CpG methylation on transcriptional activity of promoters. The constructed plasmid was methylated with DNA methyltransferase SssI or mock-methylated, and then transfected into IPEC-J2 cells for luciferase activity analysis. The results showed that methylation of the promoter sequences suppressed reporter gene expression to 28 ± 10.6% which was significantly lower than that of controls (P < 0.05, Fig. 4), indicating that increased DNA methylation level of BPI promoter can result in reduction of BPI transcriptional activity. Furthermore, we identified the BPI promoter methylation and mRNA expression in three pairs of Sutai pigs differing in E. coli F18 susceptibility. The results demonstrated that the DNA methylation level of BPI promoter was significantly higher in sensitive individuals than in resistant individuals (P < 0.05, Fig. 5A), while the expression level of BPI was significantly lower in sensitive individuals (P < 0.05, Fig. 5B).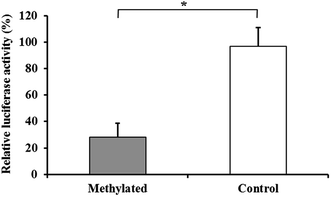 | ||
| Fig. 4 Analysis of the effects of BPI promoter methylation on transcriptional activity. Bars represent mean ± standard deviation (N = 3). *P < 0.05. | ||
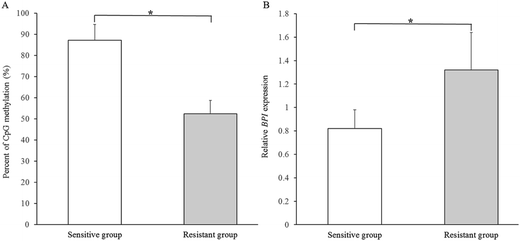 | ||
| Fig. 5 The BPI promoter methylation level (A) and BPI expression (B) in individuals differing in E. coli F18 susceptibility. Bars denote mean ± standard deviation (N = 3). *P < 0.05. | ||
Discussion
In this study, we observed that the three pig breeds exhibited distinct DNA methylation patterns of BPI promoter methylation in duodenum. In addition, we provided evidence for the functional consequence of promoter methylation on BPI expression. Analyses of the individuals differing in E. coli F18 susceptibility further confirmed the negative relationship between BPI promoter methylation and mRNA expression and suggested a potential link between BPI promoter methylation, BPI expression and disease susceptibility.As an important antibacterial protein, identification of the regulatory mechanisms underlying BPI expression will enable us to better understand the functional roles of BPI in antibacterial infection. It has been shown that overexpression of BPI significantly attenuates bacterially induced signaling,21 indicating the significance of expression regulation of the BPI gene. DNA methylation as one of the mechanisms for controlling gene expression provides a molecular means to elucidate the regulation of BPI expression. Moreover, our previous work revealed the negative relationship between BPI promoter methylation and its expression in duodenum of pigs.11 Our functional analysis demonstrated that increased DNA methylation of BPI promoter resulted in the decrease of transcriptional activity in vitro, which provides further evidence for the negative relationship between BPI promoter methylation and gene expression. Nevertheless, variations in BPI promoter methylation whether have direct impacts on gene expression in vivo needs to be further investigated.
The variability in BPI expression between different breeds has been previously identified, while the underlying molecular mechanisms remain largely unknown. To better reflect the differences of BPI promoter methylation and gene expression among different pigs, three representative pig breeds of Meishan, Yorkshire and Sutai were used in this work. Here we unraveled the differences in BPI promoter methylation pattern between the pigs of Meishan, Sutai and Yorkshire. Comparison analysis demonstrated Meishan pigs showed significantly lower methylation level and higher BPI expression than those of Yorkshire pigs. Given that DNA methylation status can be affected by environmental factors, the animals raised with the same feeding procedures were used to provide evidence for the link of these observed methylation differences with the pig breeds. In addition, the recent study has shown the breed-specific promoter methylation and mRNA expression of the glucocorticoid receptor gene between Large White and Erhualian pigs.22 Thus the breed differences may be an important factor influencing gene promoter methylation in the pig. Moreover, previous studies demonstrated that the variability in the gene specific methylation pattern is probably associated with the differences in prostate cancer susceptibility.23,24 Our analyses of BPI promoter specific methylation pattern in animals differing in E. coli F18 revealed that the resistant individuals exhibit lower methylation level and higher BPI expression, implicating the potential role of BPI promoter methylation in determining the susceptibility to bacterial infection.
It is an important pattern for methylated DNA to regulate gene expression by affecting transcription factor occupancy.25 Transcription factor prediction analysis herein revealed that there are putative binding sites for the transcription factors AP-2 and Pax-3, which include CpG sites showing significantly negative associations between the methylation levels and BPI expression. Particularly, the binding site for AP-2 contained three CpG sites (CpG-1, CpG-2 and CpG-3) and that for Pax-3 contained one CpG site (CpG-9). It has been reported that CpG methylation can inhibit binding of AP-2 and thereby regulate proenkephalin gene expression.26 In addition, DNA binding by Pax-3 was differentially influenced by methylation of the binding sites.27 These indicated that methylation of these CpG sites may affect the binding of AP-2 and Pax-3 to the promoter region and thereby modulate BPI expression. However, functional analysis is required to unveil the potential molecular event underlying regulation of BPI expression by CpG methylation.
Conclusions
In summary, we demonstrated that differences exist in the promoter methylation status and mRNA expression of the BPI gene between different pig breeds and that DNA methylation plays a role in the regulation of the BPI mRNA expression. We further revealed the potential link between BPI promoter methylation, BPI expression and disease susceptibility. Our findings bring us a step forward to the understanding of regulatory mechanisms underlying the BPI gene expression and provide fundamental information for further studies on elucidating the contribution of BPI to intestinal immunity.Competing interests
The authors declare that there are no competing interests.Acknowledgements
We would like to thank the native English speaking scientists of Elixigen Company (Huntington Beach, California) for editing our manuscript. This research was supported by the National Key Technology R&D Program of the Ministry of Science and Technology (2015BAD03B01), the National Natural Science Funds (31372285, 31172183), and the Priority Academic Program Development of Jiangsu Higher Education Institutions (PAPD).References
- D. W. van der Schaft, E. A. Toebes, J. R. Haseman, K. H. Mayo and A. W. Griffioen, Blood, 2000, 96, 176–181 CAS.
- H. Nishimura, A. Gogami, Y. Miyagawa, A. Nanbo, Y. Murakami, T. Baba and S. Nagasawa, Immunology, 2001, 103, 519–525 CrossRef CAS PubMed.
- J. Weiss, G. Wright, A. C. Bekkers, C. J. Van Den Bergh and H. M. Verheij, J. Biol. Chem., 1991, 266, 4162–4167 CAS.
- A. Chockalingam, C. E. McKinney, M. Rinaldi, D. S. Zarlenga and D. D. Bannerman, Vet. Microbiol., 2007, 125, 80–90 CrossRef CAS PubMed.
- A. Balakrishnan, S. A. Marathe, M. Joglekar and D. Chakravortty, Innate Immun., 2013, 19, 339–347 CrossRef PubMed.
- M. Clapperton, S. C. Bishop and E. J. Glass, Vet. Immunol. Immunopathol., 2005, 104, 131–144 CrossRef CAS PubMed.
- G. Reiner, J. Eckert, T. Peischl, S. Bochert, T. Jakel, U. Mackenstedt, A. Joachim, A. Daugschies and H. Geldermann, Vet. Parasitol., 2002, 106, 99–113 CrossRef CAS PubMed.
- C. Bock, Nat. Rev. Genet., 2012, 13, 705–719 CrossRef CAS PubMed.
- R. Lister, M. Pelizzola, R. H. Dowen, R. D. Hawkins, G. Hon, J. Tonti-Filippini, J. R. Nery, L. Lee, Y. Zhen, Q. M. Ngo, L. Edsall, J. Antosiewicz-Bourget, R. Stewart, V. Ruotti, A. H. Millar, J. A. Thomson, B. Ren and J. R. Ecker, Nature, 2009, 462, 315–322 CrossRef CAS PubMed.
- H. Zhu, G. H. Wang and J. Qian, Nat. Rev. Genet., 2016, 17, 551–565 CrossRef CAS PubMed.
- J. Wang, X. M. Yin, L. Sun, S. Y. Sun, C. Zi, G. Q. Zhu, S. L. Wu and W. B. Bao, Int. J. Mol. Sci., 2014, 15, 10989–10998 CrossRef CAS PubMed.
- J. M. Fleckenstein, P. R. Hardwidge, G. P. Munson, D. A. Rasko, H. Sommerfelt and H. Steinsland, Microbes Infect., 2010, 12, 89–98 CrossRef CAS PubMed.
- A. M. Mowat and W. W. Agace, Nat. Rev. Immunol., 2014, 14, 667 CrossRef CAS PubMed.
- W. B. Bao, L. Ye, J. Zhu, Z. Y. Pan, Z. D. Du, G. Q. Zhu, X. G. Huang and S. L. Wu, Anim. Genet., 2012, 43, 525–534 CrossRef CAS PubMed.
- L. Ye, X. M. Su, Z. C. Wu, X. R. Zheng, J. Wang, C. Zi, G. Q. Zhu, S. L. Wu and W. B. Bao, PLoS One, 2012, 7, e43741 CAS.
- Z. C. Wu, R. W. Xia, X. M. Yin, Y. J. Huo, G. Q. Zhu, S. L. Wu and W. B. Bao, PLoS One, 2015, 10, e0127164 Search PubMed.
- L. C. Li and R. Dahiya, Bioinformatics, 2002, 18, 1427–1431 CrossRef CAS PubMed.
- Y. Kumaki, M. Oda and M. Okano, Nucleic Acids Res., 2008, 36, W170–W175 CrossRef CAS PubMed.
- M. Klug and M. Rehli, Epigenetics, 2006, 1, 127–130 CrossRef PubMed.
- K. J. Livak and T. D. Schmittgen, Methods, 2001, 25, 402–408 CrossRef CAS PubMed.
- G. Canny, E. Cario, A. Lennartsson, U. Gullberg, C. Brennan, O. Levy and S. P. Colgan, Am. J. Physiol.: Gastrointest. Liver Physiol., 2006, 290, G557–G567 CrossRef CAS PubMed.
- Q. Sun, Y. Jia, R. Li, X. Li, X. Yang and R. Zhao, Animal, 2014, 8, 1851–1856 CrossRef CAS PubMed.
- P. M. Das, K. Ramachandran, J. Vanwert, L. Ferdinand, G. Gopisetty, I. M. Reis and R. Singal, Mol. Cancer, 2006, 5, 28 CrossRef PubMed.
- K. Woodson, J. Hanson and J. Tangrea, Cancer Lett., 2004, 205, 181–188 CrossRef CAS PubMed.
- M. T. Maurano, H. Wang, S. John, A. Shafer, T. Canfield and K. Lee, Cell Rep., 2015, 12, 1184–1195 CrossRef CAS PubMed.
- M. Comb and H. M. Goodman, Nucleic Acids Res., 1990, 18, 3975–3982 CrossRef CAS PubMed.
- M. D. Galibert, U. Yavuzer, T. J. Dexter and C. R. Goding, J. Biol. Chem., 1999, 274, 26894–26900 CrossRef CAS PubMed.
Footnote |
| † Electronic supplementary information (ESI) available. See DOI: 10.1039/c7ra05549h |
| This journal is © The Royal Society of Chemistry 2017 |

