 Open Access Article
Creative Commons Attribution 3.0 Unported Licence
Preparation of carbon aerogels from TEMPO-oxidized cellulose nanofibers for organic solvents absorption†
Meng Wang a,
Changyou Shaoa,
Sukun Zhoua,
Jun Yang*ab and
Feng Xu*a
aBeijing Key Laboratory of Lignocellulosic Chemistry, Beijing Forestry University, Beijing 100083, China. E-mail: xfx315@bjfu.edu.cn; yangjun11@bjfu.edu.cn; Fax: +86-10-62336903; Tel: +86-10-62337993 Tel: +86-10-62337223 Tel: +86-10-62336387
bState Key Laboratory of Pulp and Paper Engineering, South China University of Technology, Guangzhou 510640, China
First published on 3rd August 2017
Abstract
In this study, ultralight and hydrophobic carbon aerogels were prepared from 2,2,6,6-tetramethyl-1-piperidinyloxy (TEMPO)-oxidized cellulose nanofibers (TOCN) for the removal of organic solvents. The morphological structure, density and chemical composition of TOCN aerogels frozen at −56 °C and −196 °C, followed by pyrolysis, were examined. The obtained carbon-based aerogels possessed an ultralight density of 8.8 mg cm−3 and excellent fire-resistance. The high porosity (up to 99.5%) and hydrophobicity (contact angle of 139.6°) of the obtained carbon aerogels allowed them to adsorb various organic solvents with a high absorption capacity (up to 110–260 g g−1). After five absorption–combustion and absorption–distillation cycles, the absorption capacity of the TOCN carbon aerogels exhibited excellent recyclability with up to 64–99% of the initial absorption capability, demonstrating potential applications in the oil-spill-cleanup field.
Introduction
Owing to increased attention focused on marine pollution resulting from organic pollutants or oil spills, much effort has been made to produce efficient and economic absorbents, which can adsorb and separate organic pollutants from water.1,2 Oil recovery using absorbent material is superior to several other industrial methods for oil recovery, such as chemical methods (i.e., dispersion, in situ burning, and the use of solidifiers), physical collection, and biodegradation, because of the lower costs, higher efficiency and excellent recyclability of most absorbents.3 Recently, people have paid much attention to the development of porous materials as absorbents because of their high oil–water separation properties. Various natural materials such as expanded perlite4 and zeolites5 and organic materials such as wool fiber,6 activated carbon,7 and sawdust have been reported as porous adsorbents for cleaning oil spills.8Carbon-based aerogels, composed of interconnected three-dimensional (3D) networks, have attracted wide attention because of their unique physical properties, such as ultra-low density, high electrical conductivity, continuous porosity, and high specific surface area.9,10 These properties offer numerous benefits for carbon-based aerogels as functional materials.11 Particularly, their 3D cross-linked networks with open pores allow access and fast diffusion of molecules into the material, providing the aerogels with excellent performance as super absorbents,12 gas sensors,13 electrode materials for batteries and super-capacitors,14 catalyst supports,15 and chemical and biological sensors.16
Traditionally, to fabricate carbon aerogels, resorcinol–formaldehyde organic aerogels are pyrolyzed in an inert atmosphere to form a highly cross-linked carbon structure, which possess a relatively high density (100–800 mg cm−3).17 Nowadays, carbon nanotube (CNT) sponges18 and their derivatives, have been prepared through chemical vapor deposition (CVD) with high sorption capacity. However, the harmful and expensive precursors, complicated process, and complex equipment involved in CNT fabrication hamper their large-scale production for industrial applications, which pushes us to explore a facile, economic and environmentally friendly strategy for mass production of new carbon-based aerogels.
Nanocellulose is one of the nanoscale building blocks prepared from disintegration of cellulose, and it shows particular promise for use in aerogel materials because of its sustainability, high strength, low density, liquid-crystalline properties, biodegradability, and general biocompatibility.19,20 Cellulose nanofibers can be disintegrated from the hierarchical structure of the macroscopic wood fibers via several methods, such as mechanical treatments, chemical treatments and chemo-mechanical methods. Since 2,2,6,6-tetramethyl-1-piperidinyloxy (TEMPO)-oxidized cellulose nanofibers (TOCNs) are made from native wood celluloses by TEMPO-mediated oxidation and successive mild disintegration, they always exhibit long aspect ratios (60–100), making them very flexible and easily entangled. When interwoven, TOCN can form highly porous and mechanically strong materials such as nanocellulose papers, films and aerogels.21,22
Although the aerogels prepared from cellulose have been widely documented, the transformation of cellulose aerogels into their carbonaceous forms has been less reported.9,18 Recently, carbon aerogels were produced from winter melon for recyclable oil absorption. However, the attained carbon aerogels showed low performance in sorption of oils and organic solvents (15–60 times).23 To date, there is a trend to produce carbon-based materials from biomass materials, as it is very cheap, easy to obtain, sustainable, and environmentally friendly, which further inspires us to explore TOCN carbon aerogels.23–25
In this study, 3D carbon aerogels were made by freeze-drying a suspension and post-pyrolyzing the aerogel using TOCN as the raw material. Considering that the freezing temperature would significantly affect the ice formation rate, we compared the effect of freezing temperature (−56 and −196 °C) on the morphology and physical properties of TOCN carbon aerogels. The ultralight, highly porous and hydrophobic carbon aerogels can selectively separate and remove oil and toxic organic solvents from water. It is expected that with a combination of low-cost biomass as a raw material, green preparation processes and outstanding recyclability, the TOCN carbon aerogels have promising applications in environmental and ocean protection.
Experimental
Materials
A commercial softwood kraft pulp was provided by Northwood Pulp and Timber Limited (Canada). The pulp was thoroughly washed with deionized water and used in its never-dried form. The 2,2,6,6-tetramethylpiperidin-1-oxyl (TEMPO) was purchased from Sigma-Aldrich. Sodium bromide, sodium hydroxide and sodium hypochlorite solution were received from Lanyi Medicine (Beijing). All chemicals were analytical grade and used without further purification. Ultrapure water was produced by a Heal Force purification system and used to prepare all aqueous solutions.Preparation of the TOCN aerogels
TOCN suspensions were prepared from softwood kraft pulp according to the previously published method.26 The cellulose fibers (1 g) were suspended in water (100 mL) containing TEMPO (0.016 g, 0.1 mmol) and sodium bromide (0.1 g, 1 mmol). The 12% NaClO solution was adjusted to pH 10 by the addition of 0.1 M HCl. The TEMPO-mediated oxidation was started by adding the desired amount of the NaClO solution (5.0 mmol NaClO per gram of cellulose) and continued at room temperature while stirring at 500 rpm. The pH was maintained at 10 by adding 0.5 M NaOH using a pH meter until no NaOH consumption was observed. The TEMPO-oxidized cellulose was thoroughly washed with water via centrifugation. Then, the TEMPO-oxidized cellulose suspension was fibrillated by a high-pressure homogenizer (APV-2000, 100 MPa) for 20 min. Thereafter, the TOCN suspensions were adjusted in concentration to 0.5, 1, 1.5, 2 wt% and stored at 4 °C before further treatment or analysis. After being transferred into a plastic beaker, the cellulose suspensions were frozen under two different temperatures: one was subjected to −196 °C in liquid nitrogen for 20 min and the other to −56 °C in an ultralow temperature refrigerator for 20 min. Then, the frozen samples were dried using a freeze-dryer (Scientz-10N, China) and the sponge-like TOCN aerogels were obtained. During freeze-drying, the cold trap temperature was below −56 °C and the vacuum was below 0.08 mbar. The obtained TOCN aerogels frozen at −196 °C and −56 °C were named T1 and T2, respectively.Preparation of the TOCN carbon aerogels
The obtained TOCN aerogels (∼0.2 g) were transferred into a tubular furnace for pyrolysis under nitrogen flow (30 mL min−1). The TOCN aerogels were heated to 500 °C at a heating rate of 2 °C min−1, kept at this temperature for 1 h, heated to 1000 °C at a heating rate of 5 °C min−1 and held at this temperature for 2 h to allow complete pyrolysis. Then, the sample was cooled to room temperature naturally, after which the samples of T1 and T2 post-pyrolysis were designated C1 and C2, respectively.Characterization
TOCN suspensions were dispersed in ethanol and ultrasonicated for 10 min. The homogeneous suspensions were collected using carbon film-covered copper grids and stained with phosphotungstic acid (2 wt%) for 10 s. These were then observed using transmission electron microscopy (TEM JEM-1010) at an accelerator voltage of 80 kV. The surface morphology of the TOCN aerogels and the carbon aerogels were observed by scanning electron microscopy (SEM, S-3400 N II). The fractured specimens were attached to the holders with conductive double-sided carbon tape and sputter coated with gold to avoid charging during the observation. The Fourier transform infrared spectroscopy (FTIR) spectra were measured using an infrared spectrophotometer (Nicolet iN10-MX, ThermoScientific). XRD patterns of the aerogels and carbon aerogels were recorded using a D8-Advance X-ray diffraction analyzer. X-ray photoelectron spectroscopy (XPS) measurements were performed on a Thermo ESCALAB 250 using a monochromic Al X-ray source. Specific surface area was calculated using the Brunauer–Emmett–Teller (BET) equation, and the pore size distribution plot was determined by the Barrett–Joyner–Halenda (BJH) theory (SSA-700, Beijing, China). The wetting properties of different samples were evaluated through contact angle tests, which were performed by the CAST2.0 contact angle analysis system at room temperature (Solon Information Technology Co, Ltd, Shanghai, China).Density
The TOCN aerogels and carbon aerogels were cut to an approximately 1 cm−3 volume. The dimensions and mass were measured using a digital caliper and balance to 0.01 mm and 0.1 mg resolution, respectively, in order to calculate the density of the aerogels.Porosity
The porosity of the aerogels (P) was calculated by the density of the aerogels (ρgel) and the density of the solid (ρsolid) as follows:
 | (1) |
Absorption capacity
The absorption capacity of TOCN carbon aerogels was measured by immersing a piece of TOCN carbon aerogel (∼1 cm3) in 30 mL organic solvents for 10 min and allowing it to saturate. The saturated carbon aerogel was then taken out for mass measurement. The organic solvents absorption capacity (g g−1) of TOCN carbon aerogels was calculated as follows:
 | (2) |
Adsorption kinetics
In order to further research the oil absorption kinetics of TOCN carbon aerogels, carbon aerogels adsorbed with gasoline and diesel oil were investigated. The carbon aerogels were taken out from the oil and weighed at several time intervals.Results and discussion
TOCN and its aerogel morphology
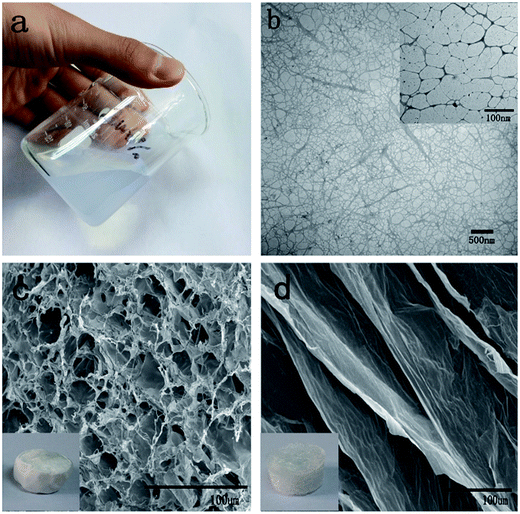
To produce cellulose fibers with high aspect ratios, softwood pulp fibers were used as the raw material in this study. Cellulose nanofibrils with an average width of 2–5 nm and lengths of up to several micrometers were prepared via coupled TEMPO mediated oxidation and homogenization (Fig. 1b and inset). After homogenization, the oxidized cellulose slurries were mostly converted to highly viscous dispersions and were stable for several months under ambient conditions (Fig. 1a). Indeed, the mechanical disintegration makes the cellulose fibers entangle with each other to form a denser network structure (Fig. 1b).The TOCN suspensions were adjusted to concentrations of 0.5, 1, 1.5 and 2 wt%; the density of the subsequent aerogels and carbon aerogels from these suspensions are shown in Table 1. The C1 and C2 prepared from 0.5 wt% concentration of TOCN had the lowest density and highest oil absorption but were fragile after absorption of oil (Table 2). The C1 and C2 prepared from 1.5 and 2 wt% concentration of TOCN possessed high density and low adsorption capacity (Table 2). As the porosity of TOCN carbon aerogel reduces, there is less space in the aerogel network for oil occupation, and thus the oil adsorption capacity lowers. Therefore, we finally chose a concentration of 1% as our final experimental concentration.
| TOCN concentration (wt%) | 0.5 | 1 | 1.5 | 2 |
|---|---|---|---|---|
| T1 (mg cm−3) | 5 ± 0.1 | 10 ± 0.2 | 15 ± 0.2 | 20 ± 0.2 |
| T2 (mg cm−3) | 5 ± 0.1 | 10 ± 0.2 | 15 ± 0.2 | 20 ± 0.2 |
| C1 (mg cm−3) | 4.4 ± 0.1 | 8.8 ± 0.2 | 13.1 ± 0.2 | 17.6 ± 0.2 |
| C2 (mg cm−3) | 2.9 ± 0.1 | 5.8 ± 0.1 | 8.7 ± 0.1 | 11.6 ± 0.2 |
| TOCN concentration (wt%) | 0.5 | 1 | 1.5 | 2 | |
|---|---|---|---|---|---|
| Porosity (%) | C1 | 99.75 ± 0.01 | 99.50 ± 0.02 | 99.26 ± 0.02 | 99.00 ± 0.02 |
| C2 | 99.83 ± 0.01 | 99.67 ± 0.01 | 99.50 ± 0.02 | 99.34 ± 0.02 | |
| Adsorption capacity (g g−1) | C1 | 166 ± 3 | 153 ± 3 | 144 ± 2 | 131 ± 2 |
| C2 | 178 ± 3 | 159 ± 3 | 153 ± 3 | 148 ± 2 | |
The TOCN suspension (1 wt%) was frozen at −196 °C and −56 °C, respectively, and freeze-dried to form aerogel. The results show that both T1 and T2 aerogels had similarly low densities (about 10 mg cm−3). However, the surface of T1 was more smooth than that of T2 (inset, Fig. 1c and d). As shown in SEM images, T1 appeared to contain numerous small pores (Fig. 1c), but T2 formed large sheet-like structures (Fig. 1d). This morphological distinction between T1 and T2 may be predominately attributed to the different freezing rates. Before freezing, the nanofibers were uniformly dispersed in water. During the freezing process, owing to the squeezing effect, the nanofibers at the boundary of the ice crystals were concentrated and aligned along the growth direction of the ice crystals.27 According to the reverse relationship between the ice nuclei sizes and the cooling rate, as the suspension was immersed in liquid nitrogen, the water in the surface of the suspension was frozen immediately. Due to the extremely low temperature, the ice crystallized quickly and the crystal size was small, leading to small pores in T1 (Fig. 1c). In contrast, for the specimens frozen at −56 °C, the ice crystals formed much more slowly, leading to the sheet-like structures seen in T2. Therefore, the larger ice crystal size in samples frozen at −56 °C resulted in the large sheet-like structure of T2.
Carbon aerogel morphology and properties
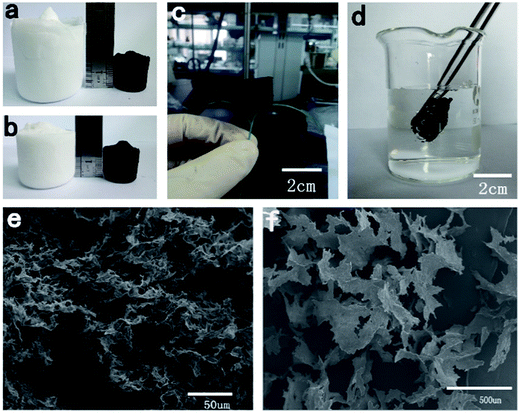
After pyrolysis, as shown in Fig. 2a and b, the volume of T1 and T2 shrank by about 75% and 62%, respectively, compared with the original volume of the TOCN aerogels. This difference may be attributed to the more rigid sheet-like structure of T2, which was more stable during the pyrolysis process. T1 and T2 had similar density, while they exhibited different volume shrinkage (75 and 62% v/v for T1 and T2, respectively), leading to a density difference between C1 and C2 (8.8 and 5.8 mg cm−3) after pyrolysis. Compared with T1 and T2, the weight loss of both C1 and C2 after pyrolysis was about 78% due to the release of water, CO2, CO, CH4 and some organics.28 The TOCN carbon aerogels showed ultralight properties (Fig. 2c), which are comparable to CNT sponges (5–10 mg cm−3)12 and graphene foam grown by CVD (5 mg cm−3).29 The porosity of C1 and C2 was calculated to be about 99.50% and 99.67%, respectively, showing high porosity. From SEM images of carbon aerogels in Fig. 2e and f, it is clear that the 3D porous structure and sheet-like structure was well maintained in C1 and C2.Surface area and porosity of carbon aerogels
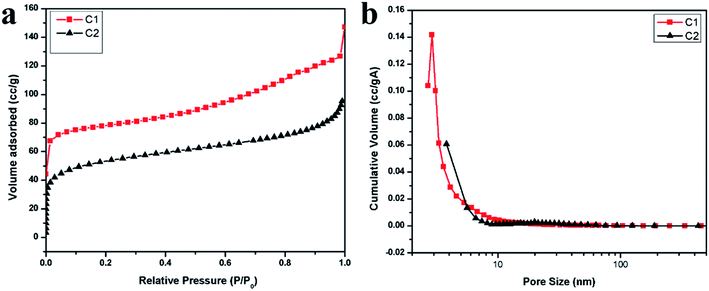
The N2 adsorption isotherms and the pore size distributions of the TOCN carbon aerogels are shown in Fig. 3a and b. With respect to the IUPAC classification, the isotherms for the samples of C1 and C2 are similar in shape to type II isotherms, indicating that an open surface is present in the TOCN carbon aerogels on which unrestricted monolayer–multilayer adsorption occurs.30 The sharp inflection points are present at a low relative pressure of about 0.1, showing the transition from micropore filling to multilayer adsorption. Then, the slow isotherm rise indicates multilayer adsorption of nitrogen on the exposed surface of the 3D structure in the carbon aerogels (Fig. 3a).31 This exposed surface makes the major contribution to oil absorption, rather than micropores or mesopores. Fig. 3b shows the distribution of internal surface area versus pore sizes for the two carbon aerogel samples. Table 3 summarizes surface area parameters of C1 and C2 obtained from the BET tests. Both C1 and C2 have large mesopores being consistent with the N2 adsorption isotherms. The large specific surface of C1, which is larger than C2, should be attributed to the smaller ice crystals formed during the low temperature freezing process.| Sample | Density (mg cm−3) | Porous (%) | BET surface area (m2 g−1) | Contact angle (°) |
|---|---|---|---|---|
| T1 | 10 ± 0.2 | 99.33 ± 0.02 | — | — |
| T2 | 10 ± 0.2 | 99.33 ± 0.02 | — | — |
| C1 | 8.8 ± 0.2 | 99.50 ± 0.02 | 249.91 | 139.6 ± 0.6 |
| C2 | 5.8 ± 0.1 | 99.67 ± 0.01 | 161.16 | 139.3 ± 0.5 |
When the obtained TOCN carbon aerogels were immersed in water, air bubbles appeared around its surface (Fig. 2d), and after releasing the external force, TOCN carbon aerogels floated immediately without any absorption of water. This result indicated that the obtained TOCN carbon aerogels were hydrophobic. In addition, the contact angles of C1 and C2 were examined, where the water droplets deposited on the TOCN carbon aerogel surfaces were almost spherical with the contact angles of 139.6° and 139.3° (Table 3), respectively. Considering the 3D porous structure and higher surface area, C1 was chosen for following adsorption experiments.
FTIR, XRD and XPS of aerogels
The Fourier transform infrared (FTIR) spectra were used to investigate the chemical composition of TOCN and TOCN carbon aerogels. As shown in Fig. 4a, the FTIR spectrum of the original cellulose material and TOCN showed several peaks of hydrophilic functional groups, such as C![[double bond, length as m-dash]](https://www.rsc.org/images/entities/char_e001.gif) O, C–O, and –OH. The peaks at 3340 cm−1 and 1047 cm−1 were attributed to the O–H stretching vibration and the C–O bond of cellulose, respectively,27 and the peaks at 2890 cm−1 and 1417 cm−1 corresponded to the C–H stretching and bending of the –CH2 groups, respectively.32 In addition, the peak at 1606 cm−1 was attributed to the H–O–H stretching vibration of absorbed water in the carbohydrate and the peak at 1730 cm−1 confirmed the presence of carboxylic acid groups. In contrast, peaks of hydrophilic functional groups, such as C
O, C–O, and –OH. The peaks at 3340 cm−1 and 1047 cm−1 were attributed to the O–H stretching vibration and the C–O bond of cellulose, respectively,27 and the peaks at 2890 cm−1 and 1417 cm−1 corresponded to the C–H stretching and bending of the –CH2 groups, respectively.32 In addition, the peak at 1606 cm−1 was attributed to the H–O–H stretching vibration of absorbed water in the carbohydrate and the peak at 1730 cm−1 confirmed the presence of carboxylic acid groups. In contrast, peaks of hydrophilic functional groups, such as C![[double bond, length as m-dash]](https://www.rsc.org/images/entities/char_e001.gif) O, C–O, and –OH, were all missing after pyrolysis, leading to the inference of hydrophobicity.
O, C–O, and –OH, were all missing after pyrolysis, leading to the inference of hydrophobicity.
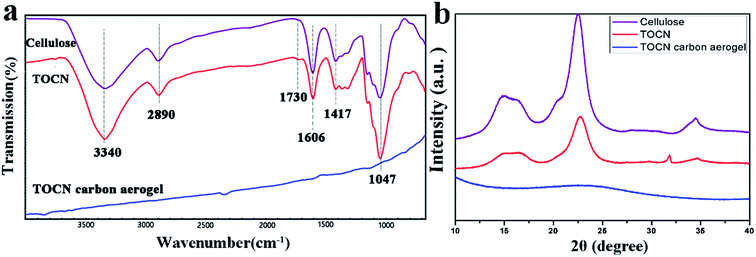 | ||
| Fig. 4 (a) and (b) FTIR spectra and XRD patterns of the cellulose, the TOCN and the TOCN carbon aerogels. | ||
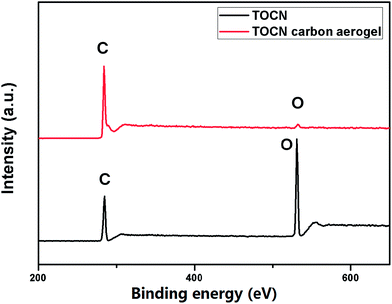
The X-ray diffraction (XRD) patterns (Fig. 4b) showed that both cellulose and TOCN aerogels exhibited the same diffraction peaks at 14.7, 16.8 and 22.7°, which corresponded to the (![[1 with combining macron]](https://www.rsc.org/images/entities/char_0031_0304.gif) 10), (110) and (200) planes of cellulose, respectively.33 These planes are typical crystal patterns of cellulose I, indicating that the native crystal structure of cellulose was preserved during the TEMPO oxidation process. After pyrolysis at 1000 °C, the peaks of TOCN aerogels almost diminish, suggesting that the crystalline structure of native cellulose was disrupted. TOCN carbon aerogels show a broad peak at ∼23°, indicating the formation of an amorphous phase.34 The elemental composition and bonding configurations of the TOCN carbon aerogels were investigated by XPS. As shown in Fig. 5, the C 1s and O 1s peaks are observed at 284.3 and 531.4 eV, respectively. The atom ratios of C to O are 1.39 and 27.57 for TOCN and the TOCN carbon aerogels, respectively, which are due to dehydration, decarboxylation and decarbonylation reaction during the pyrolysis process.35
10), (110) and (200) planes of cellulose, respectively.33 These planes are typical crystal patterns of cellulose I, indicating that the native crystal structure of cellulose was preserved during the TEMPO oxidation process. After pyrolysis at 1000 °C, the peaks of TOCN aerogels almost diminish, suggesting that the crystalline structure of native cellulose was disrupted. TOCN carbon aerogels show a broad peak at ∼23°, indicating the formation of an amorphous phase.34 The elemental composition and bonding configurations of the TOCN carbon aerogels were investigated by XPS. As shown in Fig. 5, the C 1s and O 1s peaks are observed at 284.3 and 531.4 eV, respectively. The atom ratios of C to O are 1.39 and 27.57 for TOCN and the TOCN carbon aerogels, respectively, which are due to dehydration, decarboxylation and decarbonylation reaction during the pyrolysis process.35
Organic solvents absorption performance of TOCN carbon aerogels
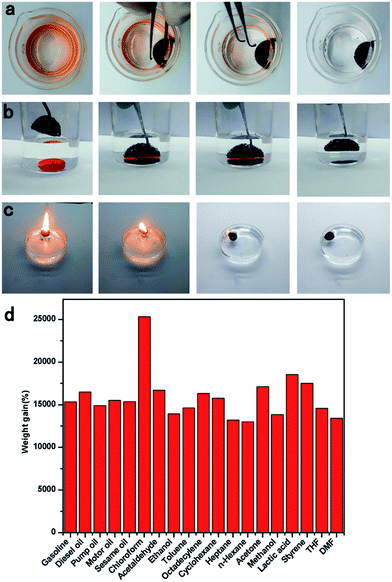
Owing to its surface hydrophobicity and high porosity, the TOCN carbon aerogel was an ideal candidate for highly efficient separation of organic solvents. As shown in Fig. 6a and Video S1,† when a hydrophobic TOCN carbon aerogel was immersed into the n-hexane and water mixture (1![[thin space (1/6-em)]](https://www.rsc.org/images/entities/char_2009.gif) :
:![[thin space (1/6-em)]](https://www.rsc.org/images/entities/char_2009.gif) 20 v/v, colored with Sudan III), it floated on the water surface and selectively absorbed n-hexane completely in 10 seconds, exhibiting excellent selectivity and adsorption rate. In addition, other high-density organic solvents like chloroform (stained with Sudan III), lying at the bottom of the water can also be selectively absorbed by the TOCN carbon aerogels in 6 seconds (Fig. 6b and Video S2†).
20 v/v, colored with Sudan III), it floated on the water surface and selectively absorbed n-hexane completely in 10 seconds, exhibiting excellent selectivity and adsorption rate. In addition, other high-density organic solvents like chloroform (stained with Sudan III), lying at the bottom of the water can also be selectively absorbed by the TOCN carbon aerogels in 6 seconds (Fig. 6b and Video S2†).
As shown in Fig. 6d, the sorption capacity of TOCN carbon aerogels with a variety of organic solvents has been investigated, including gasoline, toluene, ethanol, and acetone. The weight of absorbed substance per unit weight of the dried TOCN carbon aerogels was calculated to evaluate the sorption capacity quantitatively. As shown in Table 4, the sorption capacity of TOCN carbon aerogels ranged from 110 to 260 times its own weight depending on the density of the organic solvent. It is clear that the TOCN carbon aerogels show much higher sorption capacity than several previously reported absorbents, such as activated carbon (<1 times),7 polymers (5–25 times),36 exfoliated graphite (60–90 times),37 nanowire membrane (4–20 times),38 winter melon carbon aerogels (16–50 times),23 and reduced graphene oxide foam (5–40 times).39 Although the sorption capacity of TOCN carbon aerogels was still lower than that of nitrogen-doped graphene foam (200–600 times)40 and ultra-flyweight aerogels (215–743 times),41 the fabrication method of TOCN carbon aerogels was much simpler and its precursor material was cheaper and nontoxic, indicating that TOCN carbon aerogels could be a cost-effective and promising absorbent for removal of oil and various organic solvents.
| Absorbent materials | Absorbed substances | Absorption capacities (g g−1) | Recyclability of the absorbent | Cost | Ref. |
|---|---|---|---|---|---|
| Activated carbons | Benzene, toluene | <1 | Unable | Low | 7 |
| Polymers | Oils and organic solvents | 5–25 | Good | Medium | 36 |
| Exfoliated graphite | Heavy oil | 60–90 | Unable | Low | 37 |
| Nanowire nonwoven | Oils and some organic solvents | 4–20 | — | Low | 38 |
| Winter melon carbon aerogels | Organic solvents and oils | 16–50 | Good | Low | 23 |
| Reduced graphene oxide foam | Motor oil, cyclohexane, chlorobenzene, petroleum, toluene | 5–40 | Good | High | 39 |
| CNF aerogels | Oil and organic solvents | 106–312 | Good | Low | 11 |
| TCF aerogels | Oil and organic solvents | 5–192 | Able | Quite low | 25 |
| Carbon nanotube sponges | Chloroform, DMF, hexane, ethanol, diesel oil, gasoline, vegetable oil, pump oil, ethylene glycol | 80–180 | Able | High | 12 |
| Carbonaceous nanofiber aerogels | Gasoline, cyclohexane, ethanol, diesel oil, vegetable oil | 40–115 | Good | High | 42 |
| Nitrogen doped graphene foam | Oils and organic solvents | 200–600 | Able | High | 40 |
| Ultra-flyweight aerogels | Various solvents and oils | 215–913 | Good | High | 41 |
| TOCN carbon aerogels | Oil and organic solvents | 110–260 | Good | Low | Present work |
Oil absorption kinetics
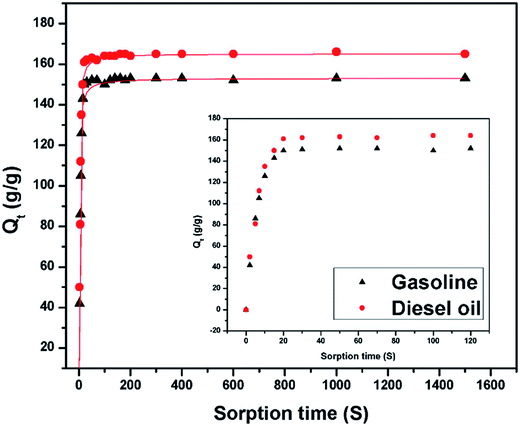
Fig. 7 shows the sorption capacity (Qt) of gasoline and diesel oil in TOCN carbon aerogels plotted as a function of absorption time. At the beginning of absorption, the weight of the TOCN carbon aerogels rapidly increased, indicating the capillary phenomenon. The oil quickly permeated into the pores of carbon aerogels by capillary action.31 The maximum absorbency of diesel oil was higher than that of gasoline because the density of diesel oil (0.843 g cm−3) was higher than that of gasoline (0.722 g cm−3). The time for the TOCN carbon aerogels to reach the saturated sorption capacity was about 20 s, indicating that the TOCN carbon aerogel was a candidate material for oil absorption with a fast absorption rate.Pseudo-first order and pseudo-second order models are commonly used for oil absorption studies.43,44 The sorption kinetics of the TOCN carbon aerogels were analyzed based on both these models. After integration, the pseudo-first order equation can be obtained:31
 | (3) |
Furthermore, the pseudo-second order equation can be converted into a linear form:45
 | (4) |
Fig. 8a and b shows the plots of ln[Qs/(Qs − Qt)] versus time t using the pseudo-first order model, while Fig. 8c and d displays the plots of (t/Qt) against t using the pseudo-second order model. In the inset of Fig. 8, the sorption rate constants k1 and k2 and the correlation coefficient R2 are shown. The results show that the absorption rate constants k1 and k2 for the gasoline are greater than those for diesel oil (Table 5), implying that the oil absorption of gasoline is faster than diesel oil due to its lower viscosity. Based on the pseudo-second order equation, the fitting results are plotted with a red line in Fig. 7, which shows excellent agreement with the experimental data.
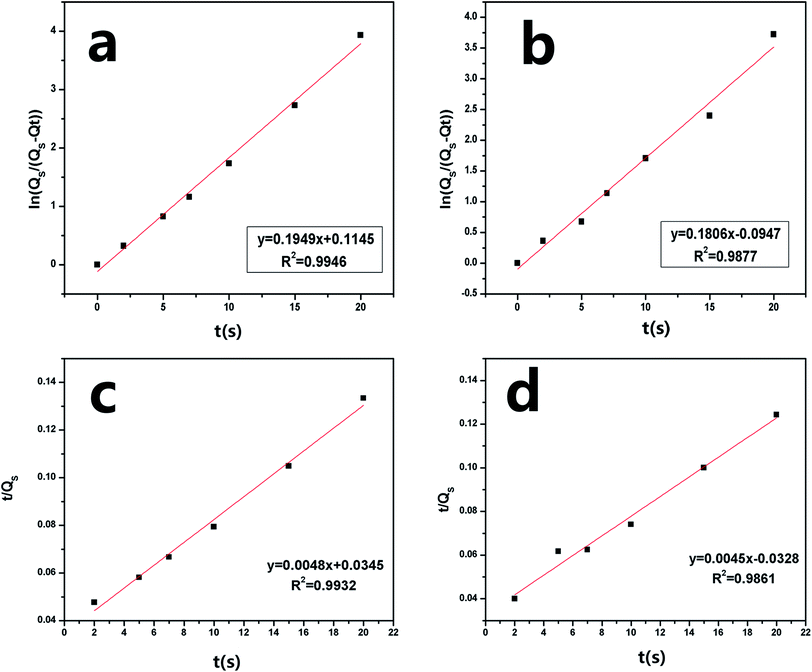 | ||
| Fig. 8 Pseudo-first order absorption linear fitting of (a) gasoline and (b) diesel oil and pseudo-second order absorption linear fitting of (c) gasoline (d) diesel oil of the TOCN carbon aerogel. | ||
| Oil | Density (g cm−3) | Viscosity (cST) | K1 | K2 | Qs (g g−1) |
|---|---|---|---|---|---|
| Gasoline | 0.722 | 0.76 | 0.1949 | 0.1806 | 153 ± 3 |
| Diesel oil | 0.843 | 4.7 | 0.0048 | 0.0045 | 165 ± 3 |
Absorption recyclability of TOCN carbon aerogels
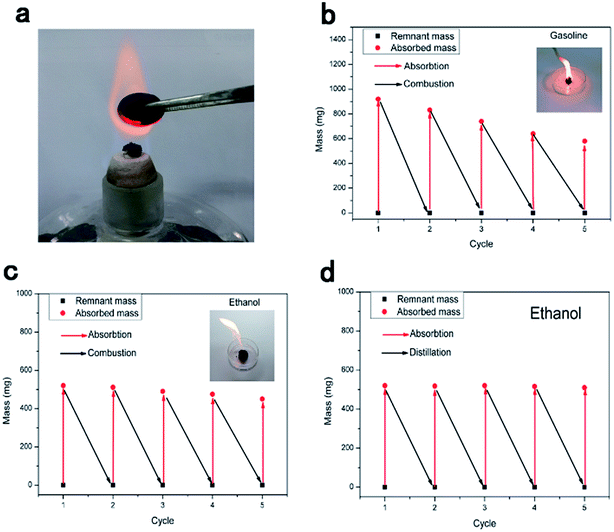
Since most pollutants are either useful or expensive raw materials, such as crude oil and toluene, the recyclability of absorbents and the recoverability of pollutants are key criteria for oil and chemical cleanup. TOCN carbon aerogels exhibit excellent fire-resistance when exposed to the flame of an alcohol burner, resulting in no burning of the aerogel (the temperature of the flame of the alcohol lamp is about 400–500 °C). This similar phenomenon was reported in previous literature,11,31,46 which may have been due to the high porosity of aerogels allowing for the quick removal of heat during combustion.47 Considering the fire-resistance and the high oil absorption capacity of the TOCN carbon aerogels, we used direct combustion to remove the gasoline and alcohol by an absorption/combustion method. In addition, cyclic absorption–combustion cycles were also performed. For gasoline and ethanol (Fig. 9b and c), 64% and 87% of the original TOCN carbon aerogel absorption capacity could be retained after 5 cycles, respectively. This result may be ascribed to the collapse of the porous structure and the shrinkage of the TOCN carbon aerogels after the combustion process (Fig. 9a) compared with the original carbon aerogels (Fig. 2e). Generally, the thin oil layer floating on the water surface cannot be combusted directly due to being difficult to gasify. However, TOCN carbon aerogels float on the water and can absorb the oil quickly and act as a porous carbon wick that efficiently facilitates the combustion. After the combustion finishes and the flame extinguishes, TOCN carbon aerogels still float on the water surface (Fig. 6c). Therefore, TOCN carbon aerogels may have potential applications in dealing with oil spill accidents.It should be noted that combustion is a simple but wasteful method; the collection and recycling of these organic solvents would be more economical and environmentally-friendly. As illustrated in Fig. 10c, a distillation procedure is employed to recover TOCN carbon aerogels and recycle the low boiling point pollutants, unlike the combustion process that would waste the precious or toxic organic solvents. After absorption, the TOCN carbon aerogels were heated to the boiling point (80 °C) to release the absorbed alcohol. Then, we collected the vapor of the alcohol for recycling. The result indicated that no significant decrease in absorption capacity of TOCN carbon aerogels was found after five absorption–distillation cycles, which may be ascribed to the relatively gentle treatment process. The pore size and structures were retained after the distillation process (Fig. 10b) compared with the original carbon aerogels (Fig. 2e). Thus, all these benefits suggest that the absorption–distillation is a more valuable approach to recover the solvent in comparison with the absorption–combustion cycle.
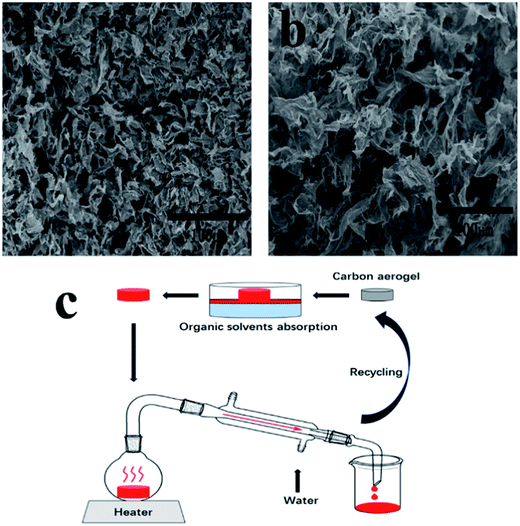 | ||
| Fig. 10 (a) and (b) SEM images of TOCN carbon aerogels after five absorption–combustion cycles and absorption–distillation cycles. (c) Schematic diagram of TOCN carbon aerogels recycling process. | ||
Conclusions
In summary, we have successfully prepared carbon-based aerogels from TEMPO-oxidized cellulose nanofibers (TOCN) by pyrolyzing TOCN aerogels at 1000 °C under nitrogen flow. The TOCN carbon aerogels show excellent porosity (99.5%) and hydrophobic properties with a contact angle of 139.6°. This super-absorbent was ultralight with a density of 8.8 mg cm−3 and exhibited excellent oil/water selectivity and high absorption capacity varying from 110 to 260 g g−1 depending on the density of the organic solvents. In addition, the excellent fire-resistance allowed the carbon aerogels to be reusable after direct combustion of the absorbed solvent. These unique properties of TOCN carbon aerogels, along with the advantages of using a natural, low-cost and sustainable material, enable TOCN carbon aerogels to have potential applications in environmental pollutant treatment in the future.Conflict of interest
The authors declare no competing financial interest.Acknowledgements
This work was financially supported by Fundamental Research Funds for the Central Universities (2017ZY35), Chinese Ministry of Education (113014A), National Natural Science Foundation of China (21404011, 21674013) and State Key Laboratory of Pulp and Paper Engineering (201750).References
- H. M. Choi and R. M. Cloud, Environ. Sci. Technol., 1992, 26, 772–776 CrossRef CAS.
- M. A. Shannon, P. W. Bohn, M. Elimelech, J. G. Georgiadis, B. J. Marinas and A. M. Mayes, Nature, 2008, 452, 301–310 CrossRef CAS PubMed.
- M. O. Adebajo, R. L. Frost, J. T. Kloprogge, O. Carmody and S. Kokot, J. Porous Mater., 2003, 10, 159–170 CrossRef CAS.
- D. Bastani, A. A. Safekordi, A. Alihosseini and V. Taghikhani, Sep. Purif. Technol., 2006, 52, 295–300 CrossRef CAS.
- T. Sakthivel, D. L. Reid, I. Goldstein, L. Hench and S. Seal, Environ. Sci. Technol., 2013, 47, 5843–5850 CrossRef CAS PubMed.
- M. Radetic, V. Ilic, D. Radojevic, R. Miladinovic, D. Jocic and P. Jovancic, Chemosphere, 2008, 70, 525–530 CrossRef CAS PubMed.
- M. Lillo-Ródenas, D. Cazorla-Amorós and A. Linares-Solano, Carbon, 2005, 43, 1758–1767 CrossRef.
- S. S. Banerjee, M. V. Joshi and R. V. Jayaram, Chemosphere, 2006, 64, 1026–1031 CrossRef CAS PubMed.
- A. C. Pierre and G. M. Pajonk, Chem. Rev., 2002, 102, 4243–4266 CrossRef CAS PubMed.
- A. M. Elkhatat and S. A. Al-Muhtaseb, Adv. Mater., 2011, 23, 2887–2903 CrossRef CAS PubMed.
- Z. Y. Wu, C. Li, H. W. Liang, J. F. Chen and S. H. Yu, Angew. Chem., 2013, 52, 2925–2929 CrossRef CAS PubMed.
- X. Gui, J. Wei, K. Wang, A. Cao, H. Zhu, Y. Jia, Q. Shu and D. Wu, Adv. Mater., 2010, 22, 617–621 CrossRef CAS PubMed.
- F. Yavari, Z. P. Chen, A. V. Thomas, W. C. Ren, H. M. Cheng and N. Koratkar, Sci. Rep., 2011, 1, 166 CrossRef PubMed.
- X.-C. Dong, H. Xu, X.-W. Wang, Y.-X. Huang, M. B. Chan-Park, H. Zhang, L.-H. Wang, W. Huang and P. Chen, ACS Nano, 2012, 6, 3206–3213 CrossRef CAS PubMed.
- Z.-S. Wu, S. Yang, Y. Sun, K. Parvez, X. Feng and K. Müllen, J. Am. Chem. Soc., 2012, 134, 9082–9085 CrossRef CAS PubMed.
- H. W. Liang, Q. F. Guan, L. F. Chen, Z. Zhu, W. J. Zhang and S. H. Yu, Angew. Chem., 2012, 51, 5101–5105 CrossRef CAS PubMed.
- R. Pekala, J. Mater. Sci., 1989, 24, 3221–3227 CrossRef CAS.
- X. Dong, J. Chen, Y. Ma, J. Wang, M. B. Chan-Park, X. Liu, L. Wang, W. Huang and P. Chen, Chem. Commun., 2012, 48, 10660–10662 RSC.
- R. J. Moon, A. Martini, J. Nairn, J. Simonsen and J. Youngblood, Chem. Soc. Rev., 2011, 40, 3941–3994 RSC.
- M. A. S. Azizi Samir, F. Alloin and A. Dufresne, Biomacromolecules, 2005, 6, 612–626 CrossRef PubMed.
- H. Koga, T. Kitaoka and A. Isogai, Molecules, 2015, 20, 1495–1508 CrossRef PubMed.
- D. Klemm, F. Kramer, S. Moritz, T. Lindstrom, M. Ankerfors, D. Gray and A. Dorris, Angew. Chem., 2011, 50, 5438–5466 CrossRef CAS PubMed.
- Y. Q. Li, Y. A. Samad, K. Polychronopoulou, S. M. Alhassan and K. Liao, ACS Sustainable Chem. Eng., 2014, 2, 1492–1497 CrossRef CAS.
- R. L. Liu, Y. Liu, X. Y. Zhou, Z. Q. Zhang, J. Zhang and F. Q. Dang, Bioresour. Technol., 2014, 154, 138–147 CrossRef CAS PubMed.
- H. Bi, Z. Yin, X. Cao, X. Xie, C. Tan, X. Huang, B. Chen, F. Chen, Q. Yang, X. Bu, X. Lu, L. Sun and H. Zhang, Adv. Mater., 2013, 25, 5916–5921 CrossRef CAS PubMed.
- Y. Okita, T. Saito and A. Isogai, Biomacromolecules, 2010, 11, 1696–1700 CrossRef CAS PubMed.
- W. Chen, Q. Li, Y. Wang, X. Yi, J. Zeng, H. Yu, Y. Liu and J. Li, ChemSusChem, 2014, 7, 154–161 CrossRef CAS PubMed.
- H. Yang, R. Yan, H. Chen, D. H. Lee and C. Zheng, Fuel, 2007, 86, 1781–1788 CrossRef CAS.
- Z. Chen, W. Ren, L. Gao, B. Liu, S. Pei and H.-M. Cheng, Nat. Mater., 2011, 10, 424–428 CrossRef CAS PubMed.
- Z. Ryu, J. Zheng, M. Wang and B. Zhang, Carbon, 1999, 37, 1257–1264 CrossRef CAS.
- Y. Meng, T. M. Young, P. Liu, C. I. Contescu, B. Huang and S. Wang, Cellulose, 2014, 22, 435–447 CrossRef.
- C. Zhang, R. Z. Zhang, Y. Q. Ma, W. B. Guan, X. L. Wu, X. Liu, H. Li, Y. L. Du and C. P. Pan, ACS Sustainable Chem. Eng., 2015, 3, 396–405 CrossRef CAS.
- S. Y. Oh, D. I. Yoo, Y. Shin, H. C. Kim, H. Y. Kim, Y. S. Chung, W. H. Park and J. H. Youk, Carbohydr. Res., 2005, 340, 2376–2391 CrossRef CAS PubMed.
- M. Noh, Y. Kwon, H. Lee, J. Cho, Y. Kim and M. G. Kim, Chem. Mater., 2005, 17, 1926–1929 CrossRef CAS.
- C. Şerbănescu, Chem. Pap., 2014, 68, 847–860 Search PubMed.
- A. Li, H. X. Sun, D. Z. Tan, W. J. Fan, S. H. Wen, X. J. Qing, G. X. Li, S. Y. Li and W. Q. Deng, Energy Environ. Sci., 2011, 4, 2062–2065 CAS.
- M. Toyoda and M. Inagaki, Carbon, 2000, 38, 199–210 CrossRef CAS.
- J. Yuan, X. Liu, O. Akbulut, J. Hu, S. L. Suib, J. Kong and F. Stellacci, Nat. Nanotechnol., 2008, 3, 332–336 CrossRef CAS PubMed.
- Z. Niu, J. Chen, H. H. Hng, J. Ma and X. Chen, Adv. Mater., 2012, 24, 4144–4150 CrossRef CAS PubMed.
- Y. Zhao, C. Hu, Y. Hu, H. Cheng, G. Shi and L. Qu, Angew. Chem., 2012, 124, 11533–11537 CrossRef.
- H. Sun, Z. Xu and C. Gao, Adv. Mater., 2013, 25, 2554–2560 CrossRef CAS PubMed.
- H. W. Liang, Q. F. Guan, L. F. Chen, Z. Zhu, W. J. Zhang and S. H. Yu, Angew. Chem., Int. Ed., 2012, 51, 5101–5105 CrossRef CAS PubMed.
- N. E. Thompson, G. Emmanue, K. J. Adagadzu and N. B. Yusuf, Arch. Appl. Sci. Res., 2010, 2, 142–151 Search PubMed.
- B. Wu and M. Zhou, Waste Manage., 2009, 29, 355–359 CrossRef CAS PubMed.
- Y. Chen and D. Zhang, Chem. Eng. J., 2014, 254, 579–585 CrossRef CAS.
- Z. Y. Wu, C. Li, H. W. Liang, Y. N. Zhang, X. Wang, J. F. Chen and S. H. Yu, Sci. Rep., 2014, 4, 4079 CrossRef PubMed.
- J. Li, J. Li, H. Meng, S. Xie, B. Zhang, L. Li, H. Ma, J. Zhang and M. Yu, J. Mater. Chem. A, 2014, 2, 2934 CAS.
Footnote |
† Electronic supplementary information (ESI) available: Video S1: the video shows that a TOCN carbon aerogel was immersed into the n-hexane water mixture (1![[thin space (1/6-em)]](https://www.rsc.org/images/entities/char_2009.gif) : :![[thin space (1/6-em)]](https://www.rsc.org/images/entities/char_2009.gif) 20 v/v, colored with Sudan III). Video S2: as shown in the video, the chloroform (stained with Sudan III) lying at the bottom of the water can be absorbed by the TOCN carbon aerogels. See DOI: 10.1039/c7ra05506d 20 v/v, colored with Sudan III). Video S2: as shown in the video, the chloroform (stained with Sudan III) lying at the bottom of the water can be absorbed by the TOCN carbon aerogels. See DOI: 10.1039/c7ra05506d |
| This journal is © The Royal Society of Chemistry 2017 |

