 Open Access Article
Creative Commons Attribution 3.0 Unported Licence
Effects of Co/Ce molar ratio and operating temperature on nanocatalyst performance in the Fischer–Tropsch synthesis†
Tahereh Taherzadeh Lari *a,
Ali Akbar Mirzaeia and
Hossein Atashib
aDepartment of Chemistry, Faculty of Science, University of Sistan and Baluchestan, P. O. Box 98135-674, Zahedan, Iran. E-mail: tzd.tahereh@yahoo.com; Taherzadeh@pgs.usb.ac.ir; Tel: +98 9173613223
bDepartment of Chemical Engineering, Faculty of Engineering, University of Sistan and Baluchestan, P. O. Box 98164-161, Zahedan, Iran
First published on 10th July 2017
Abstract
Iron–cobalt–cerium three-metal nanoparticles have been obtained by a solvothermal method for converting synthesis gas into light olefins. The effect of various fabrication molar ratios of Co/Ce and the effect of the operating temperature (270–400 °C) on the activity and selectivity were demonstrated. The nanocatalyst with a 1![[thin space (1/6-em)]](https://www.rsc.org/images/entities/char_2009.gif) :
:![[thin space (1/6-em)]](https://www.rsc.org/images/entities/char_2009.gif) 1/4 Co/Ce molar ratio at an operating temperature of 300 °C performed optimally in selectivity converting synthesis gas into light olefin. The nanocatalysts prepared with different Co/Ce molar ratios were characterized. The morphology, structure and magnetic behavior were established by SEM, EDX, FTIR, XRD and VSM *techniques.
1/4 Co/Ce molar ratio at an operating temperature of 300 °C performed optimally in selectivity converting synthesis gas into light olefin. The nanocatalysts prepared with different Co/Ce molar ratios were characterized. The morphology, structure and magnetic behavior were established by SEM, EDX, FTIR, XRD and VSM *techniques.
1. Introduction
Fischer–Tropsch FT synthesis is a significant gas-to-liquid process by using a metal catalyst for the conversion of synthesis gas (CO + H2) derived from coal, natural gas or biomass into hydrocarbons and oxygenated compounds. FT synthesis produces a wide range of olefins, paraffin and oxygenated products (such as alcohols, aldehydes, acids and ketones). The main concerns with the Fischer–Tropsch FT synthesis are in increasing environmental requests, technological developments and changes in fossil energy. This resources have been used exclusively for hydrocarbon selectivity towards light olefins including ethylene, propylene, butylene (C′′2–C′′4), which are the petrochemical feedstock.1,2 Among the variables that influence the spread of the products, the effects of the catalyst molar ratio and operating temperature are prominent factors affecting the hydrocarbon product selectivity.3 An increase in the temperature causes selective methane formation, and deposition of carbon, and thereby catalyst deactivation and a shorter average length of product. With increasing temperature, the selectivity changes to mainly methane at a higher cobalt molar ratio; whereas, reversely, for iron, methane selectivity remains low even at high temperature. On the other hand, comparatively, as the cobalt volume increases, the iron produces more methane and less olefin and the effect of pressure on the catalyst with higher amounts of cobalt becomes more prominent, while for the catalyst with a higher iron molar ratio, the pressure has little effect on the product selectivity. The effect of total pressure can be described by the CO partial pressure, which results in a lighter-hydrocarbon selectivity and H2 partial pressure that causes paraffin's product selectivity. For cobalt catalysts, as the pressure increases, the wax selectivity increases.4,5 Among the group (VIII) transition metals, only Fe, Ni, Co and Ru have the required Fischer–Tropsch reaction properties. Until today, both iron and cobalt are the only elements used as catalysts for industrial applications.6 Iron and cobalt are the catalysts of choice for industrial applications; iron is inexpensive and is tolerated, flexible and works under operational conditions that give a broad product range. Cobalt-based catalysts are much more expensive than iron-based ones. Co-Based catalysts with longer lifetimes have a higher hydrogenation activity. Therefore, they tend to produce a higher efficiency with the heavier paraffin's molecular weight and many fewer oxygenates, when compared to the iron catalyst.7 It is worth studying ceria addition as a promoter for Fe–Co catalysts because of its controversial role. This is related to the function of CeO2 on catalyst activity, which can result in either higher or lower C′′2–C′′4 selectivity.8 Moreover, the iron–cobalt–cerium catalyst has a beneficial application in the industry and it is distinguishable that a higher selectivity can be obtained on Fe–Co–Ce catalysts than other iron or cobalt based catalysts. There have been several published studies on Co–Ce and Fe–Co binary catalysts. Further studies demonstrate the following conclusions: the catalyst containing 80% of Co and 20% of Ce performed optimally for the conversion of synthesis gas into light olefins.9 The effect of the procedural conditions on the Fe–Co–Mn supported by MgO was studied.10 Despite the wide range of applications for iron–cobalt binary oxide nanoparticles, there is no study on iron–cobalt–cerium ternary oxides.In the present study, we probe the effects of various preparation molar ratios of Co/Ce, as well as the influences of different operational temperatures on iron–cobalt with cerium rare earth nanocatalysts in a fixed-bed reactor (FBR), so that synthesis gas conversion into light olefins could be evaluated. The comparison of catalytic activities and selectivities of each catalyst is discussed. The catalysts with the optimized molar ratios of cerium that have both high activities and valuable olefin selectivity are also presented. In addition, several techniques have been used including SEM, EDS, XRD, FTIR for morphology and structural properties and physicochemical properties such as TPR for reducibility and VSM for magnetic behavior of three metals prepared via solvothermal method.
2. Experimental
2.1. Materials
All the chemicals were of analytical grade and used without further purification. Iron nitrate(II) nonahydrate (Fe(NO3)3·9H2O, 99%), cobalt nitrate(II) hexahydrate (Co(NO3)2·6H2O, 99%), cerium nitrate(III) hexahydrate (Ce(NO3)3·6H2O, 99%), toluene (C7H8, 99%), and ethanol (C2H5OH, 99%) were purchased from Merck. Oleylamine (C18H37N, 70%) was purchased from Aldrich.2.2. Nanocatalyst synthesis and description
The iron–cobalt–cerium three-metal nanocatalysts were synthesized using a typical solvothermal method. The preparation method can be described as how different amounts of cerium and cobalt perform, as follows: 0.5, 0.25 and 0.125 g (1.1, 0.5 and 0.25 mmol) of cerium nitrate, 0.32, 0.16 and 0.08 g (1.1, 0.5 and 0.25 mmol) of cobalt nitrate, and 0.38 g (1.1 mmol) of iron nitrate were added into 50 mL of toluene containing 5.4 g (20.2 mmol) of oleylamine. The useful volume of the plastic container of the autoclave is 55 cm3; we used 80% of useful volume, which is 44 cm3. Therefore, the total volume of used liquid (mL of solvent + oleylamine = B + C) and solid (g of nitrate salts = A) is 44 cm3. If the grams of nitrate salts = A, (44 cm3 − A = F) then F is the volume of solvent + oleylamine; with knowing the volume of oleylamine, the volume of the required solvent is achieved. The mixture solution was subsequently transferred into an 80 mL Teflon-lined autoclave and heated to 180 °C. The autoclave was sealed and maintained at the given temperature for 18 h before it was allowed to cool down to room temperature. The nanoparticles formed were precipitated in the excess ethanol and further isolated from each other by centrifugation. The resulting nanoparticles were finally transferred to an oven to be dried before calcination at 100 and 500 °C in air for 4 h.2.3. Characterization
 | (1) |
![[thin space (1/6-em)]](https://www.rsc.org/images/entities/char_2009.gif) 000×.
000×.![[thin space (1/6-em)]](https://www.rsc.org/images/entities/char_2009.gif) 000 Oe.
000 Oe.2.4. Research catalytic microreactor setup
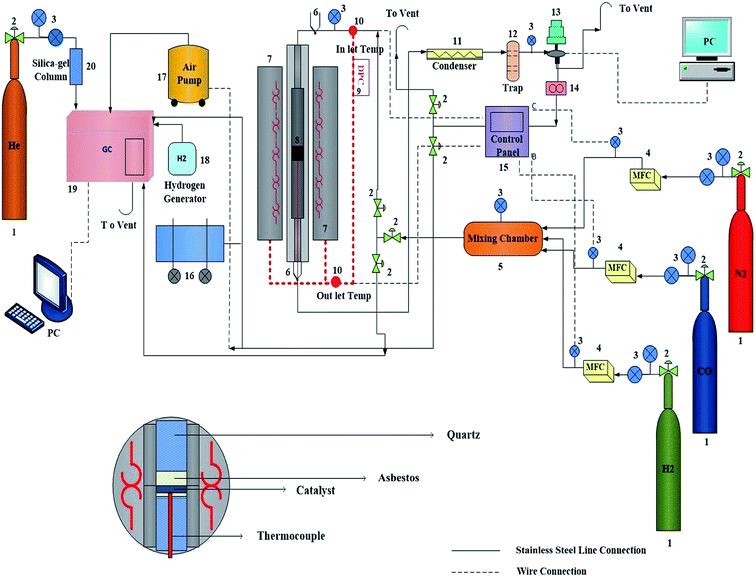
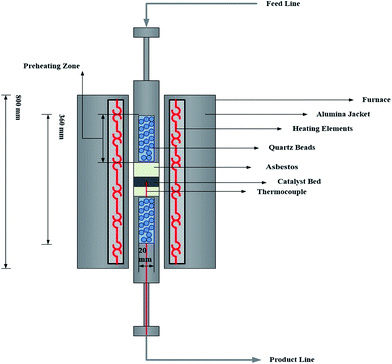
Fischer–Tropsch syntheses were performed in a stainless fixed-bed microreactor with an inner diameter of 12 mm. The catalyst (1.0 g) was well dispersed with asbestos and loaded in the center of the reactor with the thermocouple inside. Three mass flow controllers (Model 5850E, Brooks Instrument, Hatfield, PA, USA) were used to automatically adjust the flow rate of the inlet gases containing CO, H2, and N2 (with 99.99% purity). A mixture of CO and H2 (H2/CO = 1, flow rate of each gas = 30 mL min−1) was subsequently introduced into the entrance of the reactor, which was placed inside a tubular furnace (Fig. 1 and 2, Model ATU 150–15, Atbin). The reaction temperature was controlled by a digital program controller (DPC) and visually monitored by a computer through a thermocouple inserted into the catalytic bed. The catalyst in situ was pre-reduced under 2-bar pressure and H2 flow (with a flow rate of 30 mL min−1) at 400 °C for 48 h before the reaction started. In each test, 1.0 g of catalyst was loaded and all the data were collected after the time of 4 h to ensure a steady state operation was attained.2.5. Catalytic selectivity measurement
The Fischer–Tropsch synthesis was performed with a mixture of CO and H2 in the temperature range of 270–380 °C, with a H2/CO molar ratio of 1![[thin space (1/6-em)]](https://www.rsc.org/images/entities/char_2009.gif) :
:![[thin space (1/6-em)]](https://www.rsc.org/images/entities/char_2009.gif) 1, a space velocity of 3600 h−1 and at 2 bar of pressure. In each experiment, for the reactor catalyst testing at each molar ratio of metals fresh catalyst was loaded to avoid a deactivation effect. An automatic backpressure regulator to adjust and modify the pressure range via the TESCOM software was used. Reactant and product streams were analyzed by online gas chromatography (Thermo ONIX UNICAM PROGC+) equipped with two thermal conductivity detectors (TCD) and one flame ionization detector (FID) with the ability to analyze a broad variety of gaseous hydrocarbon mixtures. One TCD was used for the analysis of hydrogen (H2) and the other one was used for all the permanent gases like N2, O2 and CO. The analysis of hydrocarbons was done by the FID. The analysis of non-condensable gases, methane through C8 hydrocarbons, was applied. The contents of the sample loop were injected automatically into an alumina capillary column. Also, helium (He) was employed as a carrier gas for the optimal sensitivity. The calibration was performed by various calibration mixtures (CH4, C2H4, C2H6, C3H6, C3H8, n-C4H10, i-C4H10, n-C5H12) and pure compounds obtained from the Tarkib Gas Alvand Company of Iran. The operation condition and obtained data of each experiment are presented in the ESI tables.† The CO conversion percent was calculated according to the normalization method:
1, a space velocity of 3600 h−1 and at 2 bar of pressure. In each experiment, for the reactor catalyst testing at each molar ratio of metals fresh catalyst was loaded to avoid a deactivation effect. An automatic backpressure regulator to adjust and modify the pressure range via the TESCOM software was used. Reactant and product streams were analyzed by online gas chromatography (Thermo ONIX UNICAM PROGC+) equipped with two thermal conductivity detectors (TCD) and one flame ionization detector (FID) with the ability to analyze a broad variety of gaseous hydrocarbon mixtures. One TCD was used for the analysis of hydrogen (H2) and the other one was used for all the permanent gases like N2, O2 and CO. The analysis of hydrocarbons was done by the FID. The analysis of non-condensable gases, methane through C8 hydrocarbons, was applied. The contents of the sample loop were injected automatically into an alumina capillary column. Also, helium (He) was employed as a carrier gas for the optimal sensitivity. The calibration was performed by various calibration mixtures (CH4, C2H4, C2H6, C3H6, C3H8, n-C4H10, i-C4H10, n-C5H12) and pure compounds obtained from the Tarkib Gas Alvand Company of Iran. The operation condition and obtained data of each experiment are presented in the ESI tables.† The CO conversion percent was calculated according to the normalization method:
 | (2) |
3. Results and discussion
3.1. Characterization of nanocatalysts
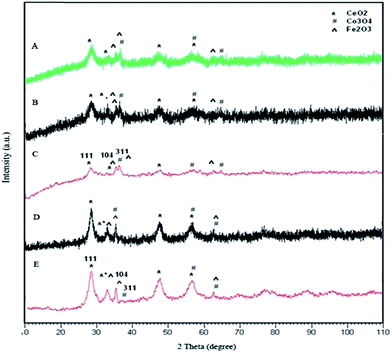 | ||
Fig. 3 X-ray diffraction patterns of iron–cobalt–cerium three-metal nanocatalyst prepared at various Ce and Co molar ratios: Co/Ce: (A) 1![[thin space (1/6-em)]](https://www.rsc.org/images/entities/char_2009.gif) : :![[thin space (1/6-em)]](https://www.rsc.org/images/entities/char_2009.gif) 1, (B) 1 1, (B) 1![[thin space (1/6-em)]](https://www.rsc.org/images/entities/char_2009.gif) : :![[thin space (1/6-em)]](https://www.rsc.org/images/entities/char_2009.gif) 1/2, (C) 1 1/2, (C) 1![[thin space (1/6-em)]](https://www.rsc.org/images/entities/char_2009.gif) : :![[thin space (1/6-em)]](https://www.rsc.org/images/entities/char_2009.gif) 1/4, (D) 1/2 1/4, (D) 1/2![[thin space (1/6-em)]](https://www.rsc.org/images/entities/char_2009.gif) : :![[thin space (1/6-em)]](https://www.rsc.org/images/entities/char_2009.gif) 1, (E) 1/4 1, (E) 1/4![[thin space (1/6-em)]](https://www.rsc.org/images/entities/char_2009.gif) : :![[thin space (1/6-em)]](https://www.rsc.org/images/entities/char_2009.gif) 1. 1. | ||
The XRD pattern of the used catalyst with a 1![[thin space (1/6-em)]](https://www.rsc.org/images/entities/char_2009.gif) :
:![[thin space (1/6-em)]](https://www.rsc.org/images/entities/char_2009.gif) 1
1![[thin space (1/6-em)]](https://www.rsc.org/images/entities/char_2009.gif) :
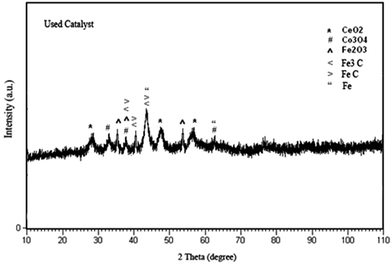
:![[thin space (1/6-em)]](https://www.rsc.org/images/entities/char_2009.gif) 1/4 of molar ratio is shown in Fig. 4. From the XRD pattern, in addition to CeO2, Co3O4, and Fe2O3, Fe3C (card no. 23-1113), FeC (card no. 06-0686) and Fe (card no. 01-1267) were found.
1/4 of molar ratio is shown in Fig. 4. From the XRD pattern, in addition to CeO2, Co3O4, and Fe2O3, Fe3C (card no. 23-1113), FeC (card no. 06-0686) and Fe (card no. 01-1267) were found.
![[double bond, length as m-dash]](https://www.rsc.org/images/entities/char_e001.gif) C group of oleylamine, which surrounds the nanocatalysts. The absorption bands at 1384 cm−1 and 1114 cm−1 are assigned by the bending stretching of the –CH3 group and C–H bond of oleylamine, respectively. In addition, the bands in the range of 560–660 cm−1 represented M–O metal ion stretching vibration.11
C group of oleylamine, which surrounds the nanocatalysts. The absorption bands at 1384 cm−1 and 1114 cm−1 are assigned by the bending stretching of the –CH3 group and C–H bond of oleylamine, respectively. In addition, the bands in the range of 560–660 cm−1 represented M–O metal ion stretching vibration.11
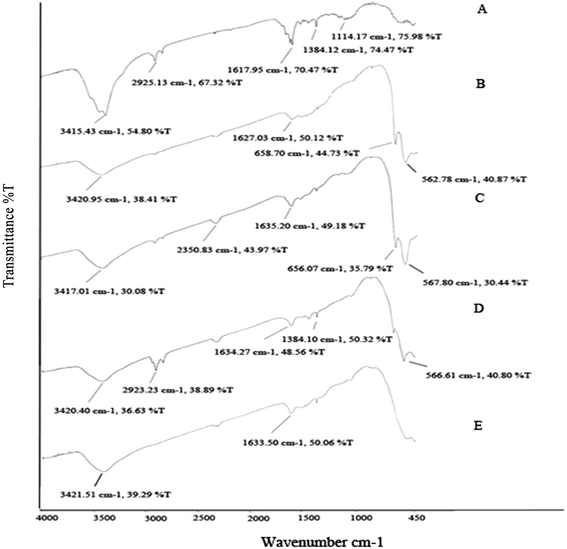 | ||
Fig. 5 FTIR spectra of iron–cobalt–cerium three-metal nanocatalysts synthesized at various Ce and Co molar ratios Co/Ce: (A) 1![[thin space (1/6-em)]](https://www.rsc.org/images/entities/char_2009.gif) : :![[thin space (1/6-em)]](https://www.rsc.org/images/entities/char_2009.gif) 1, (B) 1 1, (B) 1![[thin space (1/6-em)]](https://www.rsc.org/images/entities/char_2009.gif) : :![[thin space (1/6-em)]](https://www.rsc.org/images/entities/char_2009.gif) 1/2, (C) 1 1/2, (C) 1![[thin space (1/6-em)]](https://www.rsc.org/images/entities/char_2009.gif) : :![[thin space (1/6-em)]](https://www.rsc.org/images/entities/char_2009.gif) 1/4, (D) 1/2 1/4, (D) 1/2![[thin space (1/6-em)]](https://www.rsc.org/images/entities/char_2009.gif) : :![[thin space (1/6-em)]](https://www.rsc.org/images/entities/char_2009.gif) 1, (E) 1/4 1, (E) 1/4![[thin space (1/6-em)]](https://www.rsc.org/images/entities/char_2009.gif) : :![[thin space (1/6-em)]](https://www.rsc.org/images/entities/char_2009.gif) 1. 1. | ||
It was reported that a small change in the environment of a chemical group would lead to a change in the position of its characteristic vibrational frequencies.12 The results indicate a relation between particle size and vibrational frequency, which by increasing the Ce molar ratio from 1/4 to 1 (decreasing the particle size) means the wave number shifts towards lower values. Whereas, by decreasing the Co molar ratio from 1 to 1/4, and thereby increasing the particle size, the wave number shifts to higher values.
![[thin space (1/6-em)]](https://www.rsc.org/images/entities/char_2009.gif) :
:![[thin space (1/6-em)]](https://www.rsc.org/images/entities/char_2009.gif) 1
1![[thin space (1/6-em)]](https://www.rsc.org/images/entities/char_2009.gif) :
:![[thin space (1/6-em)]](https://www.rsc.org/images/entities/char_2009.gif) 1 molar ratio of metals indicates four reduction peaks. The first peak, observed at 313 °C, is due to the reduction of Fe2O3 → Fe3O4 and Co3O4 → CoO. The next peak at 381 °C is attributed to the reduction of CoO → Co0 and CeO2 → Ce2O3. The third peak located at 516 °C is associated with the reduction of Fe3O4 → FeO → Fe0. The last peak at 758 °C represents a Ce2O3 → Ce0 reduction. It can be seen that the reduction peaks of nanocatalysts with different amounts of cerium (Fig. 6B and C) occur at four points. The TPR profiles of iron–cobalt–cerium three-metal nanocatalysts synthesized at various cerium molar ratios of 1/2 and 1/4 are at 324, 389–427, 536, 770 and 337, 481, 552, 786 °C respectively. The first peak at 324 for the 1/2 molar ratio of cerium corresponds to the reduction of Co3O4 → CoO and also the peak at 337 °C for the 1/4 cerium molar ratio is associated to Fe2O3 → Fe3O4 and Co3O4 → CoO (Fig. 6B and C). The second peak, which is divided into two peaks for the 1/2 molar ratio of cerium, represents the reduction of Fe2O3 → Fe3O4 at 389 °C and the reductions of CoO → Co0 and CeO2 → Ce2O3 at 427 °C. Also, the sharp peak at 481 °C for the 1/4 molar ratio of cerium is related to CoO → Co0 and Ce2O3 → Ce0. The third peak centered at 536 and 552 °C for both the 1/2 and 1/4 cerium molar ratios is due to the reduction of Fe3O4 → FeO → Fe0. The last small reduction peak at 770 and 786 °C corresponds to Ce2O3 → Ce0.
1 molar ratio of metals indicates four reduction peaks. The first peak, observed at 313 °C, is due to the reduction of Fe2O3 → Fe3O4 and Co3O4 → CoO. The next peak at 381 °C is attributed to the reduction of CoO → Co0 and CeO2 → Ce2O3. The third peak located at 516 °C is associated with the reduction of Fe3O4 → FeO → Fe0. The last peak at 758 °C represents a Ce2O3 → Ce0 reduction. It can be seen that the reduction peaks of nanocatalysts with different amounts of cerium (Fig. 6B and C) occur at four points. The TPR profiles of iron–cobalt–cerium three-metal nanocatalysts synthesized at various cerium molar ratios of 1/2 and 1/4 are at 324, 389–427, 536, 770 and 337, 481, 552, 786 °C respectively. The first peak at 324 for the 1/2 molar ratio of cerium corresponds to the reduction of Co3O4 → CoO and also the peak at 337 °C for the 1/4 cerium molar ratio is associated to Fe2O3 → Fe3O4 and Co3O4 → CoO (Fig. 6B and C). The second peak, which is divided into two peaks for the 1/2 molar ratio of cerium, represents the reduction of Fe2O3 → Fe3O4 at 389 °C and the reductions of CoO → Co0 and CeO2 → Ce2O3 at 427 °C. Also, the sharp peak at 481 °C for the 1/4 molar ratio of cerium is related to CoO → Co0 and Ce2O3 → Ce0. The third peak centered at 536 and 552 °C for both the 1/2 and 1/4 cerium molar ratios is due to the reduction of Fe3O4 → FeO → Fe0. The last small reduction peak at 770 and 786 °C corresponds to Ce2O3 → Ce0.
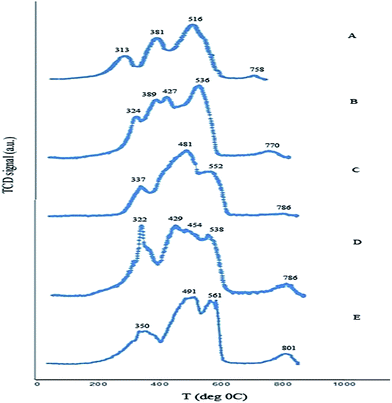 | ||
Fig. 6 TPR profiles of iron–cobalt–cerium three-metal nanocatalysts synthesized at various Ce and Co molar ratios Co/Ce: (A) 1![[thin space (1/6-em)]](https://www.rsc.org/images/entities/char_2009.gif) : :![[thin space (1/6-em)]](https://www.rsc.org/images/entities/char_2009.gif) 1, (B) 1 1, (B) 1![[thin space (1/6-em)]](https://www.rsc.org/images/entities/char_2009.gif) : :![[thin space (1/6-em)]](https://www.rsc.org/images/entities/char_2009.gif) 1/2, (C) 1 1/2, (C) 1![[thin space (1/6-em)]](https://www.rsc.org/images/entities/char_2009.gif) : :![[thin space (1/6-em)]](https://www.rsc.org/images/entities/char_2009.gif) 1/4, (D) 1/2 1/4, (D) 1/2![[thin space (1/6-em)]](https://www.rsc.org/images/entities/char_2009.gif) : :![[thin space (1/6-em)]](https://www.rsc.org/images/entities/char_2009.gif) 1, and (E) 1/4 1, and (E) 1/4![[thin space (1/6-em)]](https://www.rsc.org/images/entities/char_2009.gif) : :![[thin space (1/6-em)]](https://www.rsc.org/images/entities/char_2009.gif) 1. 1. | ||
The TPR profiles of the nanocatalysts synthesized at various cobalt molar ratios of 1/2 and 1/4 show (Fig. 6D and E) three and four reduction peaks, respectively, positioned at 322, 429–454–538, 786 and 350, 491, 561, 801 °C. The first reduction peak centered at 322 and 350 °C is related to the reduction of both Fe3+ → Fe2+ and Co3O4 → CoO. The second peak for the nanocatalyst with a 1/2 molar ratio of cobalt is divided into three small shoulders at 429, 454 and 538 °C, which are attributed to the reductions of CoO → Co0, Ce4+ → Ce3+ and Fe3O4 → FeO → Fe0, respectively. Furthermore, the reduction peak of the nanocatalyst synthesized with a 1/4 molar ratio of cobalt centered at 491 °C is attributed to the reduction of both CoO → Co0 and CeO2 → Ce2O3. The third reduction peak of this sample located at 561 °C relates to the reduction of Fe3O4 to Fe0. The last peak for the nanocatalysts with 1/2 and 1/4 molar ratios of cobalt centered at 786 and 801 °C corresponds to the reduction of Ce2O3 → Ce0.
The reduction of ceria in the presence of transition metals is easier because of a higher degree of reduction and lower temperature of reducibility. It is generally interpreted in terms of a spillover process of hydrogen from metals to ceria. In addition, a higher content of ceria leads to a higher degree of reduction by shifting towards a lower temperature. The result indicates that particle size is a factor affecting reducibility and causes different reduction temperatures. Therefore, by changing the cobalt and cerium molar ratio from 1 to 1/2 and 1/4, the increase in particle size leads to the reduction peaks shifting towards higher temperatures.
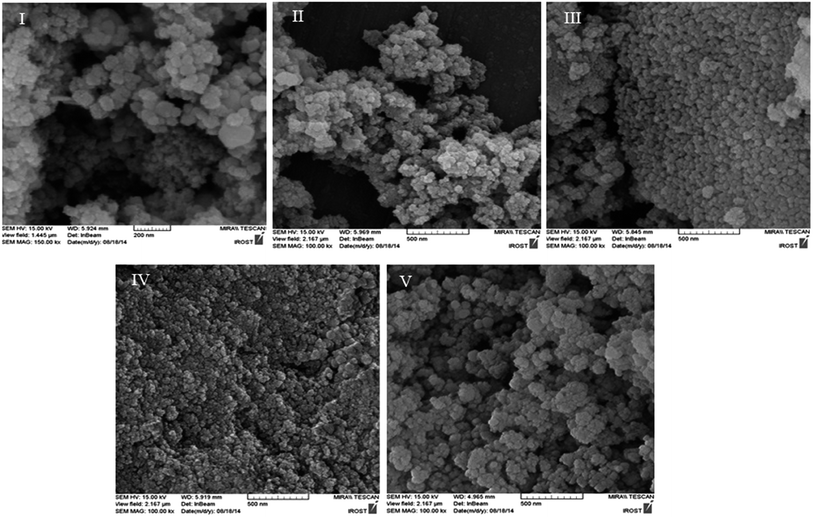 | ||
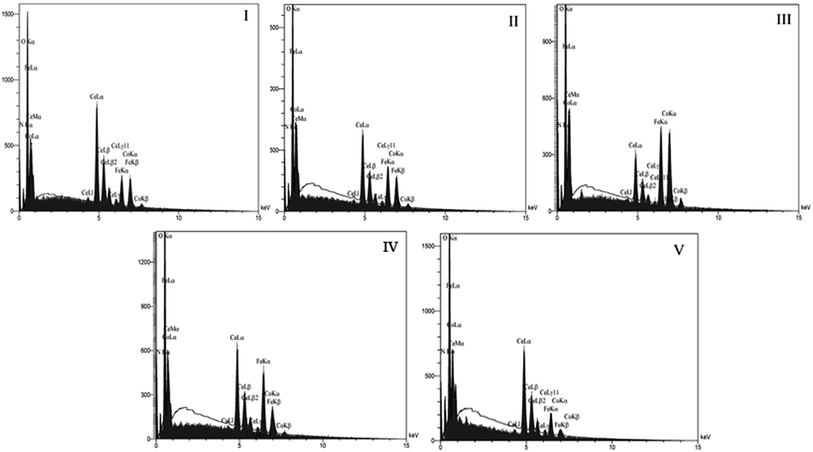
| Fig. 7 SEM micrographs of iron–cobalt–cerium three metals nanocatalyst synthesized at various Co and Ce molar ratios Co/Ce: (I) 1 : 1, (II) 1 : 1/2, (III) 1 : 1/4, (IV) 1/2 : 1, (V) 1/4 : 1. | ||
Also, the EDS spectra of iron–cobalt–cerium three-metal nanocatalysts synthesized at various cobalt and cerium molar ratios are illustrated in Fig. 8. This indicates the presence of Fe, Co, Ce, and O (Table S2† and Fig. 8), which verifies that these materials comprise oxidic phases of iron, cobalt and cerium.
![[thin space (1/6-em)]](https://www.rsc.org/images/entities/char_2009.gif) :
:![[thin space (1/6-em)]](https://www.rsc.org/images/entities/char_2009.gif) 1 and 1/4
1 and 1/4![[thin space (1/6-em)]](https://www.rsc.org/images/entities/char_2009.gif) :
:![[thin space (1/6-em)]](https://www.rsc.org/images/entities/char_2009.gif) 1 molar ratios of Co/Ce have a soft ferromagnetic behavior and those prepared with 1
1 molar ratios of Co/Ce have a soft ferromagnetic behavior and those prepared with 1![[thin space (1/6-em)]](https://www.rsc.org/images/entities/char_2009.gif) :
:![[thin space (1/6-em)]](https://www.rsc.org/images/entities/char_2009.gif) 1/2, 1
1/2, 1![[thin space (1/6-em)]](https://www.rsc.org/images/entities/char_2009.gif) :
:![[thin space (1/6-em)]](https://www.rsc.org/images/entities/char_2009.gif) 1/4 and 1/2
1/4 and 1/2![[thin space (1/6-em)]](https://www.rsc.org/images/entities/char_2009.gif) :
:![[thin space (1/6-em)]](https://www.rsc.org/images/entities/char_2009.gif) 1 molar ratios of Co/Ce are hard ferromagnetics. As a result, changing the molar ratio of CeO2 in the sample at the synthesis process leads to changes in the coercive field. A smaller coercivity force is indicative of smaller sizes of nanocatalyst particles.18
1 molar ratios of Co/Ce are hard ferromagnetics. As a result, changing the molar ratio of CeO2 in the sample at the synthesis process leads to changes in the coercive field. A smaller coercivity force is indicative of smaller sizes of nanocatalyst particles.18
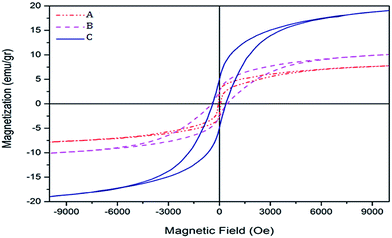 | ||
| Fig. 9 Hysteresis loops of iron–cobalt–cerium three-metal nanocatalysts synthesized at various Ce molar ratios: (A) Ce = 1, (B) Ce = 1/2, (C) Ce = 1/4. | ||
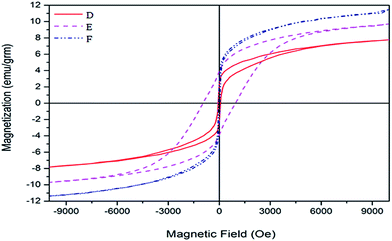 | ||
| Fig. 10 Hysteresis loops of iron–cobalt–cerium three-metal nanocatalysts synthesized at various Co molar ratios: (D) Co = 1, (E) Co = 1/2, (F) Co = 1/4. | ||
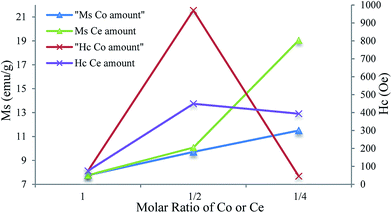 | ||
| Fig. 11 Variation of saturation magnetization and coercivity of iron–cobalt–cerium three-metal nanocatalysts as a function of different molar ratios of Co and Ce. | ||
Also, in this work the residual magnetization ratio (R = Mr/Ms) with decreasing cobalt and cerium molar ratios increases from 0.315 until 0.263–0.246. The value of R > 0.5 indicates that materials are single domain and R < 0.5 relates to multidomain structures.
3.2. Fischer–Tropsch synthesis performance
Iron–cobalt–cerium three-metals nanocatalysts were synthesized using a solvothermal method and the catalytic performance on Fischer–Tropsch synthesis under the operating conditions of (H2/CO = 1, GHSV = 3600 h−1, P = 2 bar) was illustrated. The effect of various Co/Ce molar ratios (1![[thin space (1/6-em)]](https://www.rsc.org/images/entities/char_2009.gif) :
:![[thin space (1/6-em)]](https://www.rsc.org/images/entities/char_2009.gif) 1, 1/2
1, 1/2![[thin space (1/6-em)]](https://www.rsc.org/images/entities/char_2009.gif) :
:![[thin space (1/6-em)]](https://www.rsc.org/images/entities/char_2009.gif) 1, 1/4
1, 1/4![[thin space (1/6-em)]](https://www.rsc.org/images/entities/char_2009.gif) :
:![[thin space (1/6-em)]](https://www.rsc.org/images/entities/char_2009.gif) 1, 1
1, 1![[thin space (1/6-em)]](https://www.rsc.org/images/entities/char_2009.gif) :
:![[thin space (1/6-em)]](https://www.rsc.org/images/entities/char_2009.gif) 1/2, 1
1/2, 1![[thin space (1/6-em)]](https://www.rsc.org/images/entities/char_2009.gif) :
:![[thin space (1/6-em)]](https://www.rsc.org/images/entities/char_2009.gif) 1/4) at various ranges of operating temperature (270–400 °C) on the Fischer–Tropsch synthesis was investigated (Tables S4–S8†).
1/4) at various ranges of operating temperature (270–400 °C) on the Fischer–Tropsch synthesis was investigated (Tables S4–S8†).
The cobalt catalyst is a priority catalyst for a higher selectivity for the production of long chain paraffins, and has the features of high activity, low WGS activity and a high resistance to deactivation by water.
Since the Fischer–Tropsch synthesis is complicated and hard work, various factors affect product selectivity. In this study, we made a great deal of effort to prepare a large number of Fe–Co–Ce three-metal nanocatalysts with various molar ratios and investigate them for the FT reaction. Therefore, we just report a variety of repeatability molar ratios (Fig. 12). In order to explain the obtained results of changing the Co/Ce molar ratios in the FT synthesis performance, it should be noted that the product selectivity of FT reaction varies with multiple effects concerning each metal singly (iron, cobalt, cerium) as well as the interaction effects of metals on each other. According to the reported different molar ratios of these metals, the optimal condition can be obtained partly for a specific production. Here, the optimal conditions for the specific production of light olefins C′′2–C′′4 at a particular temperature and Co/Ce molar ratio were obtained as 300 °C and 1/1/4, respectively. In summary, at this optimal molar ratio and specific operating temperature, cerium as a promoter performed a positive effect to produce more light olefins by a quick dissociation of CO and higher C*/H* active species on the surface of the catalyst. Also, the results show that the maximum total selectivity towards light olefins obtained for 1/2 : 1 molar ratio of Co/Ce.
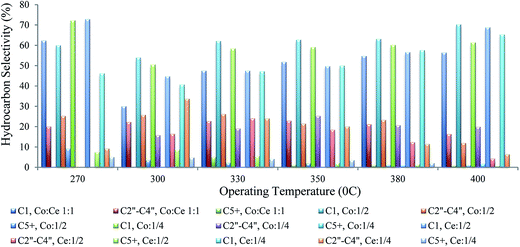 | ||
| Fig. 12 Hydrocarbon selectivity of iron–cobalt–cerium three-metal nanocatalysts with various Co/Ce molar ratios at different operating temperature ranges. | ||
To compare with other research on catalyst selectivity, Feyzi et al.21 reported a nano Co/Fe catalyst with 80/20 molar ratios supported on TiO2–SiO2 prepared by a sol–gel method in a fixed-bed reactor. The result indicated an optimal light olefin selectivity of 24.5% for C2–C3 at a CO conversion of 49.4%. Also, Mirzaei et al.9 studied the effect of operating conditions on cobalt cerium oxide catalysts. The results showed that the catalyst with 80% Co, 20% Ce at an operating temperature of 450 °C performed optimally for light olefin selectivity.
In general as expected, the CO conversion has an increasing trend with enhancing the operating temperature. In the present study, the CO conversion changes from the highest amount to the lowest amount at the beginning of increasing the operating temperature. After this sharp decline in CO conversion, with a further rise in the operating temperature the CO conversion increases (Fig. 13). When the steady state was achieved before an increase in temperature, just in the transition from 270 to 300 °C, therefore, an important deactivation process occurred. These results are due to the fact that the nanocatalyst being used doesn't have a base and, despite a high catalyst activity, the time of deactivation is short. Therefore, by identifying the nanocatalyst feature, the results obtained are explained. The deactivation process is due to two reasons; first, the initial carbon deposition, verified based on XRD peaks of Fe3C and FeC, is relevant to the catalyst used and also, second, the fast resizing of the nanoparticles at the beginning of reaction, which is interpreted in terms of being placed under operating conditions that result in partly changing the particle size of the fresh nanocatalyst at the initial deactivation stage. These results were verified by XRD with the particle size related to the used catalyst of 62.6 nm. Since the reaction rate is a function of temperature, the partial pressure of gases (monoxide and hydrogen) and catalyst activity, as the initial operating temperature increased to the point of a sharp reduction in CO conversion, the speed of the catalyst deactivation is more effective than the thermal effect. So, from that point of sharp decline, the effect of a temperature rise on the reaction rate surpasses the catalyst deactivation effect. Therefore, the degree of conversion increases with increasing temperature.
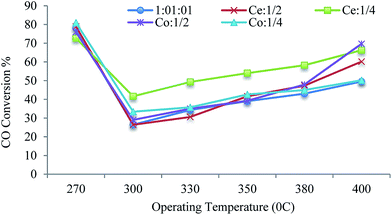 | ||
| Fig. 13 Operating temperature versus CO conversion of iron–cobalt–cerium three-metal nanocatalysts with different Co/Ce molar ratios. | ||
The reaction rate of CO conversion is defined as a function of the following parameters:
| −RCO = Kf(T,PCO,PH2,…,a) | (3) |
As a conclusion, the selectivity of the nanocatalysts (at constant pressure at different operating temperatures) is influenced by two factors, the catalyst deactivation and thermal effect.
E.g. for a nanocatalyst with a 1![[thin space (1/6-em)]](https://www.rsc.org/images/entities/char_2009.gif) :
:![[thin space (1/6-em)]](https://www.rsc.org/images/entities/char_2009.gif) 1
1![[thin space (1/6-em)]](https://www.rsc.org/images/entities/char_2009.gif) :
:![[thin space (1/6-em)]](https://www.rsc.org/images/entities/char_2009.gif) 1/4 molar ratio of Fe
1/4 molar ratio of Fe![[thin space (1/6-em)]](https://www.rsc.org/images/entities/char_2009.gif) :
:![[thin space (1/6-em)]](https://www.rsc.org/images/entities/char_2009.gif) Co
Co![[thin space (1/6-em)]](https://www.rsc.org/images/entities/char_2009.gif) :
:![[thin space (1/6-em)]](https://www.rsc.org/images/entities/char_2009.gif) Ce, the CO conversion from a high value at 270 °C declines drastically at 300 °C due to a more significant catalyst deactivation effect. After that, with increasing the operating temperature from 330 °C to 400 °C, the CO conversion enhances as a result of more prominent thermal effects.
Ce, the CO conversion from a high value at 270 °C declines drastically at 300 °C due to a more significant catalyst deactivation effect. After that, with increasing the operating temperature from 330 °C to 400 °C, the CO conversion enhances as a result of more prominent thermal effects.
4. Conclusion
A variety of preparation and operating conditions that influence catalytic performance and selectivity were studied. Iron–cobalt–cerium three-metal nanocatalysts of various cobalt and cerium molar ratios were synthesized by a solvothermal method. The results showed that the optimal Co/Ce molar ratio and operating temperature for light olefin (C′′2–C′′4) selectivity was achieved at 1![[thin space (1/6-em)]](https://www.rsc.org/images/entities/char_2009.gif) :
:![[thin space (1/6-em)]](https://www.rsc.org/images/entities/char_2009.gif) 1/4 and 300 °C. The characterization of nanocatalysts was performed by SEM, EDX, XRD, FTIR, TPR and VSM techniques. From the FTIR spectra it was concluded that oleylamine surrounded the surface of the nanocatalyst. The XRD spectra and EDS data confirmed the formation of oxidic phases of the nanocatalysts. The results indicate that with decreasing cobalt and cerium molar ratios, the particle size enhances. Comparing SEM and XRD data demonstrated the larger particle size because of agglomeration. From the TPR, it was observed that the reduction peaks of nanocatalysts with decreasing cobalt and cerium molar ratios reduced at higher temperatures. The magnetic properties are also influenced by the cobalt and cerium molar ratios and the synthesized samples indicate a ferromagnetic behavior. The VSM measurement of nanocatalysts exhibits that the saturation magnetization, coercivity and residual magnetization are dependent on particle size and increase by reducing the amount of cobalt and cerium.
1/4 and 300 °C. The characterization of nanocatalysts was performed by SEM, EDX, XRD, FTIR, TPR and VSM techniques. From the FTIR spectra it was concluded that oleylamine surrounded the surface of the nanocatalyst. The XRD spectra and EDS data confirmed the formation of oxidic phases of the nanocatalysts. The results indicate that with decreasing cobalt and cerium molar ratios, the particle size enhances. Comparing SEM and XRD data demonstrated the larger particle size because of agglomeration. From the TPR, it was observed that the reduction peaks of nanocatalysts with decreasing cobalt and cerium molar ratios reduced at higher temperatures. The magnetic properties are also influenced by the cobalt and cerium molar ratios and the synthesized samples indicate a ferromagnetic behavior. The VSM measurement of nanocatalysts exhibits that the saturation magnetization, coercivity and residual magnetization are dependent on particle size and increase by reducing the amount of cobalt and cerium.
Acknowledgements
The authors would like to thank and appreciate the Ministry of Science & Research, Research Department of Sistan & Baluchestan University, as well as the Iranian National Petrochemical Company (INPC) for financial supports.References
- S. Sartipi, K. Parashar, M. Makkee, J. Gascon and F. Kapteijn, Breaking the Fischer–Tropsch synthesis selectivity: direct conversion of syngas to gasoline over hierarchical Co/H-ZSM-5 catalysts, Catal. Sci. Technol., 2013, 572 CAS.
- O. O. James, B. Chowdhury, M. Adediran Mesubi and S. Maity, Reflections on the chemistry of the Fischer–Tropsch synthesis, RSC Adv., 2012, 7347 RSC.
- J. Wang, H. Li, D. Li, J. P. den Breejen and B. Hou, Influence of the bimodal pore structure on the CO hydrogenation activity and selectivity of cobalt catalysts, RSC Adv., 2015, 65358 RSC.
- M. E. Dry, The Fischer–Tropsch process, Catal Today, 2002, 227 CrossRef CAS.
- M. E. Dry, Practical and theoretical aspects of the catalytic Fischer–Tropsch process, Appl. Catal., A, 1996, 319 CrossRef CAS.
- Y. Liu, J.-F. Chen and Y. Zhang, The effect of pore size or iron particle size on the formation of light olefins in Fischer–Tropsch synthesis, RSC Adv., 2015, 29002 RSC.
- D. B. Bukur, B. Todic and N. Elbashir, Role of water–gas-shift reaction in Fischer–Tropsch synthesis on iron catalysts, Catal. Today, 2015, 66 Search PubMed.
- J. Gao, Q. Liu, F. Gu, B. Liu, Z. Zhong and F. Su, Recent advances in methanation catalysts for the production of synthetic natural gas, RSC Adv., 2015, 22759 RSC.
- A. A. Mirzaei, M. Galavy, A. Beigbabaei and V. Eslamimanesh, Preparation and operation conditions for cobalt cerium oxide catalysts used in the conversion of synthesis gas into light olefins, J. Iran. Chem. Soc., 2007, 347 CrossRef CAS.
- M. Arsalanfar, A. A. Mirzaei, H. R. Bozorgzadeh and H. Atashi, Effect of process conditions on the surface reaction rates and catalytic performance of MgO supported Fe–Co–Mn catalyst for CO Hydrogenation, J. Ind. Eng. Chem., 2012, 2092 CrossRef CAS.
- Y. P. Li, T. J. Wang, C. Z. Wu, X. X. Qin and N. Tsubaki, Effect of Ru addition to Co/SiO2/HZSM-5 catalysts on Fischer–Tropsch synthesis of gasoline range hydrocarbons, Catal. Commun., 2009, 1868 CrossRef.
- M. L. DosSantos, R. C. Lima, C. S. Riccardi, R. L. Tranquilin, P. R. Bueno, J. A. Varela and E. Longo, Preparation and characterization of ceria nanospheres by microwave-hydrothermal method, Mater. Lett., 2008, 4509 CrossRef CAS.
- H. Su, S. Zeng, H. Dong, Y. Du, Y. Zhang and R. Hu, Pillared Montmorillonite Supported Cobalt Catalysts for the Fischer–Tropsch Reaction, Appl. Clay Sci., 2009, 325 CrossRef CAS.
- K. J. Davies, S. Wells and S. W. Charles, The effect of temperature and oleate adsorption on the growth of maghemite particles, J. Magn. Magn. Mater., 1993, 24 CrossRef CAS.
- B. De Rivas, J. Gutierrez-Ortiz, R. Lopez-Fonseca and J. Gonzalez-Velasco, Analysis of the simultaneous catalytic combustion of chlorinated aliphatic pollutants and toluene over ceria–zirconia mixed oxides, Appl. Catal., A, 2006, 54 CrossRef CAS.
- Y. Köseoğlu, F. Alan, M. Tan, R. Yilgin and M. Öztürk, Low temperature hydrothermal synthesis and characterization of Mn doped cobalt ferrite nanoparticles, Ceram. Int., 2012, 3625 CrossRef.
- C. Luo, Y. Fu, D. Zhang, S. Yuan, Y. Zhai, S. Dong and H. Zhai, Temperature dependent coercivity and magnetization of light rare-earth Nd doped permalloy thin films, J. Magn. Magn. Mater., 2015, 711 CrossRef CAS.
- P. A. Chernavskii, A. Y. Khodakov, G. V. Pankina, J.-S. Girardon and E. Quinet, In situ characterization of the genesis of cobalt metal particles in silica-supported Fischer–Tropsch catalysts using Foner magnetic method, Appl. Catal., A, 2006, 108 CrossRef CAS.
- Y. L. Yao, X. Y. Liu, D. Hildebrandt and D. Glasser, Fischer–Tropsch synthesis using H2/CO/CO2 syngas mixture: A comparison of paraffin to olefin ratios for iron and cobalt based catalysts, Appl. Catal., A, 2012, 433 Search PubMed.
- F. Yan, W. Qian, Q. Sun, H. Zhang, W. Ying and D. Fang, Product distributions and olefin-to-paraffin ratio over an iron-based catalyst for Fischer–Tropsch synthesis, React. Kinet., Mech. Catal., 2014, 471 CrossRef CAS.
- M. Feyzi, N. Yaghobi and V. Eslamimanesh, Cobalt–iron nano catalysts supported on TiO2–SiO2: characterization and catalytic performance in Fischer-Tropsch synthesis, Mater. Res. Bull., 2015, 72, 143–153 CrossRef CAS.
Footnote |
| † Electronic supplementary information (ESI) available. See DOI: 10.1039/c7ra05490d |
| This journal is © The Royal Society of Chemistry 2017 |

