 Open Access Article
Creative Commons Attribution 3.0 Unported Licence
Catalytic effect of (Ti0.85Zr0.15)1.05Mn1.2Cr0.6V0.1Cu0.1 on hydrogen storage properties of ultrafine magnesium particles†
Peng Liua,
Xiujuan Maa,
Xiubo Xiea,
Xingguo Lib and
Tong Liu *a
*a
aKey Laboratory of Aerospace Materials and Performance, Ministry of Education, School of Materials Science and Engineering, Beihang University, No. 37 Xueyuan Road, Beijing, 100191, China. E-mail: tongliu@buaa.edu.cn; Fax: +86 10 82316192; Tel: +86 10 82316192
bBeijing National Laboratory for Molecular Sciences (BNLMS), The State Key Laboratory of Rare Earth Materials Chemistry and Applications, College of Chemistry and Molecular Engineering, Peking University, Beijing 100871, China
First published on 10th July 2017
Abstract
In order to improve hydrogen storage properties of magnesium, (Ti0.85Zr0.15)1.05Mn1.2Cr0.6V0.1Cu0.1 (TiMn2 type) alloy particles have been added into magnesium ultrafine particles produced by a hydrogen plasma-metal reaction approach by ball milling. The (Ti0.85Zr0.15)1.05Mn1.2Cr0.6V0.1Cu0.1 particles are uniformly dispersed on the surface of magnesium. The addition of (Ti0.85Zr0.15)1.05Mn1.2Cr0.6V0.1Cu0.1 alloy improves both the hydrogen storage capacity and kinetics of magnesium. The magnesium–5 wt% (Ti0.85Zr0.15)1.05Mn1.2Cr0.6V0.1Cu0.1 composite can absorb 6.00 wt% H2 within 60 minutes at 523 K and desorb 6.00 wt% H2 within 15 minutes at 623 K. With the increase of (Ti0.85Zr0.15)1.05Mn1.2Cr0.6V0.1Cu0.1, the hydrogenation and dehydrogenation kinetics of the composites improve. The apparent activation energies of magnesium–x wt% (Ti0.85Zr0.15)1.05Mn1.2Cr0.6V0.1Cu0.1 (x = 5, 10, 30) composites for hydrogen absorption and desorption are 67.52, 65.80, 60.99 kJ mol−1 and 121.37, 116.68, 77.25 kJ mol−1, respectively. The enhanced hydrogen storage capacities and kinetics can be attributed to the effective catalysis of the (Ti0.85Zr0.15)1.05Mn1.2Cr0.6V0.1Cu0.1 alloy and ultrafine size of magnesium particles.
Introduction
With fossil fuel resources rapidly depleting, searching for alternative energy resources is becoming an increasingly common concern for governments and scientists worldwide. Hydrogen, as a kind of pollution-free, high-energy-density and recyclable secondary energy carrier, is one of the most promising candidates to substitute fossil fuels in the future. Conventional storage of compressed hydrogen under high pressure is of low gravimetric and volumetric H2 density, making it difficult to reach the targets of the DOE.1 Meanwhile, storage of liquid hydrogen faces problems of nearly 30% energy loss in the process of liquefaction and the high requirements for the storage system. Compared with these methods, storing hydrogen using solid-state materials has the advantages of suitable storage capacity, high safety and less energy loss.2,3 Among various solid-state hydrogen storage materials, magnesium (Mg) is considered to be an attractive one for its high theoretical reversible hydrogen storage capacity (7.6 wt%), light weight and low cost.4,5 However, the sluggish hydrogenation/dehydrogenation kinetics and the high decomposition temperature still limit its practical application for hydrogen storage.6Transition metals,7,8 oxides9–13 and hydrogen storage alloys14,15 were used as the catalysts to improve the hydrogen storage performance of Mg through ball milling technique. Among these additives, hydrogen storage alloys which can absorb and desorb hydrogen at room temperature are quite potential one for their effective catalysts on kinetics and hydrogen capacities. Generally, Mg could absorb hydrogen only at temperatures higher than 573 K with a slow hydrogenation rate. It has been reported that Mg at microscale absorbed 1.5 wt% H2 within 2 h at 673 K.16,17 The milled Mg–TiMn1.5 composite absorbed hydrogen of 4.0 wt% at 573 K in 5 min.18 A milled Mg–Ti0.28Cr0.50V0.22 composite could absorb 4.0 wt% H2 at 548 K within 10 min.19 After ball milling for 5 hours, the Mg–V0.855Ti0.095Fe0.05 composite presented a rapid hydrogen sorption rate, which was able to uptake 4.97 wt% H2 at 573 K within 60 min and release 5.5 wt% hydrogen at 623 K within 40 min.20 Among the hydrogen storage alloys, the TiMn2 type alloys21 with excellent hydrogen storage properties at room temperature are seldom studied as an additive for Mg-based hydrogen storage material, let alone the consideration of their content on the performance of Mg.
Although high energy ball milling can reduce the grains of Mg particles to nanosize, their particle sizes are still in the range of micrometers.22,23 It has been demonstrated that the sorption kinetics of Mg can be significantly enhanced when its size is reduced to nanoscale.24–29 Thus, using Mg ultrafine particles (UFPs) and doping TiMn2 type alloys are expected to improve the comprehensive hydrogen storage performance of Mg. Hydrogen plasma-metal reaction (HPMR) approach is often used to produce metallic UFPs at large scale and with high purity. Recently, Mg and Mg-based composite UFPs, such as Mg–Al, Mg–Ti–V, and Mg–Nb, have been successfully prepared through HPMR technique.30–32 Recently, we prepared a kind of TiMn2 type alloy ((Ti0.85Zr0.15)1.05Mn1.2Cr0.6V0.1Cu0.1) with good hydrogen storage properties at room temperature. In this work, we intend to fabricate the Mg–x wt% TiMn2 (x = 0, 5, 10, 30) composites by milling the Mg UFPs produced by HPMR with the TiMn2 alloy, investigate their hydrogen storage properties and the effects of content of TiMn2 alloy on the performance of Mg, and clarify the catalytic mechanism of the TiMn2 alloy for improving the hydrogenation and dehydrogenation properties of Mg in detail.
Experimental
Preparation of Mg–x wt% (Ti0.85Zr0.15)1.05Mn1.2Cr0.6V0.1Cu0.1 composites
The (Ti0.85Zr0.15)1.05Mn1.2Cr0.6V0.1Cu0.1 alloy was prepared by arc melting of the constituent metals with the purity more than 99.5% on a water-cooled copper crucible under a high purity argon atmosphere (99.999%). An excess amount of Mn of 5 wt% was added considering the weight loss of Mn during melting due to its low melting point. The button was turned over and re-melted four times to ensure high homogeneity. Then, it was mechanically crushed into several pieces and ground into powders with the stainless mortar in the glove box. The Mg UFPs were produced by HPMR method in a water-cooled chamber connected with a collecting room. The arc discharge of Mg (purity >99.5%) ingot of 20 g was performed in a mixture of hydrogen and argon in a ratio of 1![[thin space (1/6-em)]](https://www.rsc.org/images/entities/char_2009.gif) :
:![[thin space (1/6-em)]](https://www.rsc.org/images/entities/char_2009.gif) 1 with a total pressure of 0.1 MPa. During the process, the discharge current was kept at 100 A. The UFPs were collected in Ar atmosphere. The (Ti0.85Zr0.15)1.05Mn1.2Cr0.6V0.1Cu0.1 powders and Mg UFPs were mixed homogeneously with a composition of Mg–x wt% (Ti0.85Zr0.15)1.05Mn1.2Cr0.6V0.1Cu0.1 (x = 0, 5, 10, 30). The mixtures were put into a stainless steel vial in the glove box and were milled under an initial pressure of 4 MPa H2 with planetary ball miller at a rotation speed of 200 rpm for 2 h and a ball-to-powder ratio of 20
1 with a total pressure of 0.1 MPa. During the process, the discharge current was kept at 100 A. The UFPs were collected in Ar atmosphere. The (Ti0.85Zr0.15)1.05Mn1.2Cr0.6V0.1Cu0.1 powders and Mg UFPs were mixed homogeneously with a composition of Mg–x wt% (Ti0.85Zr0.15)1.05Mn1.2Cr0.6V0.1Cu0.1 (x = 0, 5, 10, 30). The mixtures were put into a stainless steel vial in the glove box and were milled under an initial pressure of 4 MPa H2 with planetary ball miller at a rotation speed of 200 rpm for 2 h and a ball-to-powder ratio of 20![[thin space (1/6-em)]](https://www.rsc.org/images/entities/char_2009.gif) :
:![[thin space (1/6-em)]](https://www.rsc.org/images/entities/char_2009.gif) 1. The collecting and filling of the sample were operated in the glove box filled with Ar to prevent oxidation.
1. The collecting and filling of the sample were operated in the glove box filled with Ar to prevent oxidation.
Characterization
The hydrogen absorption and desorption properties of the (Ti0.85Zr0.15)1.05Mn1.2Cr0.6V0.1Cu0.1 and Mg–x wt% (Ti0.85Zr0.15)1.05Mn1.2Cr0.6V0.1Cu0.1 (x = 0, 5, 10, 30) composites were evaluated using a Sieverts-type apparatus. Prior to the measurements, the samples of (Ti0.85Zr0.15)1.05Mn1.2Cr0.6V0.1Cu0.1 alloy experienced one hydrogen absorption/desorption cycle at room temperature at the hydrogen pressure of 4 MPa and vacuum. The Mg–x wt% (Ti0.85Zr0.15)1.05Mn1.2Cr0.6V0.1Cu0.1 (x = 0, 5, 10, 30) composites were activated by one hydrogen absorption/desorption cycle at 400 °C at the hydrogen pressure of 4 MPa and vacuum. The initial hydrogen pressures for hydrogenation/dehydrogenation were selected as 4 MPa and 100 Pa at each temperature. The pressure–composition–temperature (PCT) curves at different temperatures (623, 648, and 673 K) were plotted using the conventional pressure–volume–temperature technique to investigate the thermodynamic property of the composites. The hydrogen absorption or desorption measurement for the PCT curves was considered as reaching equilibrium when the vibration of hydrogen pressure at the certain temperature was less than 20 Pa s−1. The X-ray diffraction (XRD) patterns of the samples were recorded with a Rigaku X-ray diffractometer with monochromatic Cu Kα radiation. Scanning electronic microscope (SEM) was applied to analyze the morphology of the samples. An energy dispersive spectroscopy (EDS) detector was used to determine the elemental distributions.Results and discussion
Sample characterization
Fig. 1a displays the typical hexagonal shape of Mg UFPs fabricated by the HPMR method with an average particle size of 300 nm. It can be observed from Fig. 1b that the as-prepared Mg UFPs have single α-Mg phase (JCPDS no. 35-0821, space group P63/mmc). The as-prepared (Ti0.85Zr0.15)1.05Mn1.2Cr0.6V0.1Cu0.1 particles consist of single C14-Laves phase (JCPDS no. 50-1114, space group P63/mmc), see Fig. 1c. | ||
| Fig. 1 TEM image of the Mg UFPs fabricated by the HPMR method (a) and XRD patterns of the as-prepared Mg UFPs (b) and (Ti0.85Zr0.15)1.05Mn1.2Cr0.6V0.1Cu0.1 particles (c). | ||
After ball milling process, the Mg–TiMn2 alloy composites with different percentage of (Ti0.85Zr0.15)1.05Mn1.2Cr0.6V0.1Cu0.1 show similar morphologies. Fig. 2a displays the SEM image of the as-milled Mg–30 wt% (Ti0.85Zr0.15)1.05Mn1.2Cr0.6V0.1Cu0.1 composite as an example. It can be seen that the particle size varies from 100 to 500 nm with an average of about 200 nm. The as-milled Mg–(Ti0.85Zr0.15)1.05Mn1.2Cr0.6V0.1Cu0.1 particles were nearly spherical in shape, which was different from the pure Mg UFPs prepared by HPMR with a clear hexagonal shape (see Fig. 1a). Since (Ti0.85Zr0.15)1.05Mn1.2Cr0.6V0.1Cu0.1 is brittle, we suppose that the TiMn2 type alloy powders are broken and cover on the Mg UFPs after ball milling. It is interesting to find that the particle size and morphology of the composite sample stay unchangeable after hydrogenation and dehydrogenation cycles, see Fig. 2b.
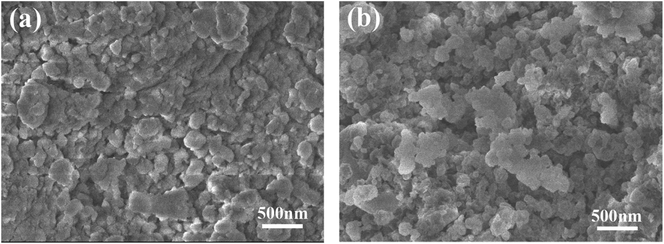 | ||
| Fig. 2 SEM images of the Mg–30 wt% (Ti0.85Zr0.15)1.05Mn1.2Cr0.6V0.1Cu0.1 composite: (a) as-milled and (b) after hydrogenation and dehydrogenation cycles. | ||
To further reveal the morphology and elements distribution of Mg–(Ti0.85Zr0.15)1.05Mn1.2Cr0.6V0.1Cu0.1 composite, high magnification SEM and EDS analyses were conducted. Fig. 3a displays the SEM image of Mg–30 wt% (Ti0.85Zr0.15)1.05Mn1.2Cr0.6V0.1Cu0.1 composite after ball milling. A large number of small particles can be seen clearly on the coarse surface of large particles. EDS mapping results (Fig. 3b–h) show that the composite particle is dominantly made of Mg together with a certain amount of Mn, Ti, Cr, Zr, V, and Cu, which indicates (Ti0.85Zr0.15)1.05Mn1.2Cr0.6V0.1Cu0.1 particles are distributed homogeneously on the surface of Mg particles. The Mg–(Ti0.85Zr0.15)1.05Mn1.2Cr0.6V0.1Cu0.1 composites with 5 wt% and 10 wt% (Ti0.85Zr0.15)1.05Mn1.2Cr0.6V0.1Cu0.1 exhibit similar morphologies and uniform elements distribution.
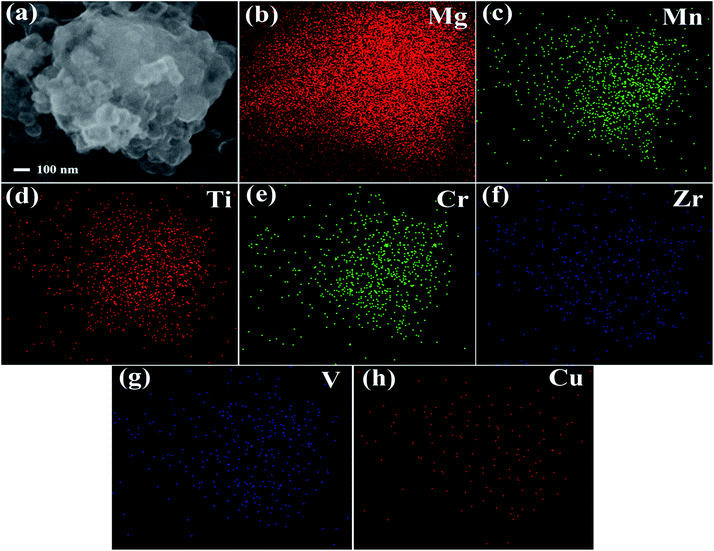 | ||
| Fig. 3 High magnification SEM image of the Mg–30 wt% (Ti0.85Zr0.15)1.05Mn1.2Cr0.6V0.1Cu0.1 composite (a) and EDS maps of Mg (b), Mn (c), Ti (d), Cr (e), Zr (f), V (g), Cu (h). | ||
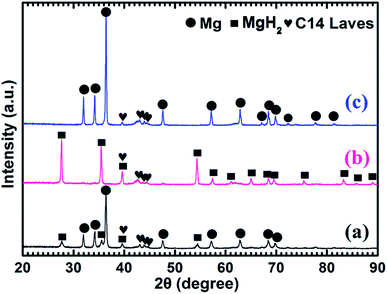
Fig. 4 shows the XRD patterns of the as-prepared Mg–5 wt% (Ti0.85Zr0.15)1.05Mn1.2Cr0.6V0.1Cu0.1 composite and the samples obtained after the hydrogen absorption and desorption at 673 K. Three strong diffraction peaks of α-Mg phase at 36.35°, 34.19° and 31.92° can be seen clearly in Fig. 4a, which are in good accordance with the peaks of the as-prepared Mg UFPs sample in Fig. 1b. Four weak diffraction peaks at 39.58°, 43.05°, 43.89° and 44.85° can also be found in Fig. 4a, which agree well with the as-prepared (Ti0.85Zr0.15)1.05Mn1.2Cr0.6V0.1Cu0.1 alloy with a typical C14 Laves phase (see Fig. 1c). It is known that whether the hydride of Mg can be formed is determined by its hydrogen sorption kinetics and thermodynamics. It was reported that the formation of magnesium hydride during the HPMR process is suppressed by the low hydrogen pressure (0.05 MPa) and the high cooling rate.31 In this work, no hydride can be found in the XRD pattern of the as-prepared Mg UFPs, see Fig. 1b. Generally, the formation of MgH2 from Mg by gas–solid reaction needs high temperature (>600 K) and high hydrogen pressure (>5 MPa).33 Even after milling pure Mg at microscale for 4 h under hydrogen atmosphere, no hydride phase is formed.34 However, in this work, 4 weak diffraction peaks of MgH2 (JCPDS no. 12-0697, space group P42/mnm) at 27.67°, 35.57°, 39.58° and 54.49° for the ball milled pure Mg UFPs are discernable in Fig. S1,† indicating the ultrafine size of Mg particles contributes to the formation of MgH2 at room temperature. Xie et al.4 also found that hydride can be formed after ball milling under the same condition for Mg UFPs. The intensities of the diffraction peaks of MgH2 in Mg–5 wt% (Ti0.85Zr0.15)1.05Mn1.2Cr0.6V0.1Cu0.1 composite in Fig. 4a are even stronger than those in the ball milled pure Mg UFPs. This implies that the catalytic effects of (Ti0.85Zr0.15)1.05Mn1.2Cr0.6V0.1Cu0.1, together with ultrafine size of Mg particles, is helpful to the formation of more MgH2. Fan et al.35 also found that Ti0.9Zr0.2Mn1.5Cr0.3 alloy catalyzed the reaction between Mg and H2 at room temperature. There is no (Ti0.85Zr0.15)1.05Mn1.2Cr0.6V0.1Cu0.1 hydride phase present in the as-prepared XRD patterns. This is due to the fact that the desorption equilibrium pressure of (Ti0.85Zr0.15)1.05Mn1.2Cr0.6V0.1Cu0.1 is rather high, about 0.9 MPa (see Fig. S2†) at room temperature, thus its hydride phase is not stable during the XRD test.
It can be observed from Fig. 4b that Mg in the Mg–5 wt% (Ti0.85Zr0.15)1.05Mn1.2Cr0.6V0.1Cu0.1 composite transforms completely into MgH2 after hydrogenation at 673 K. After the dehydrogenation at 673 K, MgH2 completely transforms into Mg (see Fig. 4c). The (Ti0.85Zr0.15)1.05Mn1.2Cr0.6V0.1Cu0.1 phase appears to be stable during the hydrogenation and dehydrogenation process (see Fig. 4b and c), suggesting that (Ti0.85Zr0.15)1.05Mn1.2Cr0.6V0.1Cu0.1 does not react with Mg, nor does it react with MgH2. Therefore, the (Ti0.85Zr0.15)1.05Mn1.2Cr0.6V0.1Cu0.1 dopant plays a role of catalyst during both the hydrogenation and dehydrogenation processes of Mg. Zhou et al. also found Ti0.98Zr0.02V0.43Fe0.09Cr0.05Mn1.5 phase in Mg–TiMn2 composite stayed stable during the hydrogen absorption and desorption process acting as a catalyst.36
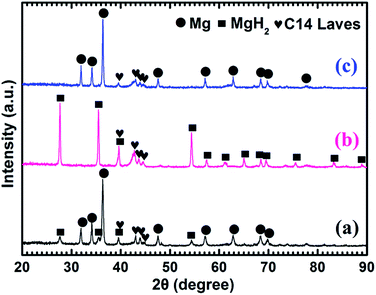
Fig. 5a shows that the prepared Mg–10 wt% (Ti0.85Zr0.15)1.05Mn1.2Cr0.6V0.1Cu0.1 composite also consists of Mg, MgH2 and C14 Laves phases. As shown in Fig. 5b and c, Mg fully transforms into MgH2 after hydrogenation at 673 K, and MgH2 releases H2 completely and transforms into Mg after dehydrogenation at 673 K. The C14-(Ti0.85Zr0.15)1.05Mn1.2Cr0.6V0.1Cu0.1 phase also keeps stable during the hydrogenation and dehydrogenation process (see Fig. 5b and c). Compared Fig. 4a–c for Mg–5 wt% (Ti0.85Zr0.15)1.05Mn1.2Cr0.6V0.1Cu0.1 composite, the peak intensities of (Ti0.85Zr0.15)1.05Mn1.2Cr0.6V0.1Cu0.1-C14 Laves phase in Fig. 5a–c are stronger due to the increasing content.
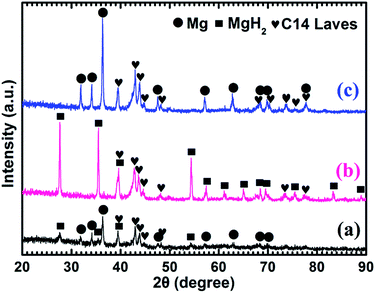
Fig. 6a represents that the prepared Mg–30 wt% (Ti0.85Zr0.15)1.05Mn1.2Cr0.6V0.1Cu0.1 composite contains the same phases as the samples with 5 wt% and 10 wt% TiMn2 alloy. Mg transforms into MgH2 (as shown in Fig. 6b) after absorbing hydrogen at 673 K and then transforms completely into Mg after desorbing hydrogen at 673 K (see Fig. 6c). The (Ti0.85Zr0.15)1.05Mn1.2Cr0.6V0.1Cu0.1 alloy keeps its phase unchanged during the testing process. It can be seen from Fig. 6 that the intensities of the diffraction peaks of (Ti0.85Zr0.15)1.05Mn1.2Cr0.6V0.1Cu0.1-C14 Laves phase are much stronger comparing with the composites with 5 wt% and 10 wt% TiMn2 alloy, and more weak peaks such as 48.05°, 73.71° and 77.76° can be seen clear in Fig. 6b and c.
Hydrogen storage properties
To further understand the catalytic effect of (Ti0.85Zr0.15)1.05Mn1.2Cr0.6V0.1Cu0.1 on the hydrogen properties of Mg, the hydrogen absorption and desorption capacities and kinetics are measured by a carefully calibrated Sieverts-type apparatus. Hydrogen content (wt%) is the weight ratio of hydrogen and the Mg–(Ti0.85Zr0.15)1.05Mn1.2Cr0.6V0.1Cu0.1 composites. The hydrogenation curves at various temperatures with an initial hydrogen pressure of 4 MPa are presented in Fig. 7. It can be observed from Fig. 7a that the ball milled Mg UFPs can quickly uptake 6.00 wt% hydrogen within 5 min at 673 K and uptake 5.50 wt% hydrogen within 2.5 min at 623 K. However, without milling, the Mg UFPs need 10 min at 673 K and 20 min at 623 K absorb the same amount hydrogen.31 The ball milled Mg UFPs have hydrogenation capacities of 5.93 wt% at 573 K and 5.83 wt% at 523 K, much higher than that of the Mg UFPs without milling, whose hydrogenation capacities are only 4.82 wt% at 573 K and 4.41 wt% at 523 K.31 Generally, fresh surface areas can be generated in Mg during the milling process.35 The higher hydrogenation capacity and better kinetics for the ball milled Mg UFPs are attributed to the fresh surface areas, whose oxide layers may be removed during the milling process.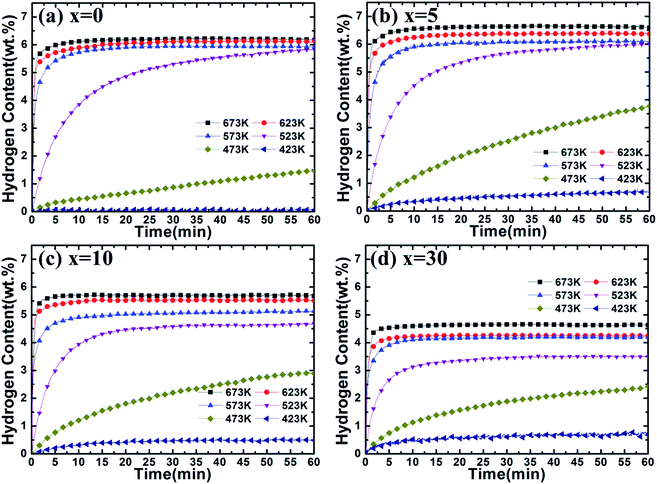 | ||
| Fig. 7 Hydrogenation kinetics of Mg–x wt% (Ti0.85Zr0.15)1.05Mn1.2Cr0.6V0.1Cu0.1 (x = 0, 5, 10, 30) composites at 4 MPa hydrogen and different temperatures. | ||
It is observed in Fig. 7b that Mg–5 wt% (Ti0.85Zr0.15)1.05Mn1.2Cr0.6V0.1Cu0.1 composite has a high hydrogen absorption capacity of 6.54 wt% and can quickly absorb 6.00 wt% H2 within 100 s at 673 K, showing better kinetics and capacity than the ball milled pure Mg UFPs, which has a hydrogen absorption capacity of 6.25 wt% and needs 300 s to uptake 6.00 wt% hydrogen at 673 K. This indicates that the (Ti0.85Zr0.15)1.05Mn1.2Cr0.6V0.1Cu0.1 alloy catalyzes the hydrogenation process of Mg. The reduced particle size of Mg in the Mg–TiMn2 composite compared with Mg UFPs without milling should increase the surface area, which may also attribute to the improved hydrogen storage performance to some extent. On the other hand, the particle sizes of the ball milled Mg with and without TiMn2 alloy are comparable, we suggest that the improved performance of the Mg–x wt% TiMn2 (x = 5, 10, 30) samples in comparison with the pure Mg sample after ball milling are mainly attributed to the catalytic effect of TiMn2 alloy. In addition, it takes more than 120 s for Mg–Nb nanocomposite prepared by HPMR to reach a value of 6.00 wt% H2 under the same condition.32 It is also observed that the Mg–5 wt% (Ti0.85Zr0.15)1.05Mn1.2Cr0.6V0.1Cu0.1 composite is able to absorb 6.00 wt% H2 within 5 min at 623 K, superior to Mg–7 at% Al nanoparticles synthesized by the HPMR method that only absorbed 5.41 wt% H2 within 5 min at 623 K.30 These results demonstrate the superior catalytic effects of (Ti0.85Zr0.15)1.05Mn1.2Cr0.6V0.1Cu0.1 alloy. The Mg–5 wt% (Ti0.85Zr0.15)1.05Mn1.2Cr0.6V0.1Cu0.1 composite can also rapidly absorb 5.50 wt% H2 in 5 min and reach a final value of 6.10 wt% at 573 K, higher than the Mg–5 at% Ti0.98Zr0.02V0.43Fe0.09Cr0.05Mn1.5 composite prepared by milling commercial MgH2 (tens micrometer-scale particle size) with Ti0.98Zr0.02V0.43Fe0.09Cr0.05Mn1.5 alloy, which absorbed a total of 5.5 wt% H2 at 573 K.36 This suggests that the enhanced hydrogenation properties of the Mg–(Ti0.85Zr0.15)1.05Mn1.2Cr0.6V0.1Cu0.1 composites are also relate to the ultrafine size of Mg which shortens the diffusion distances in the sorption process. The storage capacity of the Mg–5 wt% (Ti0.85Zr0.15)1.05Mn1.2Cr0.6V0.1Cu0.1 composite reaches 6.00 wt% H2 within 60 min at 523 K, higher than the Mg–Ti–V nanoparticles which absorbs 5.00 wt% in 60 min at 523 K.31 The hydrogen absorption capacity of the Mg–5 wt% (Ti0.85Zr0.15)1.05Mn1.2Cr0.6V0.1Cu0.1 composite decreases dramatically from 3.78 wt% to 0.68 wt% with the temperature dropping from 473 K to 423 K, which is still much higher than that of the ball milled pure Mg UFPs which only absorb 1.47 wt% and 0.06 wt% H2 at 473 K and 423 K respectively (see Fig. 7a).
It can be seen from Fig. 7c that the Mg–10 wt% (Ti0.85Zr0.15)1.05Mn1.2Cr0.6V0.1Cu0.1 composite has hydrogenation capacities of 5.72, 5.52, 5.14, 4.69 and 2.90 wt% H2 at 673, 623, 573, 523 and 473 K respectively, lower than that of the Mg–5 wt% (Ti0.85Zr0.15)1.05Mn1.2Cr0.6V0.1Cu0.1 composite. That is due to (Ti0.85Zr0.15)1.05Mn1.2Cr0.6V0.1Cu0.1 alloy does not absorb or desorb hydrogen at the temperature above 423 K (as shown in Fig. S3†). The reaction percentage (%) for certain reaction time is calculated through dividing the hydrogen content for the reaction time by the saturation hydrogen content at different temperatures. The hydrogenation reaction percentage of Mg–10 wt% (Ti0.85Zr0.15)1.05Mn1.2Cr0.6V0.1Cu0.1 composite within 10 min is calculated from Fig. 7c to be 84% and 41% at 523 K and 473 K respectively. However, the hydrogenation reaction percentage of the Mg–5 wt% (Ti0.85Zr0.15)1.05Mn1.2Cr0.6V0.1Cu0.1 composite within 10 min calculated from Fig. 7b is only 75% and 32% at 523 K and 473 K respectively, indicating that the increase of (Ti0.85Zr0.15)1.05Mn1.2Cr0.6V0.1Cu0.1 content contributes to the improvement of hydrogenation kinetics.
Fig. 7d shows that the Mg–30 wt% (Ti0.85Zr0.15)1.05Mn1.2Cr0.6V0.1Cu0.1 composite can absorb 4.63, 4.25, 4.19, 3.50 and 2.41 wt% H2 at 673, 623, 573, 523 and 473 K respectively, lower than the composite with 10 wt% (Ti0.85Zr0.15)1.05Mn1.2Cr0.6V0.1Cu0.1 because of the increasing weight of (Ti0.85Zr0.15)1.05Mn1.2Cr0.6V0.1Cu0.1 alloy. It can be calculated from Fig. 7b that the hydrogenation reaction percentage of the Mg–30 wt% (Ti0.85Zr0.15)1.05Mn1.2Cr0.6V0.1Cu0.1 composite at 10 min is 91% and 47% at 523 K and 473 K respectively, better than the composite with 10 wt% (Ti0.85Zr0.15)1.05Mn1.2Cr0.6V0.1Cu0.1 alloy. This implies that (Ti0.85Zr0.15)1.05Mn1.2Cr0.6V0.1Cu0.1 improves the hydrogenation kinetics of Mg, and adding more (Ti0.85Zr0.15)1.05Mn1.2Cr0.6V0.1Cu0.1 leads to higher hydrogenation rate but deteriorates hydrogenation capacity.
It can be concluded that adding a certain amount of (Ti0.85Zr0.15)1.05Mn1.2Cr0.6V0.1Cu0.1 alloy can improve both the hydrogen absorption capacity and rate of Mg. The hydrogen absorption capacity of the Mg–(Ti0.85Zr0.15)1.05Mn1.2Cr0.6V0.1Cu0.1 composite decreases but its kinetics improves with the increase of (Ti0.85Zr0.15)1.05Mn1.2Cr0.6V0.1Cu0.1 content.
The dehydrogenation curves of Mg–x wt% (Ti0.85Zr0.15)1.05Mn1.2Cr0.6V0.1Cu0.1 (x = 0, 5, 10, 30) composites at various temperatures with an initial hydrogen pressure of 100 Pa are presented in Fig. 8. It is observed that the ball milled Mg UFPs can release 5.00 wt% H2 in 2 min at 673 K and reach a value of 6.20 wt% H2 in 60 min, much better than the Mg UFPs without milling, which can only desorb less than 5.00 wt% H2 within 60 min at the same temperature.31 It is also observed that the ball milled Mg UFPs can quickly desorb 6.00 wt% H2 in 20 min and reach a value of 6.10 wt% H2 in 60 min at 623 K, superior to the Mg UFPs synthesized by the HPMR method that released less than 4.00 wt% H2 at 623 K in 60 min.31 Obviously, the milling process significantly improves the dehydrogenation capacities and kinetics of Mg.
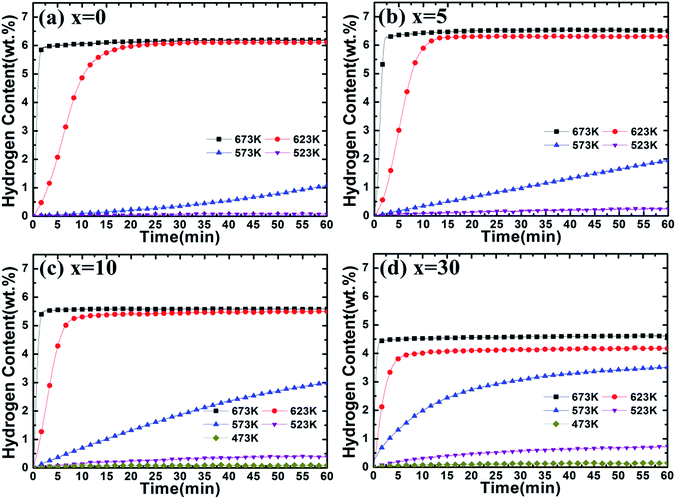 | ||
| Fig. 8 Dehydrogenation kinetics of Mg–x wt% (Ti0.85Zr0.15)1.05Mn1.2Cr0.6V0.1Cu0.1 (x = 0, 5, 10, 30) composites at 100 Pa and different temperatures. | ||
As shown in Fig. 8b, Mg–5 wt% (Ti0.85Zr0.15)1.05Mn1.2Cr0.6V0.1Cu0.1 composite is able to quickly desorb 6.00 wt% H2 within 90 s at 673 K and within 15 min at 623 K, while it takes 250 s and 20 min for the ball milled Mg UFPs to reach the same value at 673 K and 623 K respectively, indicating that the (Ti0.85Zr0.15)1.05Mn1.2Cr0.6V0.1Cu0.1 alloy improves the hydrogen desorption capacities and kinetics apparently as a catalyst. In comparison with the Mg–Nb nanocomposite which needed 220 s to desorb 6.00 wt% H2 at 673 K and 27 min to desorb 6.00 wt% H2 at 673 K,32 the (Ti0.85Zr0.15)1.05Mn1.2Cr0.6V0.1Cu0.1 alloy shows superior catalytic effects on the dehydrogenation of MgH2. The hydrogen desorption capacity of Mg–5 wt% (Ti0.85Zr0.15)1.05Mn1.2Cr0.6V0.1Cu0.1 composite within 60 min reaches 6.51 wt% H2 at 673 K, 6.30 wt% H2 at 623 K and 1.93 wt% H2 at 573 K, much higher than that of Mg–Ti–V nanocomposite which desorbed 5.01 wt%, 4.02 wt% and 1.13 wt% H2 at 673 K, 623 K and 573 K respectively.31 It can be deduced that the (Ti0.85Zr0.15)1.05Mn1.2Cr0.6V0.1Cu0.1 particles on the surface of MgH2 particles effectively improve the hydrogen desorption rate and capacity of MgH2. It can be seen from Fig. 8c that the Mg–10 wt% (Ti0.85Zr0.15)1.05Mn1.2Cr0.6V0.1Cu0.1 composite has dehydrogenation capacities of 5.59 wt% H2 at 673 K and 5.50 wt% H2 at 623 K, lower than that of the Mg–5 wt% (Ti0.85Zr0.15)1.05Mn1.2Cr0.6V0.1Cu0.1 composite due to the dead weight of (Ti0.85Zr0.15)1.05Mn1.2Cr0.6V0.1Cu0.1 alloy. The Mg–10 wt% (Ti0.85Zr0.15)1.05Mn1.2Cr0.6V0.1Cu0.1 composite can desorb 2.99 wt% H2 within 200 s at 623 K, whose dehydrogenation reaction percentage at 200 s calculated from Fig. 8c is 54.4%. In comparison, the Mg–5 wt% (Ti0.85Zr0.15)1.05Mn1.2Cr0.6V0.1Cu0.1 composite can desorb 1.17 wt% H2 within 200 s at 623 K, whose dehydrogenation reaction percentage at 200 s calculated from Fig. 8b is only 18.1%, indicating the increase of (Ti0.85Zr0.15)1.05Mn1.2Cr0.6V0.1Cu0.1 content contributes to the improvement of its dehydrogenation kinetics. Surprisingly, the Mg–10 wt% (Ti0.85Zr0.15)1.05Mn1.2Cr0.6V0.1Cu0.1 composite can release 2.99 wt% H2 within 60 min at 573 K, much higher than the Mg–5 wt% (Ti0.85Zr0.15)1.05Mn1.2Cr0.6V0.1Cu0.1 composite of 1.93 wt% under the same condition despite the increase of the dead weight of (Ti0.85Zr0.15)1.05Mn1.2Cr0.6V0.1Cu0.1 alloy. The similar phenomenon happens at 523 K. As shown in Fig. S3b,† the (Ti0.85Zr0.15)1.05Mn1.2Cr0.6V0.1Cu0.1 alloy has higher capacities and faster reaction rate during the hydrogen desorption process with the temperature decreases, which may cause its more significant catalytic effects on Mg at lower temperatures and thus lead to the unique phenomenon that Mg–(Ti0.85Zr0.15)1.05Mn1.2Cr0.6V0.1Cu0.1 composites have better hydrogen desorption capacities and kinetics at relatively low temperatures (<573 K) with the increasing content of (Ti0.85Zr0.15)1.05Mn1.2Cr0.6V0.1Cu0.1.
Fig. 8d represents that the Mg–30 wt% (Ti0.85Zr0.15)1.05Mn1.2Cr0.6V0.1Cu0.1 composite can release 4.62 wt% H2 at 673 K and 4.18 wt% H2 at 623 K, lower than the Mg–10 (Ti0.85Zr0.15)1.05Mn1.2Cr0.6V0.1Cu0.1 wt% composite with less TiMn2 alloy. However, the Mg–30 wt% (Ti0.85Zr0.15)1.05Mn1.2Cr0.6V0.1Cu0.1 composite still shows better dehydrogenation kinetics than Mg–10 wt% (Ti0.85Zr0.15)1.05Mn1.2Cr0.6V0.1Cu0.1 composite. It can desorb 3.35 wt% H2 within 200 s at 623 K, whose reaction percentage at 200 s calculated from Fig. 8d is 80.2% (54.4% for Mg–10 wt% (Ti0.85Zr0.15)1.05Mn1.2Cr0.6V0.1Cu0.1 composite). At 573 K and 523 K, the Mg–30 wt% (Ti0.85Zr0.15)1.05Mn1.2Cr0.6V0.1Cu0.1 composite can release 3.52 wt% and 0.73 wt% H2 within 60 min respectively, higher than Mg–10 wt% (Ti0.85Zr0.15)1.05Mn1.2Cr0.6V0.1Cu0.1 composite which can only desorb 2.99 wt% and 0.40 wt% H2 under the same temperatures. This further supports the fact that (Ti0.85Zr0.15)1.05Mn1.2Cr0.6V0.1Cu0.1 alloy plays an important role in promoting the hydrogen desorption properties of Mg.
In conclusion, we can find that both the hydrogen desorption capacity and rate of Mg are improved by the addition of a certain amount of (Ti0.85Zr0.15)1.05Mn1.2Cr0.6V0.1Cu0.1 alloy. With the increase of (Ti0.85Zr0.15)1.05Mn1.2Cr0.6V0.1Cu0.1 content, the hydrogen desorption kinetics of the composites improves but their capacity decreases at the temperature above 573 K. Specifically, both the hydrogen desorption kinetics and capacity of the composites increase with the enlargement of the (Ti0.85Zr0.15)1.05Mn1.2Cr0.6V0.1Cu0.1 alloy content at the temperature below 573 K.
The JMAK (Johnson–Mehl–Avrami–Kolmogorov) model is used to express the hydrogen sorption kinetics (see eqn (1)):37
ln[−ln(1 − α)] = η![[thin space (1/6-em)]](https://www.rsc.org/images/entities/char_2009.gif) ln ln![[thin space (1/6-em)]](https://www.rsc.org/images/entities/char_2009.gif) k + η k + η![[thin space (1/6-em)]](https://www.rsc.org/images/entities/char_2009.gif) ln ln![[thin space (1/6-em)]](https://www.rsc.org/images/entities/char_2009.gif) t t
| (1) |
![[thin space (1/6-em)]](https://www.rsc.org/images/entities/char_2009.gif) ln(k) can be obtained from the plot of ln[−ln(1 − α)] vs. ln(t).
ln(k) can be obtained from the plot of ln[−ln(1 − α)] vs. ln(t).
Then, the Arrhenius equation is used to calculate the hydrogenation activation energy:38,39
k = A![[thin space (1/6-em)]](https://www.rsc.org/images/entities/char_2009.gif) exp(−Ea/RT) exp(−Ea/RT)
| (2) |
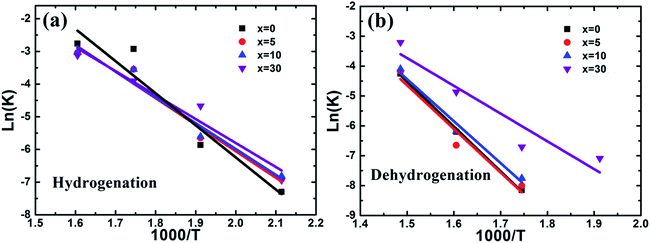 | ||
Fig. 9 Plots of ln![[thin space (1/6-em)]](https://www.rsc.org/images/entities/char_2009.gif) k vs. 1000/T for the hydrogenation (a) and dehydrogenation (b) of the Mg–x wt% (Ti0.85Zr0.15)1.05Mn1.2Cr0.6V0.1Cu0.1 (x = 0, 5, 10, 30) composites. k vs. 1000/T for the hydrogenation (a) and dehydrogenation (b) of the Mg–x wt% (Ti0.85Zr0.15)1.05Mn1.2Cr0.6V0.1Cu0.1 (x = 0, 5, 10, 30) composites. | ||
The dehydrogenation activation energy of the ball milled Mg UFPs calculated from Fig. 9b is 124.75 kJ mol−1, smaller than Mg UFPs prepared by HPMR without milling process of 127.7 kJ mol−1,31 demonstrating the milling process lowers the dehydrogenation activation energy. The hydrogenation activation energies of the composite samples also decrease with increasing (Ti0.85Zr0.15)1.05Mn1.2Cr0.6V0.1Cu0.1 content. Ea values of the composites with 5, 10, 30 wt% TiMn2 alloy calculated from Fig. 9a are 121.37, 116.68, 77.52 kJ mol−1, respectively, smaller than the ball milled Mg particles of 124.75 kJ mol−1 (see Fig. 9b). This implies adding (Ti0.85Zr0.15)1.05Mn1.2Cr0.6V0.1Cu0.1 can reduce the dehydrogenation activation energy of Mg effectively. The dehydrogenation activation energy of the composite with 30 wt% TiMn2 alloy is lower than that of the Mg–7 at% Al composite of 105.5 kJ mol−1 (ref. 30) and the Mg–Nb nanocomposite of 86.4 kJ mol−1,32 demonstrating the superior catalytic effect of (Ti0.85Zr0.15)1.05Mn1.2Cr0.6V0.1Cu0.1.
Because of the absence of d-electrons orbital, Mg does not have sufficient ability to dissociate hydrogen molecules without catalytic additives. In this work, (Ti0.85Zr0.15)1.05Mn1.2Cr0.6V0.1Cu0.1 particles make it easier for H2 molecules to be split into hydrogen atoms through facilitating the dissociation of hydrogen gas molecules during the hydrogenation process.36 When the dehydrogenation begins, some hydrogen atoms will be released from the MgH2 at the interface of MgH2/(Ti0.85Zr0.15)1.05Mn1.2Cr0.6V0.1Cu0.1 in priority because of destabilization of Mg–H bond by the TiMn2 alloy.33 As we can see in Fig. S3,† the hydride of (Ti0.85Zr0.15)1.05Mn1.2Cr0.6V0.1Cu0.1 cannot exist stably at the temperature above 423 K. Hydrogen atoms will therefore be recombined and released in the form of hydrogen molecules immediately once they are generated at the interface. The reduction of H2 accelerates the reaction: MgH2 = Mg + H2, thus the dehydrogenation kinetics will be enhanced. Additionally, the interfaces at the (Ti0.85Zr0.15)1.05Mn1.2Cr0.6V0.1Cu0.1/MgH2 boundaries with high interfacial energy can act as fast hydrogen diffusion paths to accelerate the hydrogen desorption process of MgH2.32
Mg–30 wt% (Ti0.85Zr0.15)1.05Mn1.2Cr0.6V0.1Cu0.1 composite was selected to evaluate the thermodynamic effects of the (Ti0.85Zr0.15)1.05Mn1.2Cr0.6V0.1Cu0.1 alloy on Mg. The PCT curves of the hydrogen absorption/desorption at 623, 648, and 673 K are plotted in Fig. 10a. Since the (Ti0.85Zr0.15)1.05Mn1.2Cr0.6V0.1Cu0.1 does not absorb hydrogen at the testing temperatures, only one flat plateau is detected for each absorption/desorption process as a result of the transformation between Mg and MgH2 at each temperature. The hydrogen equilibrium pressures of the absorption plateaus are 1.55 MPa at 673 K, 0.93 MPa at 648 K, and 0.52 MPa at 623 K. By plotting the logarithm of the equilibrium pressures ln(P) against the inverse temperature 1000/T and drawing the fitting line according to these plots, the Van't Hoff equation for absorption is determined as ln(P) = −9.162/T + 16.361. The formation enthalpy (ΔHab) calculated accordingly for the Mg–30 wt% (Ti0.85Zr0.15)1.05Mn1.2Cr0.6V0.1Cu0.1 composite is −76.16 kJ mol−1, which is comparable to the reported enthalpy value for MgH2 (−75 kJ mol−1).40 The hydrogen equilibrium pressures of the desorption plateaus are 1.45 MPa at 673 K, 0.84 MPa at 648 K, and 0.48 MPa at 623 K. The Van't Hoff equation for desorption is ln(P) = −9.2674/T + 16.439. The decomposition enthalpy (ΔHde) for the Mg–30 wt% (Ti0.85Zr0.15)1.05Mn1.2Cr0.6V0.1Cu0.1 composite is evaluated to be 77.05 kJ mol−1. Thus, the addition of (Ti0.85Zr0.15)1.05Mn1.2Cr0.6V0.1Cu0.1 does not apparently change the thermodynamics of hydrogenation and dehydrogenation of Mg. The high hydrogen storage capacity and the enhanced hydrogen sorption kinetics are due to the catalytic effect of (Ti0.85Zr0.15)1.05Mn1.2Cr0.6V0.1Cu0.1 alloys and the ultrafine size of Mg.
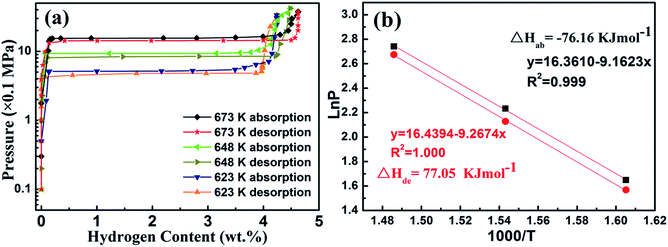 | ||
| Fig. 10 P–C isotherm curves at 623, 648, and 673 K (a) and Van't Hoff plots (b) for the Mg–30 wt% (Ti0.85Zr0.15)1.05Mn1.2Cr0.6V0.1Cu0.1 composite. | ||
Conclusions
The Mg–x wt% (Ti0.85Zr0.15)1.05Mn1.2Cr0.6V0.1Cu0.1 (x = 0, 5, 10, 30) composites have been successfully prepared by ball milling. The (Ti0.85Zr0.15)1.05Mn1.2Cr0.6V0.1Cu0.1 particles are homogeneously distributed on the surface or embedded in the Mg UFPs. Adding (Ti0.85Zr0.15)1.05Mn1.2Cr0.6V0.1Cu0.1 alloy contributes to the enhanced hydrogen storage capacities and kinetics. Mg–5 wt% (Ti0.85Zr0.15)1.05Mn1.2Cr0.6V0.1Cu0.1 composite can uptake 6.00 wt% H2 within 60 min at 523 K. It can release 6.00 wt% H2 within 15 min at 623 K. Both the hydrogen absorption and desorption kinetics of the composites improve when the content of (Ti0.85Zr0.15)1.05Mn1.2Cr0.6V0.1Cu0.1 grows. Ea values of the composites with 0, 5, 10, 30 wt% TiMn2 alloy for hydrogenation and dehydrogenation are 81.71, 67.52, 65.80, 60.99 kJ mol−1 and 124.75, 121.37, 116.68, 77.25 kJ mol−1, respectively. The ultrafine size of Mg and the catalytic effect of (Ti0.85Zr0.15)1.05Mn1.2Cr0.6V0.1Cu0.1 particles give rise to the improved hydrogen storage capacities and kinetics.Acknowledgements
The authors acknowledge the support of this work by the Joint Fund of the National Natural Science Foundation of China and Baosteel Group Corporation (No. U1560106), the Aeronautical Science Foundation of China (No. 2016ZF51050) and the Scientific Research Foundation for the Returned Overseas Chinese Scholars (State Education Ministry).References
- C. Weidenthaler and M. Felderhoff, Energy Environ. Sci., 2011, 4, 2495–2502 CAS.
- H. Y. Shao, T. Liu and X. G. Li, Nanotechnology, 2003, 14, L1–L3 CrossRef CAS.
- Y. P. Pang, Y. F. Liu, X. Zhang, Y. Li, M. X. Gao and H. G. Pan, RSC Adv., 2015, 5, 12144–12151 RSC.
- X. B. Xie, X. J. Ma, P. Liu, J. X. Shang, X. G. Li and T. Liu, ACS Appl. Mater. Interfaces, 2017, 9, 5937–5946 CAS.
- T. Liu, H. L. Shen, Y. Liu, L. Xie, J. L. Qu, H. Y. Shao and X. G. Li, J. Power Sources, 2013, 227, 86–93 CrossRef CAS.
- H. Emami, K. Edalati, A. Staykov, T. Hongo, H. Iwaoka, Z. Horita and E. Akiba, RSC Adv., 2016, 6, 11665–11674 RSC.
- L. Xie, J. Li, T. Zhang, L. Song and H. Kou, J. Power Sources, 2017, 338, 91–102 CrossRef CAS.
- T. Liu, Y. R. Cao, C. G. Qin, W. S. Chou and X. G. Li, J. Power Sources, 2014, 246, 277–282 CrossRef CAS.
- S. Milošević, S. Kurko, L. Pasquini, L. Matović, R. Vujasin and N. Novaković, J. Power Sources, 2016, 307, 481–488 CrossRef.
- N. Juahir, N. S. Mustafa, A. M. Sinin and M. Ismail, RSC Adv., 2015, 5, 60983–60989 RSC.
- G. Barkhordarian, T. Klassen and R. Bormann, Scr. Mater., 2003, 49, 213–217 CrossRef CAS.
- N. Hanada, T. Ichikawa, S. Hino and H. Fujii, J. Alloys Compd., 2006, 420, 46–49 CrossRef CAS.
- T. Kimura, H. Miyaoka, T. Ichikawa and Y. Kojima, Int. J. Hydrogen Energy, 2013, 38, 13728–13733 CrossRef CAS.
- T. Liu, C. G. Chen, C. G. Qin and X. G. Li, Int. J. Hydrogen Energy, 2014, 39, 18273–18279 CrossRef CAS.
- N. Mahmoudi, A. Kaflou and A. Simchi, J. Power Sources, 2011, 196, 4604–4608 CrossRef CAS.
- A. Zaluska, L. Zaluski and J. O. Strom-Olsen, J. Alloys Compd., 1999, 288, 217–225 CrossRef CAS.
- B. Zahiri, M. Danaie, X. H. Tan, B. S. Amirkhiz, G. A. Botton and D. Mitlin, J. Phys. Chem. C, 2012, 116, 3188–3199 CAS.
- Y. Q. Hu, C. Yan, H. F. Zhang, L. Ye and Z. Q. Hu, J. Alloys Compd., 2003, 354, 296–302 CrossRef CAS.
- X. Liu, Z. Huang, L. Jiang and S. Wang, Int. J. Hydrogen Energy, 2007, 32, 965–968 CrossRef CAS.
- E. Grigorova, M. Khristov, M. Khrussanova and P. Peshev, J. Mater. Sci., 2008, 43, 5336–5341 CrossRef CAS.
- B. H. Liu, D. M. Kim and K. Y. Lee, J. Alloys Compd., 1996, 240, 214–218 CrossRef CAS.
- H. Y. Shao, J. Matsuda, H. Y. Li, E. Akiba, A. Jain, T. Ichikawa and Y. Kojima, Int. J. Hydrogen Energy, 2013, 38, 7070–7076 CrossRef CAS.
- J. Lu, Y. J. Choi, Z. Z. Fang, H. Y. Sohn and E. Rönnebro, J. Am. Chem. Soc., 2010, 132, 6616–6617 CrossRef CAS PubMed.
- H. Y. Shao, G. B. Xin, J. Zheng, X. G. Li and E. Akiba, Nano Energy, 2012, 1.4, 590–601 CrossRef.
- R. W. P. Wagemans, J. H. Van Lenthe, P. E. De Jongh, A. J. Van Dillen and K. P. De Jong, J. Am. Chem. Soc., 2005, 127, 16675–16680 CrossRef CAS PubMed.
- P. E. Jongh and P. Adelhelm, ChemSusChem, 2010, 3, 1332–1348 CrossRef PubMed.
- K. J. Jeon, H. R. Moon, A. M. Ruminski, B. Jiang, C. Kisielowski, R. Bardhan and J. Urban, Nat. Mater., 2011, 10, 286–290 CrossRef CAS PubMed.
- K. F. Aguey-Zinsou and J. R. Ares-Fernández, Chem. Mater., 2008, 20, 376–378 CrossRef CAS.
- R. Bardhan, A. M. Ruminski, A. Brand and J. Urban, Energy Environ. Sci., 2011, 4, 4882–4895 CAS.
- T. Liu, C. G. Qin, T. W. Zhang, Y. R. Cao, M. Zhu and X. G. Li, J. Mater. Chem., 2012, 22, 19831–19838 RSC.
- T. Liu, C. G. Chen, H. Wang and Y. Wu, J. Phys. Chem. C, 2014, 118, 22419–22425 CAS.
- T. Liu, X. J. Ma, C. G. Chen, L. Xu and X. G. Li, J. Phys. Chem. C, 2015, 119, 14029–14037 CAS.
- M. Bortz, B. Bertheville, G. Bottger and K. Yvon, J. Alloys Compd., 1999, 287, 1–2 CrossRef.
- Y. Q. Hu, H. F. Zhang, A. M. Wang, B. Z. Ding and Z. Q. Hu, J. Alloys Compd., 2003, 354, 296–302 CrossRef CAS.
- M. Q. Fan, L. X. Sun and F. Xu, Trans. Nonferrous Met. Soc. China, 2010, 20, 1447–1451 CrossRef CAS.
- C. S. Zhou, Z. Z. Fang, C. Ren, J. Z. Li and J. Lu, J. Phys. Chem. C, 2013, 117, 12973–12980 CAS.
- T. R. Jensen, A. Andreasen, T. Vegge, J. W. Andreasen, K. Ståhl, A. S. Pedersen, M. M. Nielsen, A. M. Molenbroek and F. Besenbacher, Int. J. Hydrogen Energy, 2006, 31, 2052–2062 CrossRef CAS.
- T. He, Z. T. Xiong, G. T. Wu, H. L. Chu, C. Z. Wu, T. Zhang and P. Chen, Chem. Mater., 2009, 21, 2315–2318 CrossRef CAS.
- Y. J. Choi, J. W. Choi, H. Y. Sohn, T. Ryu, K. S. Hwang and Z. Z. Fang, Int. J. Hydrogen Energy, 2009, 34, 7700–7706 CrossRef CAS.
- J. F. Stampfer, C. E. Holley and J. F. Suttle, J. Am. Chem. Soc., 1960, 82, 3504–3508 CrossRef CAS.
Footnote |
| † Electronic supplementary information (ESI) available. See DOI: 10.1039/c7ra05461k |
| This journal is © The Royal Society of Chemistry 2017 |

