
 Open Access Article
 This Open Access Article is licensed under a Creative Commons Attribution-Non Commercial 3.0 Unported Licence
Rapid preparation of SnO2/C nanospheres by using organotin as building blocks and their application in lithium-ion batteries†
Liuqing Li,
Haiyan Zhang *,
Zhaopeng Li,
Weihao Zhong,
Haiyang Liao and
Zhenghui Li*
*,
Zhaopeng Li,
Weihao Zhong,
Haiyang Liao and
Zhenghui Li*
School of Materials and Energy, Guangdong University of Technology, Guangzhou 510006, China. E-mail: hyzhang@gdut.edu.cn; lizhengh@gdut.edu.cn
First published on 10th July 2017
Abstract
Constructing an electrode integrating ultralow SnO2 size, stable carbon barriers and well-developed pore structure are effective to address the issues of crack and pulverization for SnO2-based electrode during lithiation/delithiation process. But until now, it is still a challenge to exploit simple and robust method to fabricate ultrasmall SnO2 particles embedded in a carbon matrix. Herein, we develop a rapid strategy to prepare SnO2/C nanospheres using a simple Friedel–Crafts crosslinking of triphenyltin chloride for only 15 min and subsequent carbonization. The SnO2/C nanospheres (∼500 nm) have ultrasmall SnO2 particles of 4 nm, which were dispersed in carbon continuous phase. Moreover, the pyrolysis of the polymer during carbonization creates considerable micropores inside the carbon phase and leads to a surface area of 463.3 m2 g−1. When used as electrode materials in a lithium-ion battery, the ultrasmall SnO2 particles can prevent the cracking of the electrode, the carbon continuous phase can act as a buffer to protect SnO2 particles from aggregation, and micropores will supply expansive space for volume change. Thus, the SnO2/C nanosphere exhibits superior electrochemical performance, e.g., the first discharge and charge capacities can reach 1453 and 719 mA h g−1 respectively, and 120 cycles later, its capacity remains 629 mA h g−1, indicating a capacity retention of 87.4% (C120th/C2nd).
Introduction
With the development of electronic devices and electric vehicles, rechargeable lithium-ion batteries (LIBs) are playing a more and more important role in daily life because of their high energy densities and long cycle life.1 To meet people's increasing requirement of LIBs, extensive efforts have been made to search for novel anode materials with high capacity and outstanding cycle performance. Graphite is regarded as a classical anode material due to its specific layer-to-layer structure, but it is far from meeting the future need because of its low theoretical capacity of 372 mA h g−1.2 To address this issue, lots of studies have been carried out on Si-based materials,3 metal alloys,4 metal oxides5 and metal chalcogenides.6 As SnO2 possesses the advantages of low cost and high theoretical capacity of 790 mA h g−1, SnO2 based materials are deemed to be one of the most promising anode materials to LIBs.7 However, SnO2 suffers from the defect of huge volume change of 250% during the processes of lithiation and delithiation, leading to pulverization and rapid capacity fading in cycling.8Integrating ultralow SnO2 size, stable carbon barriers and well-developed pore structure in one electrode material is an effective way to overcome crack and pulverization of SnO2-based electrode. First, it was reported that nanosized SnO2 particles can mitigate the strain generated during discharge/charge process at a certain extent.9,10 Inspired by this phenomenon, a SnO2/C nanocomposite with 4.3 nm-sized SnO2 nanoparticles dispersed in carbon network was prepared by Wang's group via decomposition of Sn(OH)4 in polyacrylic acid hydrogel and subsequent carbonization. This SnO2/C displayed an initial discharge capacity of 1460 mA h g−1 and maintained a reversible capacity of 597.3 mA h g−1 at a current density of 100 mA g−1 after 200 cycles.11 Second, constructing stable carbon barrier has also been proved to be efficient way to improve electrochemical performance.12 For example, core–shell SnO2/C composite developed by Yang's group showed a stable capacity of 430 mA h g−1 after 100 cycles.13 It is believed that the carbon shell protects SnO2 particles from self aggregation and cracking during lithiation/delithiation process. Besides, porous structure can serve as the transport access of lithium ions and provide expansive space to accommodate the volume change of SnO2 particles, which is another frequently-used way to enhance the rate performance and cycle stability of SnO2-based electrode. Ko and coworkers developed porous SnO2/C nanocomposite by spray pyrolysis process, and the composite exhibited a reversible capacity of 509 mA h g−1 after 1000 discharge/charge cycles at a current density of 1.5 A g−1.14 These above-mentioned strategies have achieved great success in exploiting novel SnO2-based anode materials with high capacity and stable cycling performance. However these methods are based on inorganic Sn-containing salts with complicated preparation steps, and there are still few SnO2-based anode materials that incorporate ultralow SnO2 particle size (<10 nm), carbon matrix and porous structure, simultaneously.
In this paper, we elaborate a novel, facile and rapid method of preparing SnO2/C nanosphere with ultrasmall SnO2 particles simply by using a Friedel–Crafts crosslinking of triphenyltin chloride (Sn-Ph) in a short time of 15 min (Fig. 1). Crosslinking induced phase separation creates spherical crosslinked product with a diameter of ca. 600 nm, and Sn atoms are embedded in the nanospheres uniformly. During carbonization, the crosslinked polymer converts into carbon framework, meanwhile, Sn atoms aggregate in situ and result in the generation of 4 nm-sized SnO2 particles. In addition, pyrolyzation of polymer creates considerable micropores inside the carbon continuous phase and SnO2/C nanospheres present a surface area of 463.3 m2 g−1. When the SnO2/C nanospheres are applied in lithium-ion batteries, it exhibits four advantages: (i) an average diameter of ∼500 nm can shorten the transport distance of lithium ions, (ii) ultralow size of SnO2 particles can prevent the crack of electrode, (iii) carbon matrix will act as buffer to protect SnO2 particles from aggregation and mitigate the absolute strain induced by large volume change during lithiation/delithiation process, (iv) porous structure provides pathways of lithium-ion transport and supplies nanospace for volume change of SnO2 particles to prevent cracking. Owning to these unique structure features, SnO2/C nanospheres present high initial discharge and charge capacities of 1453 and 719 mA h g−1 respectively. 120 cycles later, the capacity remains 629 mA h g−1, demonstrating a high capacity retention rate of 87.4% (C120th/C2nd). Furthermore, the simple and rapid process of preparation, and low cost of raw materials make it easy to realize large-scale production while put the method into application.
 | ||
| Fig. 1 Schematic figure of the preparation process for SnO2/C nanospheres. | ||
Experimental
Preparation of SnO2/C nanospheres
The SnO2/C nanospheres were prepared using a method of organic crosslinking. At first, 2 g triphenyltin chloride and 4 g anhydrous AlCl3 were dissolved in 80 mL 1,2-dichloroethane at 60 °C for several minutes, and then 4 mL dimethoxymethane was transferred into the liquor. 15 minutes later, the product was filtered off and washed with deionized water and ethanol for four times. After drying in vacuum at 80 °C for 8 h, crosslinked triphenyltin chloride was collected. To obtain SnO2/C nanospheres, crosslinked triphenyltin chloride was carbonized at 600 °C for 1 h with a heating rate of 2 °C min−1 under the atmosphere of nitrogen.Material measurements
XRD patterns were gained from a powder X-ray diffraction system (XRD, D/MAX-UItima IV, Rigaku Corporation, Japan). Thermal behavior of the composites was investigated by thermo-gravimetric analysis (TGA, Q50, TA Instruments Ltd, USA) in air from 100 to 800 °C. Micro-morphologies were observed by the scanning electron microscopy (SEM, SU8010, Hitachi, Japan) and transmission electron microscopy (TEM, JEM 2100F, Japan). Porosity test was performed on Nitrogen adsorption–desorption porosity measurement machine (ASAP 2460, Micromeritics, USA). Fourier Transform reflection-infrared spectra were measured using a Nicolet 6700 FTIR spectroscopy (Nicolet, USA).Electrochemical characterization
The electrochemical performances of SnO2/C nanospheres were tested by a coin-type cell (CR 2032). Working electrode was fabricated by pasting a mixture of SnO2/C nanosphere (84 wt%), super P (10 wt%), sodium carboxymethyl cellulose (CMC) (3 wt%) and styrene-butadiene rubber emulsion (SBR) (3 wt%) on copper foil and then dried in vacuum at 80 °C for 24 h. Coin cells were assembled in an argon-filled glove box, taking polypropylene microporous film (Celgard 2400) as separator and lithium foil as the counter electrode.Galvanostatic charge/discharge property was measured on LAND CT 2001A batteries measuring system (CT2001A, Wuhan LAND Corporation, China) with a voltage window from 0.01 to 3.0 V at room temperature. The cyclic voltammograms (CV) data of the material was tested on electrochemical workstation (CHI660E, Shanghai Chenhua, China) at a scan rate of 0.2 mV s−1 from 0.01 to 3 V.
Results and discussion
Generally, SnO2 nanoparticles were prepared by hydrolysis, condensation process of SnCl4 or SnCl2. But the hydrolysis process of SnCl4/SnCl2 is hard to control because of the high reaction speed. In this paper, for the first time, we used an organic precursor, i.e., Sn-Ph, to prepare SnO2/C nanospheres. Normally, Sn-Ph boils and decomposes during heat-treatment process, which makes it hard to synthesize SnO2/C composites. To conquer this question, Friedel–Crafts reaction was adopted to immobile Sn-Ph and dimethoxymethane was chosen as the crosslinker (the obtained product was denoted as xSn-Ph).15 The Friedel–Crafts crosslinking mechanism is described in Fig. S1,† in which methylene (–CH2–) was generated between phenyl rings of Sn-Ph owing to the replacement of hydrogen. FT-IR was measured to confirm the crosslinking (Fig. 2). The absorption peak of methylene (∼2800 cm−1) appeared and the absorption peak of C–H in phenyl (∼3100 cm−1) disappeared after crosslinking, demonstrating the successful crosslinking between Sn-Ph and dimethoxymethane.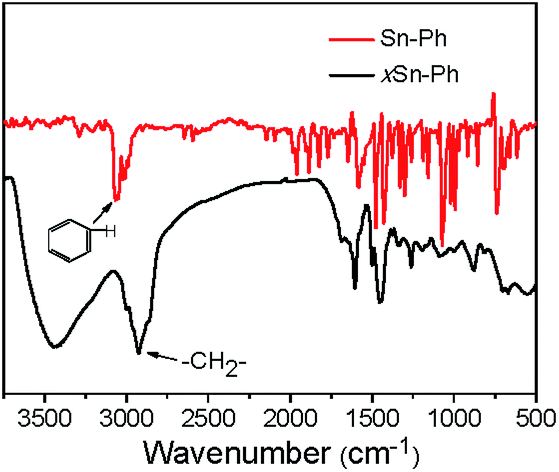 | ||
| Fig. 2 FT-IR spectra of Sn-Ph and xSn-Ph. | ||
Owing to crosslinked-induced phase separation, xSn-Ph presents spherical morphology with an average diameter of 600 nm (Fig. 3a). It is not difficult to imagine that Sn atoms would be wrapped during crosslinking and dispersed in the polymer network. Judging from the TEM images, the Sn atoms are distributed in molecular scale with no aggregations (Fig. 3b and c). Accordingly, the XRD pattern of xSn-Ph shows no diffraction peaks, indication of no crystals (Fig. 4a). To obtain SnO2/C nanospheres, xSn-Ph was carbonized at 600 °C for 1 h with a heating rate of 2 °C min−1 under the atmosphere of N2 (denoted as SnO2/C-2-600-1). Because of rigid polymer network from highly crosslinked density, nanospherical shape was maintained integrally after carbonization (Fig. 3d). Meanwhile, owing to the pyrolyzation of polymer precursor, the diameter of SnO2/C-2-600-1 was reduced to ca. 500 nm slightly (Fig. 3d). Fig. 3e presents the TEM image of SnO2/C-2-600-1, it is unexpected that many ultrasmall SnO2 particles are embedded in amorphous carbon matrix uniformly, without any big aggregations (Fig. 3f). According to the high-resolution TEM image, the diameter of such SnO2 particles is ca. 4 nm, which is lower than most of current SnO2 nanomaterials.16 It is believed that rigid xSn-Ph network is significant for the formation of ultrasmall SnO2 particles, that is, highly crosslinked framework is strong enough to keep away from melt and soften, which acts like barrier to prevent SnO2 from agglomeration.
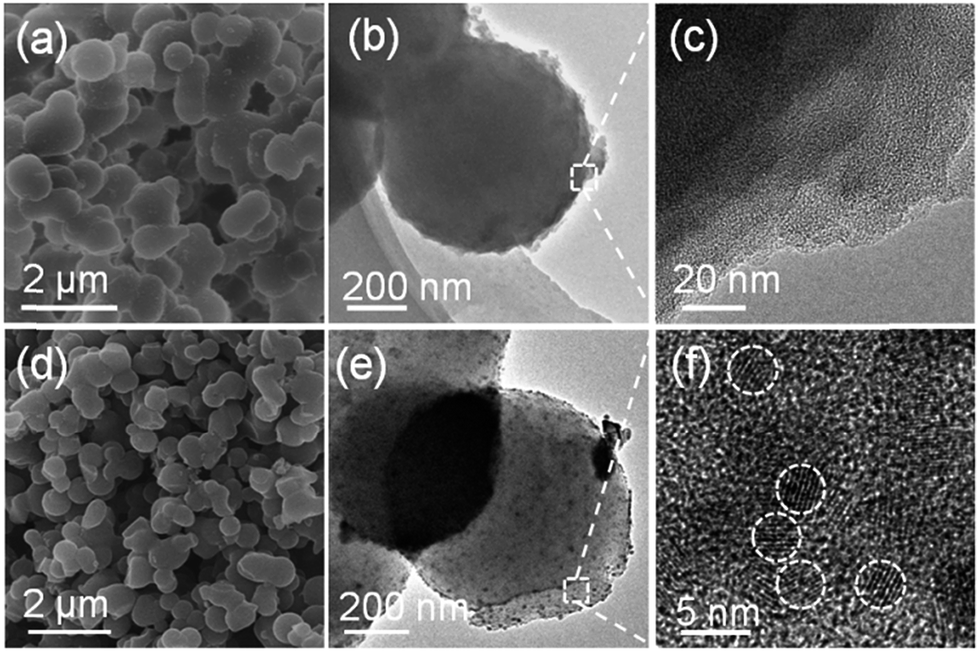 | ||
| Fig. 3 (a) SEM, (b) TEM and (c) high-resolution TEM images of xSn-Ph. (d) SEM, (e) TEM and (f) high-resolution TEM images of SnO2/C-2-600-1. | ||
 | ||
| Fig. 4 (a) XRD patterns of xSn-Ph, SnO2/C-2-600-1 and commercial nano-SnO2. (b) TGA curve of SnO2/C-2-600-1. (c) N2 adsorption–desorption isotherm and (d) pore size distribution of SnO2/C-2-600-1. | ||
To confirm the crystal structure of SnO2/C-2-600-1, XRD pattern is given (Fig. 4a). The wide peaks at 26.6, 33.8 and 51.8° can be ascribed to the crystal planes (110), (101) and (211) of SnO2 (JCPDS file no. 41-1445), further confirming ultrasmall SnO2 particles embedded in carbon continues phase after carbonization. The SnO2 content was estimated by thermo-gravimetric analysis (TGA) under air, in which process the carbon component would burn off completely. As shown in Fig. 4b, the SnO2 percentage of SnO2/C-2-600-1 was tested to be 20%.
Pore structure of SnO2 nanospheres was measured by N2 adsorption method. The adsorption amount shows a rapid step at low relative pressure (Fig. 4c), demonstrating the generation of abundant of micropores owing to the pyrolysis of polymer network. Moreover, the coincidence of adsorption and desorption branches and no dramatic increase at P/Po = 1.0 certified nearly no mesopores and macropores in SnO2/C-2-600-1. According to the DFT (density functional theory) pore size distribution (Fig. 4d), the micropore size is around 0.7 nm. Due to the well-developed pore structure, the SnO2/C-2-600-1 nanospheres present a specific surface area of 463.3 m2 g−1.
We further find that pyrolysis temperature, holding time and heating rate of carbonization play significant roles in determining the size and content of SnO2 in the composites. Primarily, to study the impact of temperature, xSn-Ph was carbonized at 700 (SnO2/C-2-700-1), 800 (SnO2/C-2-800-1) and 900 °C (SnO2/C-2-900-1) for 1 h with a heating rate of 2 °C min−1. It is found that the diffraction peaks of SnO2 crystal become sharper with increasing the pyrolysis temperature, indication of a size growth of SnO2 nanoparticles (Fig. 5a). Obviously, higher pyrolysis temperature accelerates the aggregation of Sn atoms and leads to the generation of larger nanoparticles. This size growth process also can be observed in TEM images, in which SnO2/C-2-800-1 and SnO2/C-2-900-1 have larger SnO2 nanoparticles than SnO2/C-2-700-1 (Fig. 6). To further confirm the results, we statisticed the average diameter of SnO2 nanoparticles according to the TEM images (Fig. S5†). It can be found that SnO2/C-2-700-1 has a lowest SnO2 diameter of ca. 7 nm, and SnO2/C-2-800-1 has larger SnO2 nanoparticles with an average diameter of ca. 13 nm. Accordingly, when pyrolysis temperature is elevated to 900 °C, SnO2/C-2-900-1 has a highest SnO2 diameter of ca. 16 nm. Unexpectedly, diffraction peaks of Sn element appear at 30.6, 32.0 and 44.9° when the pyrolysis temperature is 900 °C (JCPDS file no. 04-673), illustrating the carbothermal reduction of SnO2. Content of SnO2/Sn was measured via TGA (Fig. 5b). The contents of SnO2 are around 20% when the pyrolysis temperature was varied from 600 to 800 °C. But it drops to 15.5% at 900 °C, which can be ascribed to the volatilization of Sn (melting point: 232 °C). Besides, the specific surface area rises from 463.3, 511.6, 763.9 to 966.7 m2 g−1 along with the increase of carbonization temperature (Fig. 4c and S2–S4†).
 | ||
| Fig. 5 (a) XRD patterns and (b) TGA curves of SnO2/C-2-700-1, SnO2/C-2-800-1 and SnO2/C-2-900-1. | ||
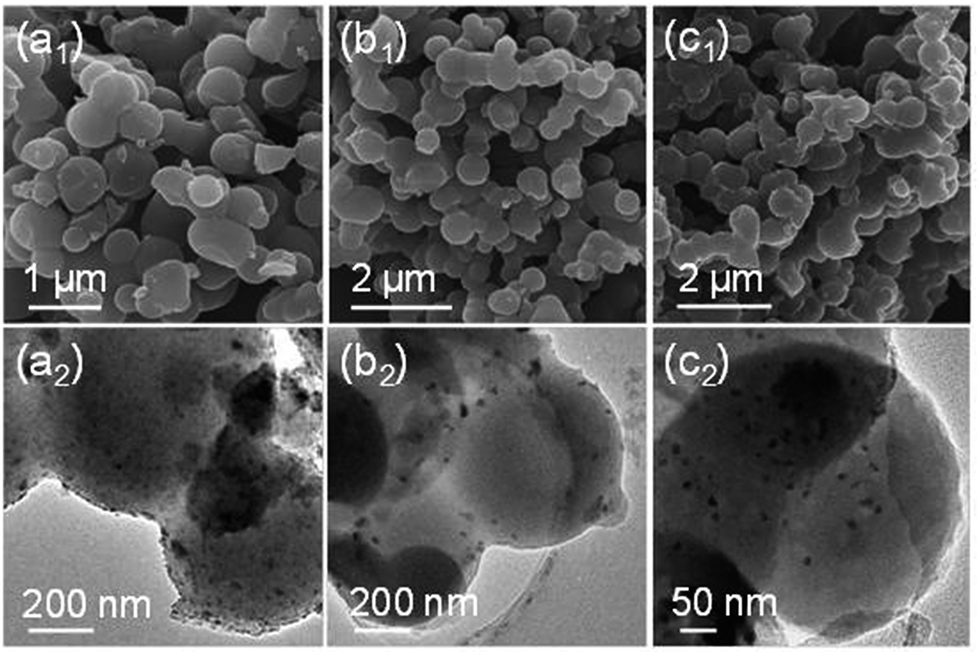 | ||
| Fig. 6 SEM and TEM images of (a) SnO2/C-2-700-1, (b) SnO2/C-2-800-1, (c) SnO2/C-2-900-1. | ||
Furthermore, heating rate and holding time of carbonization have been studied as well. As the holding time was extended, XRD patterns of obtained samples were sharpening, i.e., the SnO2 size increased (Fig. S6a†). Similarly, the acceleration of the heating rate results in a distinct increase of SnO2 size and faster reduction of SnO2 crystal, which can be ascribed to that the aggregation of Sn atoms was intensified with the increasing of heating rate (Fig. S6b†).
The SnO2/C nanospheres have unique nanostructure integrating ultrasmall SnO2 particles, continuous carbon buffer and microporous structure, which motivate us to further investigate its electrochemical performance. Fig. 7 displays the cyclic voltammogram of SnO2/C-2-600-1 electrode at a scan rate of 0.2 mV s−1 from 0.01 to 3 V. The peak from 0.1 to 0.6 V of the first cathodic sweep indicates the formation of solid electrolyte interphase (SEI), irreversible reduction of SnO2 to Sn and formation LixSn alloy, associating with loss of capacity during first cycle.17 In the anodic sweep, the peak at 0.6 V can be ascribed to the dealloying reaction of LixSn alloy to Sn, which is consistent with the curves of commercial nano-SnO2 (Fig. S7†). All peaks except the first cycle are reproducible and stabile, implying superior cycling stability of the SnO2/C nanospheres electrode.
 | ||
| Fig. 7 Cyclic voltammograms of the initial 3 cycles scanned between 0.01 and 3 V at 0.2 mV s−1 of SnO2/C-2-600-1. | ||
Fig. 8a shows the 1st, 2nd and 60th voltage profiles of SnO2/C-2-600-1 between 0.01 to 3 V at a current density of 200 mA g−1. In discharge curves, the slopes at 0.6 V and between 0.5 and 0 V can be associated with the reduction of SnO2 to metallic Sn and formation of LixSn alloy. In charge curves, the platform from 0.3 to 0.8 can be associated with the delithiation of LixSn, which are consistent with the CV results. The first discharge and charge show specific capacities of 1453 and 719 mA h g−1 respectively. The capacity loss can be attributed to the formation of SEI and irreversible insertion of lithium-ion in porous carbon. Except first discharge curve, the almost overlapped initial cycle curves demonstrate good cycling stability of the composites.
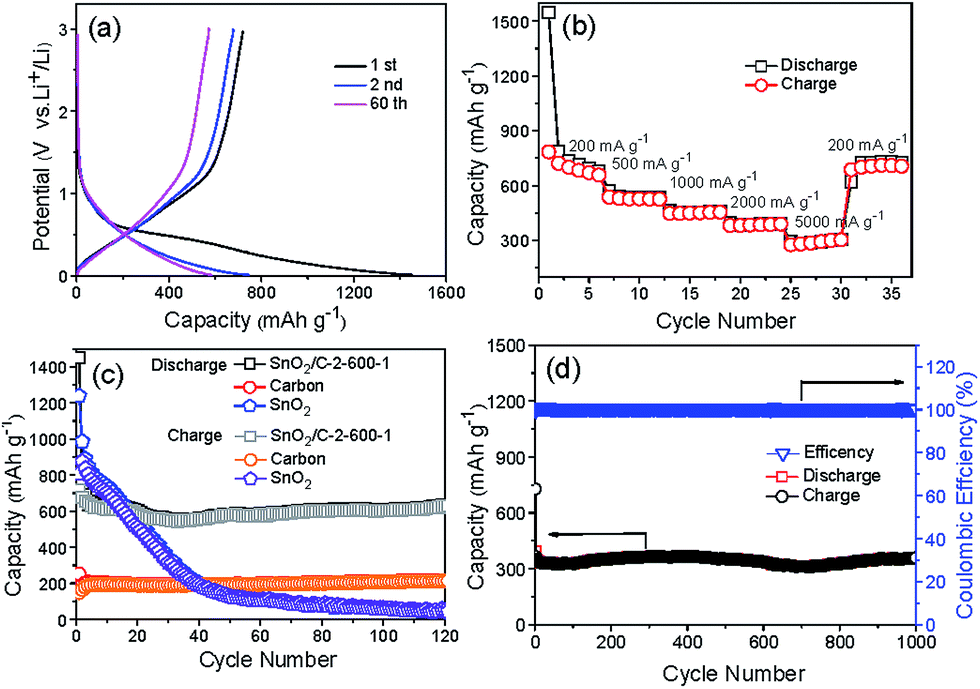 | ||
| Fig. 8 (a) Galvanostatic charge/discharge curves of SnO2/C-2-600-1 at the current density of 200 mA g−1. (b) Rate performance of SnO2/C-2-600-1. (c) Cycling performance of SnO2/C-2-600-1, carbon and commercial nano-SnO2 at the current density of 200 mA g−1. (d) Cycling performance of SnO2/C-2-600-1 at the current density of 1 A g−1. | ||
SnO2/C-2-600-1 also shows remarkable rate performance. Fig. 8b illustrates the reversible capacities of SnO2/C-2-600-1 electrode testing at the current densities of 200, 500, 1000, 2000 and 5000 mA g−1 respectively. Thirty-six cycles of testing at different current densities later, the capacity returns to 705 mA h g−1 at 200 mA g−1, explaining the tolerance of SnO2/C-2-600-1 at high current charge and discharge. Fig. 8c displays the cycle performance of SnO2/C-2-600-1 at the current density of 200 mA g−1 between 0.01 and 3.0 V. For comparison, naked nano-SnO2 and pure carbon were chosen as control samples (Fig. S8†). It can be observed that commercial nano-SnO2 shows high discharge and charge capacities of 1239 and 809 mA h g−1 respectively, but its capacity decreases seriously to 47 mA h g−1 after 120 cycles. Carbon exhibits a stable capacity of 213 mA h g−1 near to the theoretical capacity of graphite (372 mA h g−1). On contrast, SnO2/C-2-600-1 presents a high and stable capacity of 629 mA h g−1 for 120 cycles later, which is 3 and 13 times of the capacity of carbon and commercial nano-SnO2, respectively. Accordingly, capacity retention of SnO2/C-2-600-1 is as high as 87.4% (C120th/C2nd), which is much higher than that of SnO2 (5%). As shown in Fig. 8d, SnO2/C-2-600-1 composite presents a capacity of 360 mA h g−1 even after 1000 cycles at the current density of 1 A g−1, implying an outstanding long-term cycling capability. This result is also superior to many SnO2/C composites reported previously,10,11,18 and comparable to SnO2/CNT19 and SnO2/graphene nanocomposite (Table S1†).20 Moreover, SnO2/C composites pyrolysized at 700 (SnO2/C-2-700-1) and 800 °C (SnO2/C-2-800-1) with a heating rate of 2 °C min−1 are studied for electrochemical testing (Fig. S9†), in order to confirm the structural advantages of ultrasmall SnO2 particles. It can be observed that the capacities of SnO2/C-2-700-1 and SnO2/C-2-800-1 decline at first 30 cycles followed by stable plateaus. After cycling for 120 times, SnO2/C-2-700-1 remains a stable capacity of 448.1 mA h g−1, which is inferior to that of SnO2/C-2-600-1. In addition, SnO2/C-2-800-1 with largest SnO2 nanoparticle has lower stable capacity of 379.4 mA h g−1. Due to the rising of holding temperature, Sn atoms form bigger SnO2 particles, leading rapider capacity fading during the cycling process.
The superior performance of SnO2/C nanosphere should be attributed to three aspects: (i) ultrasmall SnO2 nanoparticle dispersed in porous carbon could reduce aggregation and strain caused by volume change during discharge/charge process, (ii) porous carbon structure would provide nanospace to mitigate the volume change of SnO2 nanoparticles to prevent cracking and pulverization, (iii) micropores could enlarge the accessible surface area to electrolyte and favor the diffusion of lithium ions.
Conclusion
In conclusion, SnO2/C nanospheres with ultrasmall SnO2 particles have been prepared by facile and rapid Friedel–Crafts crosslinking. Benefiting from the ultralow size of SnO2 nanoparticles (∼4 nm) and porous carbon buffer, the as-prepared sample presents a superior electrochemical performance, including high first discharge and charge capacity of 1453 and 719 mA h g−1 respectively, and high capacity remaining of 629 mA h g−1 after 120 cycles at the current density of 200 mA g−1. What's more, rapid synthesis and low cost make this method easier to be put into application and realize large scale production.Acknowledgements
This work is supported by National Natural Science Foundation of China (U1401246, 51502042), Science and Technology Program of Guangdong Province of China (2014B010106005, 2015B010135011), the Science and Technology Program of Guangzhou City of China (201508030018) and Postdoctoral Science Foundation of China (2015M572278, 2016T90770).References
- (a) M. Armand and J.-M. Tarascon, Nature, 2008, 451, 652–657 CrossRef CAS PubMed; (b) S. Xin, Y.-G. Guo and L.-J. Wan, Acc. Chem. Res., 2012, 45, 1759–1769 CrossRef CAS PubMed; (c) L. Zou, L. Gan, F. Kang, M. Wang, W. Shen and Z. Huang, J. Power Sources, 2010, 195, 1216–1220 CrossRef CAS; (d) Z. Li, Z. Li, W. Zhong, C. Li, L. Li and H. Zhang, Chem. Eng. J., 2017, 319, 1–8 CrossRef CAS.
- (a) G. Li, H. Yang, F. Li, J. Du, W. Shi and P. Cheng, J. Mater. Chem. A, 2016, 4, 9593–9599 RSC; (b) J. R. Dahn, T. Zheng, Y. Liu and J. Xue, Science, 1995, 270, 590 CAS; (c) M.-H. Park, M. G. Kim, J. Joo, K. Kim, J. Kim, S. Ahn, Y. Cui and J. Cho, Nano Lett., 2009, 9, 3844–3847 CrossRef CAS PubMed.
- (a) H. Zhang, X. Qin, J. Wang, Y. He, H. Du, B. Li and F. Kang, J. Mater. Chem. A, 2015, 3, 7112–7120 RSC; (b) Z. Luo, Q. Xiao, G. Lei, Z. Li and C. Tang, Carbon, 2016, 98, 373–380 CrossRef CAS; (c) M. A. Rahman, G. Song, A. I. Bhatt, Y. C. Wong and C. Wen, Adv. Funct. Mater., 2016, 26, 647–678 CrossRef CAS; (d) J. Wang, T. Xu, X. Huang, H. Li and T. Ma, RSC Adv., 2016, 6, 87778–87790 RSC.
- (a) F. F. Cao, S. Xin, Y. G. Guo and L. J. Wan, Phys. Chem. Chem. Phys., 2011, 13, 2014–2020 RSC; (b) G. Ferrara, C. Arbizzani, L. Damen, M. Guidotti, M. Lazzari, F. G. Vergottini, R. Inguanta, S. Piazza, C. Sunseri and M. Mastragostino, J. Power Sources, 2012, 211, 103–107 CrossRef CAS; (c) Y. Li, L. Huang, P. Zhang, X. Ren and L. Deng, Nanoscale Res. Lett., 2015, 10, 414 CrossRef PubMed; (d) I. Tetsu, O. Shinya, K. Tomoya, K. Yu, O. Fumiyasu, Y. Shunsuke, G. Natsumi, D. Takayuki and M. Eiichiro, J. Mater. Chem. A, 2015, 3, 10188–10194 RSC.
- (a) C. D. Gu, Y. J. Mai, J. P. Zhou, Y. H. You and J. P. Tu, J. Power Sources, 2012, 214, 200–207 CrossRef CAS; (b) F. Cao, X. Wu, S. Xin, Y. Guo and L. Wang, J. Phys. Chem. C, 2010, 114, 10308–10313 CrossRef CAS; (c) Z. Yang, G. Du, Q. Meng, Z. Guo, X. Yu, Z. Chen, T. Guo and R. Zeng, J. Mater. Chem., 2012, 22, 5848 RSC; (d) C. D. Gu, Y. J. Mai, J. P. Zhou and J. P. Tu, Funct. Mater. Lett., 2011, 4, 377 CrossRef.
- (a) C. Zhang, H. B. Wu, Z. Guo and X. W. Lou, Electrochem. Commun., 2012, 20, 7–10 CrossRef CAS; (b) S. Yu, J. W. Jung and I. D. Kim, Nanoscale, 2015, 7, 11945–11950 RSC; (c) D. H. Youn, C. Jo, J. Y. Kim, J. Lee and J. S. Lee, J. Power Sources, 2015, 295, 228–234 CrossRef CAS; (d) Y. Han, Y. Wang, W. Gao, Y. Wang, L. Jiao, H. Yuan and S. Liu, Powder Technol., 2011, 212, 64–68 CrossRef CAS.
- (a) F. Li, J. Du, H. Yang, W. Shi and P. Cheng, RSC Adv., 2017, 7, 20062–20067 RSC; (b) C. Gu, H. Zhang, X. Wang and J. Tu, Mater. Res. Bull., 2013, 48, 4112–4117 CrossRef CAS.
- (a) J. M. Tarascon and M. Armand, Nature, 2001, 414, 359–367 CrossRef CAS PubMed; (b) D. Larcher, S. Beattie, M. Morcrette, K. Edström, J.-C. Jumas and J.-M. Tarascon, J. Mater. Chem., 2007, 17, 3759 RSC.
- (a) F. M. Courtel, E. A. Baranova, Y. Abu-Lebdeh and I. J. Davidson, J. Power Sources, 2010, 195, 2355–2361 CrossRef CAS; (b) M. Gao, X. Chen, H. Pan, L. Xiang, F. Wu and Y. Liu, Electrochim. Acta, 2010, 55, 9067–9074 CrossRef CAS; (c) Q. Tian, Y. Tian, Z. Zhang, L. Yang and S.-i. Hirano, J. Power Sources, 2014, 269, 479–485 CrossRef CAS.
- H. Xue, J. Zhao, J. Tang, H. Gong, P. He, H. Zhou, Y. Yamauchi and J. He, Chem.–Eur. J., 2016, 22, 4915–4923 CrossRef CAS PubMed.
- F. Wang, H. Jiao, E. He, S. Yang, Y. Chen, M. Zhao and X. Song, J. Power Sources, 2016, 326, 78–83 CrossRef CAS.
- (a) X. W. Guo, X. P. Fang, Y. Sun, L. Y. Shen, Z. X. Wang and L. Q. Chen, J. Power Sources, 2013, 226, 75–81 CrossRef CAS; (b) X. W. Lou, C. M. Li and L. A. Archer, Adv. Mater., 2009, 21, 2536–2539 CrossRef CAS; (c) R. S. Kalubarme, J. Y. Lee and C. J. Park, ACS Appl. Mater. Interfaces, 2015, 7, 17226–17237 CrossRef CAS PubMed; (d) X. Li, Y. Zhang, H. Zhang, Y. Feng and Y. Wang, Electrochim. Acta, 2016, 195, 208–215 CrossRef CAS.
- R. Yang, W. Zhao, J. Zheng, X. Z. Zhang and X. G. Li, J. Phys. Chem. C, 2010, 114, 20272–20276 CAS.
- Y. N. Ko, S. B. Park and Y. C. Kang, Small, 2014, 10, 3240–3245 CrossRef CAS PubMed.
- (a) Z. Li, D. Wu, Y. Liang, R. Fu and K. Matyjaszewski, J. Am. Chem. Soc., 2014, 136, 4805–4808 CrossRef CAS PubMed; (b) Z. Li, L. Li, Z. Li, H. Liao and H. Zhang, Electrochim. Acta, 2016, 222, 990–998 CrossRef CAS.
- (a) H.-Q. Wang, G.-H. Yang, Y.-G. Huang, X.-H. Zhang, Z.-X. Yan and Q.-Y. Li, Mater. Chem. Phys., 2015, 167, 303–308 CrossRef CAS; (b) L. Xia, S. Wang, G. Liu, L. Ding, D. Li, H. Wang and S. Qiao, Small, 2016, 12, 853–859 CrossRef CAS PubMed.
- (a) J. S. Cho, H. S. Ju and Y. C. Kang, Sci. Rep., 2016, 6, 23915 CrossRef CAS PubMed; (b) L. Zhang, K. Zhao, W. Xu, Y. Dong, R. Xia, F. Liu, L. He, Q. Wei, M. Yan and L. Mai, Phys. Chem. Chem. Phys., 2015, 17, 7619–7623 RSC; (c) R. Liu, D. Li, C. Wang, N. Li, Q. Li, X. Lü, J. S. Spendelow and G. Wu, Nano Energy, 2014, 6, 73–81 CrossRef CAS.
- (a) M. Ara, V. R. Chitturi, S. O. Salley and K. Y. S. Ng, Electrochim. Acta, 2015, 161, 269–278 CrossRef CAS; (b) M. Wang, S. Li, Y. Zhang and J. Huang, Chem, 2015, 21, 16195–16202 CrossRef CAS PubMed.
- G. Du, C. Zhong, P. Zhang, Z. Guo, Z. Chen and H. Liu, Electrochim. Acta, 2010, 55, 2582–2586 CrossRef CAS.
- (a) X. Li, X. Zhang, Y. Zhao, D. Feng, Z. Su and Y. Zhang, Electrochim. Acta, 2016, 191, 215–222 CrossRef CAS; (b) C. Zhang, X. Peng, Z. Guo, C. Cai, Z. Chen, D. Wexler, S. Li and H. Liu, Carbon, 2012, 50, 1897–1903 CrossRef CAS.
Footnote |
| † Electronic supplementary information (ESI) available. See DOI: 10.1039/c7ra05445a |
| This journal is © The Royal Society of Chemistry 2017 |