 Open Access Article
Creative Commons Attribution 3.0 Unported Licence
Temperature-dependent optical phonon behaviour of a spinel Zn2TiO4 single crystal grown by the optical floating zone method in argon atmosphere
Liang Lia,
Shuohui Gaoc,
Tian Cui a,
Benxian Lib,
Qiang Zhoua,
Hongming Yuanb and
Dapeng Xu
 *a
*a
aState Key Laboratory of Superhard Materials, College of Physics, Jilin University, Changchun 130000, P. R. China. E-mail: xudp@jlu.edu.cn
bState Key Laboratory of Inorganic Synthesis and Preparative Chemistry, Jilin University, Changchun, 130000, P. R. China
cChina-Japan Union Hospital of Jilin University, Changchun, 130000, P. R. China
First published on 14th July 2017
Abstract
The spinel Zn2TiO4 single crystals were grown via optical floating zone technology in an argon atmosphere for the first time, the as-grown crystals were dark blue and transparent. And the as-grown crystals, free of bubbles and with low angle grain boundary, grow along the a-axis direction. The annealed crystals were colorless and transparent, and the chemical valence of as-grown and annealed single crystals was characterized by X-ray photoelectron spectra. The room-temperature polarized Raman spectra of spinel Zn2TiO4 crystal were presented and the in situ temperature-dependent Raman spectra of the crystals were also described. DSC results of Zn2TiO4 were also discussed.
1. Introduction
Spinel structured materials, including normal (AB2O4) and inverse (A2BO4) spinels, have attracted increased research attention because of their utility in high-temperature ceramics,1,2 magnetism,3,4 superhard materials,5 and pressure sensors.6,7 Zinc titanate (Zn2TiO4) with an inverse spinel structure has outstanding dielectric properties.8,9 Thus, the materials are widely applied in microwave devices.10 Zinc titanate is a regenerable high-effect catalyst sorbent for contaminants obtained from hot coal gases, such as H2S, As, and Se.11–13 Many studies on the optical, photoelectrochemical, and electrical properties of Zn2TiO4 under various conditions have been reported.14–17The potential uses of Zn2TiO4 in optical, microwave dielectric, and catalyst applications strongly depend on the optical phonon behaviour of the crystals, which can be determined by intrinsic contributions of their phonon modes together with possible extrinsic contributions of polarizable domains, grain boundaries, polar defects, and/or space charges.10 However, studies on the properties of Zn2TiO4 focus mainly on polycrystalline samples. Several extrinsic factors, including the different preparation methods, differences in grain size, and degree of phase purity, can seriously affect the properties of Zn2TiO4. Single-crystal samples with well-crystallized orientations can help eliminate extrinsic defects and provide a better understanding of the intrinsic characteristics of these materials.
The Raman is an available and non-destructive spectral measurement method providing many invaluable information on the lattice dynamics and order-disorder of materials.18 The spectra of vibration modes in various wavenumbers are excellent in materials investigations.19,20 At the same time, pressure-induced phase transformation in spinel Zn2TiO4 has previously been reported.21
The quality of grown crystal, grown by optical floating zone method, is effected by growth speed, rotating rate and growth atmosphere. The effects of growth speed and rotating rate have been investigated and high quality crystals have been obtained by optimize the growth speed and rotating rate in an oxygen atmosphere.22 On the other hands, the growth atmosphere is a very important parameter, which can influence the crystal quality and chemical valence of some elements in materials. In current work, we try to grow Zn2TiO4 crystals under argon atmosphere by the optical floating zone method for the first time. Beside, aiming to determine opportunities for applying Zn2TiO4 materials at various temperatures, the temperature-dependent Raman spectra of Zn2TiO4 crystals are described in this work for the first time. The temperature-dependent Raman shifts and full width at half maximum (FWHM) of Zn2TiO4 were studied, and shows an anomalous temperature-dependent behaviour below 273 K.
2. Experimental section
The Zn2TiO4 powders were synthesised by calcining stoichiometric amounts of ZnO (Alfa Aesar, 4N) and TiO2 (Alfa Aesar, 4N) at 1500 K for 20 h with an intermediate grinding. The Zn2TiO4 powders were packed into a cylindrical shape rubber tube and then pressed hydrostatically upto 70 MPa in a cold isostatic press to form a cylindrical rod of 4–6 mm in diameter and 50–100 mm in length. The rods were sintered in air at 1600 K for 10 h for use as the feed and support rods.The Zn2TiO4 single crystals were grown in the optical floating zone furnace (CSI FZ-T-10000-H-VI-VP, Crystal systems, Inc., Japan) under an argon atmosphere. A crystal seed, grown in previous work,22 a-axis direction was used in this work. The growth speed was 10 mm h−1; the argon flow of 100 sccm; the feeding and seeding rods were rotated in opposite directions at the rate of 5 rpm.
The crystal structure was characterized with a Rigaku D/max-r A 12 kW X-ray diffractometer (XRD) with Cu Kα radiation. The X-ray photoelectron spectra (XPS) were taken on an ESCALAB 250 electron energy spectrometer with Mg Ka (12![[thin space (1/6-em)]](https://www.rsc.org/images/entities/char_2009.gif) 530.6 eV) as the X-ray excitation source. Macroscopic defects such as low-angle grain boundaries and inclusions were studied with an Olympus Model BX-51 polarizing microscope in transmission configuration. To determine the directions of the as-prepared crystals, a Bruker D8 Discover AXS equipped with a GADDS two-dimensional X-ray diffractometer (XRD2) was used.
530.6 eV) as the X-ray excitation source. Macroscopic defects such as low-angle grain boundaries and inclusions were studied with an Olympus Model BX-51 polarizing microscope in transmission configuration. To determine the directions of the as-prepared crystals, a Bruker D8 Discover AXS equipped with a GADDS two-dimensional X-ray diffractometer (XRD2) was used.
The Raman scattering spectra were recorded by using a Jobin-Yvon LABRAM-HR 800 spectrometer equipped with an air-cooled CCD detector and a confocal Olympus microscope (50× objective). The measurements were carried out in backscattering geometry, using the 514.5 nm line of an Ar ion laser with power of 40 mW (Spectra Physics Stabilite 2017) as excitation source. Edge filter for stray light rejection, polarizer, and half-wave plate were also used. In-site temperature Raman spectra measurements were achieved via a THMSE 600 heating/cooling stage (Linkam Scientific Instruments) attached to the Raman spectrometer in the temperature range from 107 K to 817 K.
The Differential scanning calorimetry (DSC) measurements were performed using a DSC 204F1 Netzsch calorimeter, with a heating rate of 10 K min−1. The sample was placed in an aluminum capsule which was sealed filled with argon and pierced once inside the DSC apparatus.
3. Results and discussion
The Zn2TiO4 crystals grown previously in air conduction is brown and transparent by our group.22 In this work, the crystals grown in the argon atmosphere are dark blue and transparent, as shown in Fig. 2a. After annealed in an oxygen atmosphere at 1200 K for 10 h, the blue color fades to colorless and transparent, also shown in Fig. 2b. The powder XRD pattern of the as-grown crystal is shown in Fig. 1a. All the peaks can be indexed to the diffraction peaks of the Zn2TiO4 spinel (Ref: ICSD code: 080851), indicating that the as-grown crystal is spinel Zn2TiO4 without any other phase. The powder XRD pattern of the annealed crystal was also measured; its peak positions and relative intensity are unchanged, indicating that the annealing has no effect on the crystal structure.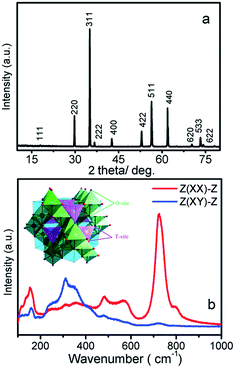 | ||
| Fig. 1 (a) The powder XRD pattern of as-grown Zn2TiO4 crystal; (b) the room-temperature polarized Raman spectrum of the Zn2TiO4 and inset shown cell of spinel Zn2TiO4. | ||
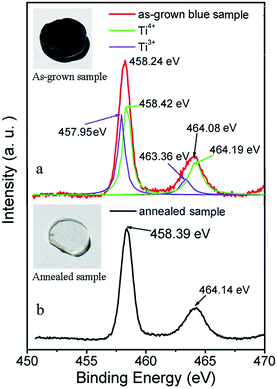 | ||
| Fig. 2 XPS spectra of Ti 2p for as-grown and annealed sample, the inserts show photographs of as-grown and annealed Zn2TiO4 samples. | ||
To clarify the color changing machine between the as-grown and annealed crystals, XPS measurements (Fig. 2) were performed to investigate the chemical states of Ti atoms in the as-grown and annealed samples. Compared with the peaks of annealed sample (Ti 2p3/2 at 458.39 and Ti 2p1/2 at 464.14 eV), the bonds for as-grown crystal (Ti 2p3/2 at 458.24 and Ti 2p1/2 at 464.08 eV) show a shift towarded lower binding energy. After deconvolution, the Ti 2p bonds of as-grown crystal can be divided into four bonds at 457.95, 458.42, 463.36 and 464.19 eV, which represent Ti3+ 2p3/2, Ti4+ 2p3/2, Ti3+ 2p1/2 and Ti4+ 2p1/2, respectively. It indicates the existence of Ti3+ ions in the as-grown crystal. The Zn2TiO4 crystals were grown in an argon atmosphere. When the feeding rod has been heated up to its melting point the oxygen atoms in the lattice are driven away easily forming oxygen vacancies and the Ti4+ ions are reduced to Ti3+ ions. After annealed in the oxygen, the oxygen vacancies were eliminated, Ti3+ ions were oxidized to Ti4+ again and the color fades to colorless and transparent.
The orientation of as-grown Zn2TiO4 crystal was measured by XRD2, as shown in Fig. 3a. From which, we can know that the crystal grows along a-axis direction, which is same as the crystal seed direction. The micro-defects, including the low-angle crystal boundaries and bubbles of the as-fabricated Zn2TiO4 single crystal, were also observed via the micropolariscopy in the cross transmission arrangement, as shown in the Fig. 3b. In the wafer, we cannot find bubbles or low-angle grain boundaries.
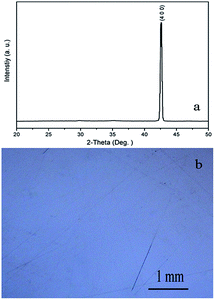 | ||
| Fig. 3 (a) XRD2 patterns of Zn2TiO4 crystal wafer (b) the wafer under polarizing microscope in the transmission configuration. | ||
At room temperature, Zn2TiO4 is an inverse spinel, structure formula can be written as (Zn(TiZn)O4), with a space group of Fd![[3 with combining macron]](https://www.rsc.org/images/entities/char_0033_0304.gif) m and typically described by a 56 atom unit cell. In this unit cell, 32 oxygen atoms comprise a face-centered cubic lattice with associated interstitial octahedral (O) and tetrahedral (T) sites. These T-sites are occupied by half of the divalent Zn cations, while O-sites are randomly filled with a stoichiometric mixture of divalent Zn and tetravalent Ti cations, as shown in the insert of Fig. 2. However, the smallest Bravais cell contains only 14 atoms. Thus, according to factor group analysis, the irreducible representations of these modes are:21
m and typically described by a 56 atom unit cell. In this unit cell, 32 oxygen atoms comprise a face-centered cubic lattice with associated interstitial octahedral (O) and tetrahedral (T) sites. These T-sites are occupied by half of the divalent Zn cations, while O-sites are randomly filled with a stoichiometric mixture of divalent Zn and tetravalent Ti cations, as shown in the insert of Fig. 2. However, the smallest Bravais cell contains only 14 atoms. Thus, according to factor group analysis, the irreducible representations of these modes are:21
| A1g(R) + Eg(R) + F1g+ 3F2g(R) + 2A2u + 2Eu + 4F1u(IR) + 2F2u. | (1) |
The Raman tensors are signification in the polarized Raman investigation of Zn2TiO4, especially in spectrum-scattering intensity, which is directionally dependent under an intrinsic coordinate system. According to Raman tensor and polarization selection rules, in the XX, YY, and ZZ polarized configurations, the incident scattering lights are parallel with the direction of a specific crystalline axis, Eg and A1g modes can be detected and the F2g can be obtained in the XY and YX. Fig. 1b illustrates the room temperature polarized Raman spectrum of a Zn2TiO4 crystal. In the Z(XX)-Z configuration, A1g and Eg mode are expected. The bond at 721 cm−1 dominate in the spectrum. The second strong bond is located at 478 cm−1. The intensity of others become very low. And the 721 cm−1 indexed as A1g and peak at 478 cm−1, which is indexed as F2g in previous work7 that is disagree with our polarized results. So that the peak at 478 cm−1 should be indexed as Eg according to polarization selection rules. While in the Z(XY)-Z configuration, three peaks at 257, 308 and 348 cm−1 become stronger and dominate the spectrum. Also, according to the Raman polarization selection rules, these three mode should be indexed as F2g. The A1g mode located at 721 cm−1 corresponds to the ZnO4 mode, which reflects the local lattice effect in the tetrahedral sublattice, which can be supported by R. Cuscó et. al.23 In their article they find second-order Raman active Zn–O chine band located just at 721 cm−1. And the lowest wavenumber mode at 257 cm−1 should be attributed T′(Zn) or coupled T′(Zn) and BO6 bending mode, supporting by M. Maczka et. al.24 Thus, the three modes at 308, 348, and 478 cm−1 involve TiO6 or ZnO6 modes, which reflect local lattice effects in the octahedral sublattice. The three leakage Raman peaks observed at 154, 567, and 794 cm−1 do not belong to the first-order Raman modes of Zn2TiO4. The peak at 154 cm−1 is considered as a plasma effect from the laser, the peak at 567 cm−1 is considered a result of order-disorder in the Zn2TiO4,21 and the peak at 794 cm−1 has yet to be identified.
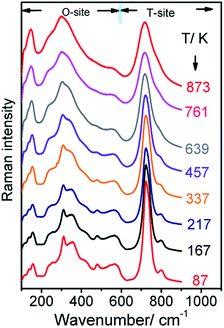
To investigate temperature effects on the spinel structure of Zn2TiO4, Raman spectra were collected in the temperature range of 107–817 K, as shown in Fig. 4. The vibration mode of A1g exhibits obvious softening and broadening and other Raman modes below 600 cm−1 become fuzzier because the widths were too wide to be recognized when the temperature increases from 107 K to 817 K. Given thermal effects, the five modes shift toward lower wavenumbers as the temperature increases. Moreover, the Eg mode disappears when the temperature beyond 639 K.
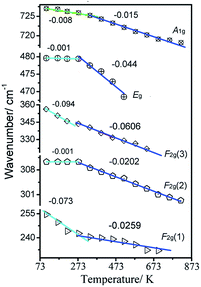
The Raman peaks of F2g(1), F2g(2), F2g(3), Eg, and A1g were fitted to a Lorentzian line shape, and the Raman wavenumber of these modes and FWHM of the A1g mode were obtained, as shown in Fig. 5 and 6, respectively. From Fig. 5, the Raman peak positions of F2g(1), F2g(2), and A1g shift toward lower wavenumbers direction as the temperature increases from 107 K to 273 K. However, the Raman peak positions of the Eg and F2g(2) modes are stable in this region. When the temperature reaches 273 K, the speed of five modes shift toward lower wavenumbers changed.
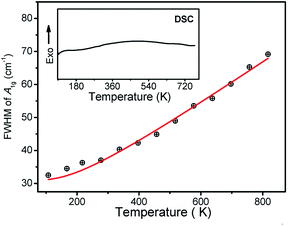 | ||
| Fig. 6 Linewidth of A1g modes at cm−1 as a function of temperature. The inset shows DSC result of Zn2TiO4 sample. | ||
On the other hands, considering the thermal effects observed, the red-shift of the five phonon modes in the spinel Zn2TiO4 system indicates the sensitivity of cation distribution in the system as the temperature increases. The wavenumbers of the modes Eg and F2g(2) decrease more rapidly as the temperature increases to beyond 273 K. By contrast, when the sample is heated up to 273 K, the decrease rates of the F2g(1) and F2g(3) modes slow down. While the A1g attributed to T-site lattice vibration is more stable and the decrease rate change at 337 K, which is later than other bands.
Base on the theory from ‘Thermodynamics of crystals’,25 the damping of phonon can be attributed to phonon–phonon, spin–phonon or crystal field–phonon interactions. In second-order perturbation, the temperature-dependent FWHM only arises through cubic anharmonic interactions corresponding to decay and combination process. The best fit to the data of A1g modes is obtained by only assuming the combination of the observed phonon with another phonon of wavenumber ω′ to create a third excitation wavenumber ω′′, where ω′′ = ω + ω′. The temperature-dependent FWHM of modes can be fitted by the function as follows:25–27
| F(λ) = F1(λ) + F2(λ)[n(ω) − n(ω + ω′)] | (2) |
| n(ω′) = {exp[ℏΔo(ω′)/kT] − 1}−1 | (3) |
As shown in Fig. 4, the relative Raman intensities of T and O-sites, which are characterized by modes beyond and below 600 cm−1, change as the temperature increases. At 107 K, the spinel Zn2TiO4 is highly ordered, and the Raman intensity at 721 cm−1, as the strongest bond, is significantly higher than that of bonds below 600 cm−1. As the temperature increases, the relative intensity at 721 cm−1 decreases gradually. The relative intensity reflects the relative content of the corresponding mode compared with other modes. Decreases in the relative intensity of the mode at 721 cm−1 imply a reduction in the relative content for the vibration of the T-site. This finding can be attributed to the dislocation of Zn2+ cations from T-sites to O-site, while Ti4+ cations may move from O-sites to T-sites and the Ti4+ cations at T-sites are no Raman activity. Thus, the interchange results in disorder in the entire inverse spinel structure of Zn2TiO4 when the temperatures increases because of the imbalance between these two valences, which are common phenomena, called order-disorder effect, in spinel materials.28,29
To confirm our assumption, DSC measured on Zn2TiO4 sample was performed in the range of 95 to 750 K, which is same as temperature dependent Raman result, as shown in the inset of Fig. 6. The DSC curves for Zn2TiO4 cooled down to 95 K firstly, using liquid nitrogen. And then heated up to 750 K at a scanning rate of 10 K min−1. The DSC curve shows no inflection point in the whole range. It is indicated that Zn2TiO4 has no phase transition in the temperature range. The phenomenon in the temperature dependent Raman result can be attributed to the order-disorder effect.
4. Conclusions
Spinel Zn2TiO4 single crystals were grown by optical floating zone technology. The as-grown crystals are free of bubble and low angle grain boundary, and grow along the a-axis direction. The room-temperature polarized Raman spectra of the as-grown crystal was identified. The in-site temperature-dependent Raman spectra of spinel Zn2TiO4 were also described and the structure disorder in the Zn2TiO4 appeared with increasing the temperature, which may indicate the cations migration between tetrahedral and octahedral sites, which is confirmed by DSC result.Acknowledgements
The financial support from the National Foundation for Fostering Talents of basic Science (Grant No. J1103202), the National Natural Science Foundation of China (Grant No. 11274137, 11074090, 11304113), Education and research project of Jilin Province education department (No. 2016401) and the Open Project of State Key Laboratory of Inorganic Synthesis and Preparative Chemistry (Jilin University) (No. 2017-6) are greatly appreciated.Notes and references
- W.-L. Lee, S. Watauchi, V. L. Miller, R. J. Cava and N. P. Ong, Science, 2004, 303(5664), 1647–1649 CrossRef CAS PubMed.
- F. Wu, N. Li, Y. Su, L. Zhang, L. Bao, J. Wang, L. Chen, Y. Zheng, L. Dai, J. Peng and S. Chen, Nano Lett., 2014, 14(6), 3550–3555 CrossRef CAS PubMed.
- K. M. Kojima, R. Kadono, M. Miyazaki, M. Hiraishi, I. Yamauchi, A. Koda, Y. Tsuchiya, H. S. Suzuki and H. Kitazawa, Phys. Rev. Lett., 2014, 112(8), 087203 CrossRef.
- A. S. Burange, S. R. Kale, R. Zboril, M. B. Gawande and R. V. Jayaram, RSC Adv., 2014, 4(13), 6597–6601 RSC.
- A. Zerr, G. Miehe, G. Serghiou, M. Schwarz, E. Kroke, R. Riedel, H. Fuesz, P. Kroll and R. Boehler, Nature, 1999, 400(6742), 340 CrossRef CAS.
- S.-H. Shim, T. S. Duffy and G. Shen, Nature, 2001, 411(6837), 571–574 CrossRef CAS PubMed.
- Z. W. Wang, R. T. Downs, V. Pischedda, R. Shetty, S. K. Saxena, C. S. Zha, Y. S. Zhao, D. Schiferl and A. Waskowska, Phys. Rev. B: Condens. Matter Mater. Phys., 2003, 68(9), 094101 CrossRef.
- P. R. Guagliardo, E. R. Vance, G. R. Lumpkin, M. G. Blackford, K. Sudarshan, J. Davis, S. Samarin and J. F. Williams, J. Am. Ceram. Soc., 2013, 96(10), 3286–3289 CAS.
- R. L. Miliard, R. C. Peterson and B. K. Hunter, Am. Mineral., 1995, 80, 885 Search PubMed.
- Y. Yang, R. Scholz, H. J. Fan, D. Hesse, U. Gosele and M. Zacharias, ACS Nano, 2009, 3(3), 555 CrossRef CAS PubMed.
- K. Jothimurugesan and S. K. Gangwal, Ind. Eng. Chem. Res., 1998, 37(5), 1929 CrossRef CAS.
- S. Lew, A. F. Sarofim and M. Flytzani-Stephanopoulos, Chem. Eng. Sci., 1992, 47(6), 1421 CrossRef CAS.
- J. J. Huang, J. T. Zhao, X. F. Wei, Y. Wang and X. P. Bu, Powder Technol., 2008, 180(1–2), 196 CrossRef CAS.
- M. V. Nikolić, N. Obradović, K. M. Paraskevopoulos, T. T. Zorba, S. M. Savić and M. M. Ristić, J. Mater. Sci., 2008, 43(16), 5564 CrossRef.
- K. H. Yoon, J. Cho and D. H. Kang, Mater. Res. Bull., 1999, 34(9), 1451 CrossRef CAS.
- C. F. Li, Y. Bando, M. Nakamura, N. Kimizuka and H. Kito, Mater. Res. Bull., 2000, 35(3), 351 CrossRef CAS.
- A. C. Chaves, S. J. G. Lima, R. C. M. U. Araújo, M. A. M. A. Maurera, E. Longo, P. S. Pizani, L. G. P. Simões, L. E. B. Soledade, A. G. Souza and I. M. G. d. Santos, J. Solid State Chem., 2006, 179(4), 985 CrossRef CAS.
- J. I. Colless, X. G. Croot, T. M. Stace, A. C. Doherty, S. D. Barrett, H. Lu, A. C. Gossard and D. J. Reilly, Nat. Commun., 2014, 5, 3716 CAS.
- S. Merkel, A. F. Goncharov, H. k. Mao, P. Gillet and R. J. Hemley, Science, 2000, 288(5471), 1626–1629 CrossRef CAS PubMed.
- R. Cuscó, E. Alarcón-Lladó, J. Ibáñez, L. Artús, J. Jiménez, B. Wang and M. J. Callahan, Phys. Rev. B: Condens. Matter Mater. Phys., 2007, 75(16), 165202 CrossRef.
- Z. W. Wang, S. K. Saxena and C. S. Zha, Phys. Rev. B: Condens. Matter Mater. Phys., 2002, 66(2), 0241031 Search PubMed.
- L. Li, H. Yang, D. Wang, G. Feng, B. Li, Z. Gao, D. Xu, Z. Ding and X. Liu, J. Cryst. Growth, 2010, 312(24), 3561 CrossRef CAS.
- R. Cuscó, E. Alarcón-Lladó, J. Ibáñez, L. Artús, J. Jiménez, B. Wang and M. J. Callahan, Phys. Rev. B: Condens. Matter Mater. Phys., 2007, 75(16), 165202 CrossRef.
- M. Mączka, M. Ptak, M. Kurnatowska and J. Hanuza, Mater. Chem. Phys., 2013, 138(2–3), 682–688 CrossRef.
- D. C. Wallace, Thermodynamics of crystals, 1972, wiley, New York, pp. 582–583 Search PubMed.
- F. D. Medina and W. B. Daniels, J. Chem. Phys., 1976, 64(1), 150–161 CrossRef CAS.
- H. Wang, F. D. Medina, Y. D. Zhou and Q. N. Zhang, Phys. Rev. B: Condens. Matter Mater. Phys., 1992, 45(18), 10356–10362 CrossRef CAS.
- H.-P. Liu, R. N. Schock and D. L. Anderson, Geophys. J. R. Astron. Soc., 1975, 42(1), 217–250 CrossRef.
- Y. Y. Liao, Y. W. Li, Z. G. Hu and J. H. Chu, Appl. Phys. Lett., 2012, 100(7), 071905 CrossRef.
| This journal is © The Royal Society of Chemistry 2017 |


