 Open Access Article
Applying rheological analysis to understand the mechanism of polyacrylamide (PAM) conditioning for sewage sludge dewatering
Hou-Feng Wang a,
Hua-Jie Wangab,
Hao Hua and
Raymond J. Zeng*a
aCAS Key Laboratory for Urban Pollutant Conversion, Department of Chemistry, University of Science and Technology of China, Hefei 230026, China. E-mail: rzeng@ustc.edu.cn; Fax: +86 551 63600203; Tel: +86 551 63600203
bSchool of Environmental and Chemical Engineering, Anhui Vocational and Technical College, Anhui 230011, China
First published on 12th June 2017
Abstract
Nowadays, polyacrylamide (PAM) is widely used for sludge conditioning, while the interactions between PAM and sludge particles influencing the dewatering process remain to be clarified. This study focused on applying rheological analysis to understand the mechanism of PAM conditioning for sewage sludge dewatering. Effective solid–liquid separation was achieved mostly due to the changes of physical properties instead of biochemical properties for conditioned sludge. PAM addition enhanced the non-Newtonian properties and strengthened the solid-like character of sludge in the linear region, allowing initial enhancement of the network strength of sludge flocs. Due to these changes in rheological behavior and more free water being available to flow, the breakdown of the colloidal network of sludge in the non-linear viscoelastic regime allowed high-performance separation between water and solid-phase. These findings show that rheological analysis can serve as a useful indicator of the activated sludge dewatering process.
1. Introduction
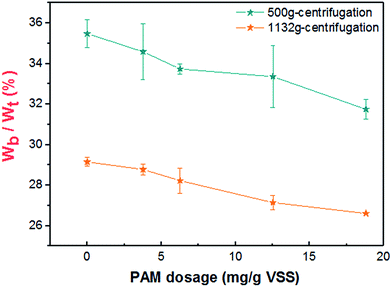
The continued rapid increase of sewage sludge production from municipal wastewater treatment plants is of significant concern since sludge treatment and disposal cause great environment and economic burdens.1 To deal with the waste sewage sludge, sludge conditioning is required before mechanical dewatering.2,3 Recently, efforts have been made to improve the high-performance dewatering process and determine the relevant dewatering mechanisms. Enhancing the rate of sludge filtration and reducing the affinity of extracellular polymeric substances (EPS) for binding water molecules (bound water) are the most common strategies of sludge dewatering.4–6 Improving the rate of sludge filtration involves altering the hydrodynamics between the solid phase and the liquid phase of a sludge system. Bound water can be simply divided into physically or chemically bound water.6 Decreasing the affinity for bound water is related to the floc structure, strength, and the amount of bound water, and this affinity plays a key role in affecting the moisture level of sludge.7Numerous treatments have been investigated for sludge conditioning, such as chemical conditioning (addition of salt and polyelectrolytes, pH adjustment, or advanced oxidation processes), physical conditioning (using microwaves, electrolysis, or thermal/freeze pretreatment) and biological or enzyme conditioning.1,8–10 Among these, polyacrylamide (PAM) is one of the most widely used conditioners for full-scale sludge dewatering.11 The flocculation of sludge particles by cationic PAM helps reduce the gap between particles through the bridging mechanism and neutralizes surface charge.1 Many literatures attempt to explore the mechanism of PAM conditioning process and the sludge dewatering performances, but no clear conclusion can be drawn because of controversial data and definitions. These controversies focus mainly on two points: whether the conditioning of PAM can change the moisture level of sludge cake; how the dosage of PAM for activated waste sludge affects the content of bound water. Huang and Ye12 found that the composite conditioner of PAM/montmorillonite (MMT) achieved good dewaterability through the effect of charge neutrality, bridging action, and adsorption, however, almost no change of the moisture level of sludge cake was observed. Guan, et al.13 reported that the dosage of PAM affected the filter cake moisture content. As to the bound water, Smollen14 reported that the dosage of polymer increased the bound water content. But Katsiris and Kouzelikatsiri15 had a reverse conclusion that the bound water content decreased when increasing polymer dosage. That's partly due to the measurement of bound water content present in scientific paper differs widely due to the measurement method chosen.6,16 Till to now, results about the change of bound water by PAM conditioning remains unclear.13 Nowadays, though the use of PAM for sludge conditioning is widespread, effective, and economical, the mechanism of PAM conditioning and the hydrodynamic changes between the solid phase and the liquid phase of the sludge system still remains unclear. Additionally, how interactions between PAM and sludge particles influencing the dewatering process remain to be clarified.
Wastewater sludge is considered a non-Newtonian fluid.17 Rheology describes the deformation of a body under the influence of stresses and can be used to characterize the non-Newtonian properties of materials.18 Thus, many studies have used rheological parameters as indicators of the internal architectural features19 and quantifying flow behavior or sludge cake behavior in dewatering processes.20–22 However, previous works mainly focus on relating or assessing filterability/dewaterability with rheological parameters, and there have been few reports of rheological analysis of conditioned sludge and the correlation of rheological parameters with dewatering processes. Indeed, it remains to be determined whether rheological analysis can reveal the mechanism of sludge dewatering.
The objective of this study was to explore the PAM conditioning process for activated waste sludge and evaluate the feasibility of applying rheological analysis to understand the mechanism of PAM conditioning on sludge dewatering. This work might improve our fundamental understanding of sludge dewatering.
2. Materials and methods
2.1. Raw sludge and chemicals
Raw activated sludge was sampled from one local municipal wastewater treatment plant (WWTP) in Hefei, Anhui Province, China, with a capacity of 180![[thin space (1/6-em)]](https://www.rsc.org/images/entities/char_2009.gif) 000 m3 d−1 in the oxidation ditch process. The dewatered sludge was gently concentrated to 23.60 g L−1 by settling from the initial solid concentration of 12.24 g L−1 and then was stored at 4 °C for less than 1 week prior to use. The characteristics of the dewatered sludge samples are given in Table 1. The cationic polyacrylamide (PAM: linear-chain structure) used in this study was purchased from Chengdu Ai Keda Chemical Technology Co., Ltd (China), and it had the same production standard as the PAM used in the WWTP (
000 m3 d−1 in the oxidation ditch process. The dewatered sludge was gently concentrated to 23.60 g L−1 by settling from the initial solid concentration of 12.24 g L−1 and then was stored at 4 °C for less than 1 week prior to use. The characteristics of the dewatered sludge samples are given in Table 1. The cationic polyacrylamide (PAM: linear-chain structure) used in this study was purchased from Chengdu Ai Keda Chemical Technology Co., Ltd (China), and it had the same production standard as the PAM used in the WWTP ( = 8.0 × 10⁶ to 15 × 106, cationic degree = 10–60%).
| pH | 6.89 ± 0.10 |
| Total solids (g L−1) | 23.6 ± 0.12 |
| Volatile suspended solids (VSS, g g−1 TS) | 0.56 ± 0.03 |
| CST (s) | 67.4 ± 0.6 |
| Sludge viscosity (mPa s) | 11.34 ± 0.08 |
| Zeta potential (mV) | −11.81 ± 0.34 |
2.2. Sludge conditioning and dewatering
PAM solution (2 wt%) was prepared by dissolving the polymer powder completely in distilled water with stirring and then incubation for 24 h at ambient temperature prior to use. For each conditioning test, PAM was added to a 50 mL portion of sludge. The mixture was stirred for 2 min at a speed of 300 rpm and then left for 5 min. All the tests were performed in triplicate. The dewaterability of the sludge was estimated with a CST instrument (Model 319, Triton, UK) using original CST papers (Triton Electronics Ltd., UK). To ensure the results of the water content of the raw and conditioned sludge was scientific and accurate, the sludge samples were dewatered both by Buchner funnel filtration23 at 0.05 MPa for different duration (2 min, 5 min and 20 min) and centrifugation method described in Jin, et al.6 at 500g (2115 rpm), 1132g (3186 rpm) and 4000g (5980 rpm) for 10 min, respectively. The sludge suspension was obtained by centrifuging and then filtered through the 0.45 μm cellulose acetate membrane. The supernatant was analyzed for zeta potential by a Nanosizer ZS instrument (Malvern Co., UK) at 25 °C based on the previous studies.24,25The pH of the solution was determined by a pH meter (pHS-3C, LeiChi, China). The above measurements were determined at least six independent times and conducted at 25.0 ± 0.1 °C.
2.3. Morphological analysis
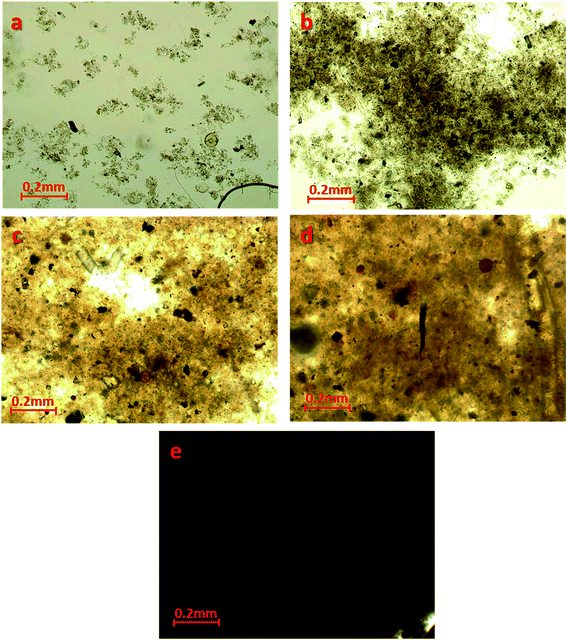
The morphology of the raw and conditioned sludge flocs was measured by an Image Analysis system with a Leica ICC50 camera and Leica biological microscope (Leica Ltd., Germany).2.4. Bound water
The content of bound water within sludge was measured based on the methods described in Jin, et al.6 and Xiao, et al.26 A 30 mL volume of sludge samples placed in a centrifugal tube (50 mL) was centrifuged at 500, 1132 and 4000g for 10 min, respectively. Subsequently, the supernatant was removed. The water content within the centrifuged sludge cake was expressed as the bound water content.2.5. Extracellular polymeric substances (EPS) extraction and analysis
The sludge samples were centrifuged at 5000g for 5 min and the supernatant was collected as soluble EPS (SB-EP). Then, bound EPS of the sludge including loosely bound EPS (LB-EPS) and tightly bound EPS (TB-EPS) was extracted by a modified heat extraction method.24 Both the soluble EPS and bound EPS were analyzed for polysaccharides (PS), humic-like substances (HS), and proteins (PN). The PS level were determined by the anthrone-sulfuric acid method with glucose as the standard.27 The TOC amount was measured by a TOC analyzer (Multi N/C 2100, Analytic Jena Co., Germany). Soluble COD was analyzed by a microcomputer COD heating reactor (TR-1100, Suntex Instrument Co., Ltd, China). The contents of HS and PN were determined with the modified Lowry method28 and using a UV spectrophotometer (UV751GD, Analytical Instrument Co., China), with humic acid (Fluka) and bovine albumin (Sigma) as the standards, respectively.2.6. Rheological tests
All rheological tests were performed using a rotational AR-2000ex rheometer (TA instruments, USA) equipped with a ‘cup and bob’ geometry (29 mm inner diameter, 32 mm outer diameter, and 44 mm length) and connected to a water bath at 25 °C. The sludge sample was pre-sheared for 5 min at a shear rate of 500 s−1 and then allowed to rest for 10 min.29 For dynamic measurement, strain sweep tests (0.01–100%) were performed at the frequency of 5 rad s−1 at 25 °C as described by Ma, et al.29 to determine the structural properties of the sludge and to determine the linear viscoelastic regime (LVE regime). Then, in the linear regime, frequency, creep, and time tests were conducted. The frequency sweep was performed at 0.1% strain with a frequency range of 0.1–50 rad s−1 at 25 °C. The creep test was performed according to the method of Ruiz-Hernando, et al.30 by applying the constant shear stress of 0.02 Pa (<τy) and the corresponding compliance was monitored for 5 min. Time sweep test (1–360 s) was performed at the 0.1% strain (under LVE regime) at 25 °C. Flow measurement was performed in the steady shear mode with a shear rate that was logarithmically increased from 0.01 to 500 s−1 for 10 min. To fit the rheological data and describe the basic non-Newtonian rheology of the samples, the Herschel–Bulkley model (eqn (1)) with an additional yield stress (τy) was used.
τ = τy + k![[small gamma, Greek, dot above]](https://www.rsc.org/images/entities/i_char_e0a2.gif) n n
| (1) |
![[small gamma, Greek, dot above]](https://www.rsc.org/images/entities/i_char_e0a2.gif) is the shear rate (s − 1), τy is the yield stress (Pa), and k is the consistency index (Pa sn), which can reveal the average firmness of the sample,30 n is the flow behavior index, and a decrease or increase of n from 1 means that the non-Newtonian flow characteristics are strengthened.31
is the shear rate (s − 1), τy is the yield stress (Pa), and k is the consistency index (Pa sn), which can reveal the average firmness of the sample,30 n is the flow behavior index, and a decrease or increase of n from 1 means that the non-Newtonian flow characteristics are strengthened.31
3. Results and discussion
3.1. Dewatering performance of PAM conditioned sludge
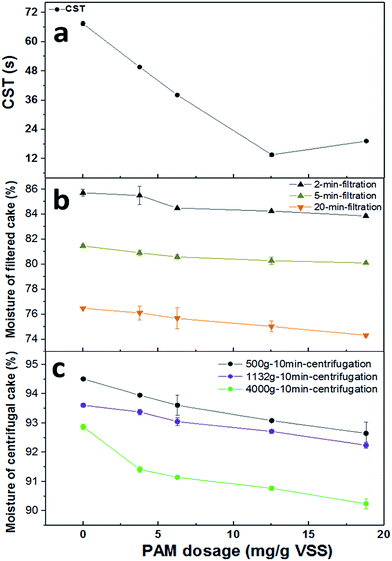
The effects of PAM dosage on sludge dewaterability were assessed in terms of CST, and dewatering efficiency was assessed in terms of the moisture content of both the filter-cake and centrifugal-cake. As illustrated in Fig. 1a, sludge dewaterability was improved substantially with the addition of PAM. CST decreased from 67.40 s to 13.60 s when PAM dosage increased from 0 to 12.53 mg g−1 VSS, but when the PAM dosage increased to 18.80 mg g−1 VSS, the CST increased to 19.20 s, suggesting the optimal dosage was approximately 12.53 mg g−1 VSS. The water content of sludge cake with increasing PAM dosage is shown in Fig. 1b and c. For the filtered cake, the dosage of PAM decreased the moisture level of sludge cake. The moisture content of filter-cake slightly decreased from 85.71% to 83.86% for 2 min-filtration time, 81.47% to 80.10% for 5 min-filtration time and 76.49% to 74.32% for 20 min-filtration when increasing the PAM dosage from 0 to 18.80 mg g−1 VSS (Fig. 1b). A similar trend was observed in Fig. 1c for centrifugal-cake. The moisture content of centrifugal cake decreased from 94.51% to 92.65% at 500g, 93.61% to 92.21% for 1132g and 92.87% to 90.24% at 400g for 10 min respectively when the PAM dosage increased to 18.80 mg g−1 VSS. These results above illustrated that the rate of sludge filtration was enhanced largely while the moisture level of sludge cake decreased slightly with increasing PAM dosage.3.2. Physicochemical properties of PAM conditioning
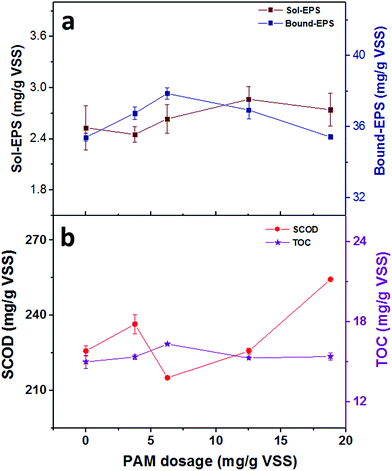 | ||
| Fig. 5 The correlation between PAM dosage and (a) the contents of different EPS fractions (b) the contents of SCOD and TOC in soluble EPS. | ||
| PAM dosage (mg g−1 VSS) | pH | Zeta potential (mV) | Biopolymers content (mg g−1 VSS) | TOC (mg g−1 VSS) | ||
|---|---|---|---|---|---|---|
| Polysacc-harides | Proteins | Nucleic acids | ||||
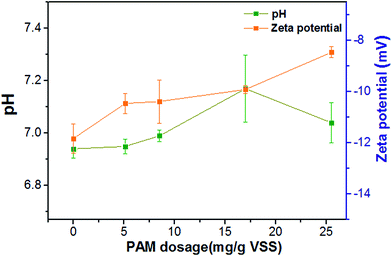
| 0.00 | 6.92 ± 0.04 | −11.83 ± 0.57 | 0.70 ± 0.02 | 0.91 ± 0.01 | 0.92 ± 0.02 | 14.98 ± 0.51 |
| 3.76 | 6.93 ± 0.03 | −10.46 ± 0.39 | 0.71 ± 0.05 | 0.81 ± 0.03 | 0.94 ± 0.04 | 15.36 ± 0.18 |
| 6.26 | 6.98 ± 0.02 | −10.18 ± 0.85 | 0.70 ± 0.03 | 0.93 ± 0.03 | 1.01 ± 0.03 | 16.32 ± 0.14 |
| 12.53 | 7.08 ± 0.18 | −9.91 ± 0.15 | 0.69 ± 0.08 | 0.93 ± 0.04 | 1.20 ± 0.04 | 15.26 ± 0.12 |
| 18.80 | 6.99 ± 0.08 | −8.46 ± 0.22 | 0.71 ± 0.01 | 0.91 ± 0.06 | 1.12 ± 0.04 | 15.39 ± 0.29 |
3.3. Dewatering performance by rheological analysis
![[small gamma, Greek, dot above]](https://www.rsc.org/images/entities/i_char_e0a2.gif) > 40 s−1). These results suggest that the use of PAM as a good flocculant can decrease the flow resistance between solid-phase and liquid-phase after yield (
> 40 s−1). These results suggest that the use of PAM as a good flocculant can decrease the flow resistance between solid-phase and liquid-phase after yield (![[small gamma, Greek, dot above]](https://www.rsc.org/images/entities/i_char_e0a2.gif) > 40 s−1). How does the addition of PAM increase the fluidity of the colloidal system for the conditioned sludge?
> 40 s−1). How does the addition of PAM increase the fluidity of the colloidal system for the conditioned sludge?
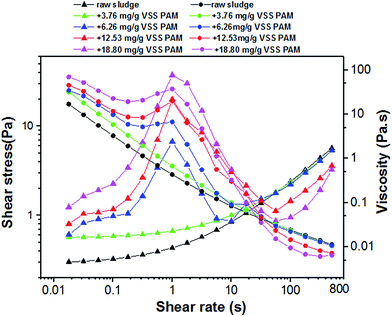 | ||
| Fig. 6 Typical rheogram of PAM conditioned sludge at various dosages with SS of 23.60 g L−1 at 25 °C. | ||
| PAM dosage (mg g−1 VSS) | Steady state measurements: ![[small gamma, Greek, dot above]](https://www.rsc.org/images/entities/i_char_e0a2.gif) = 0.1–500 s−1 = 0.1–500 s−1 |
Key parameters in linear regime | ||||||||
|---|---|---|---|---|---|---|---|---|---|---|
| τy (Pa) | k (Pa sn) | n | R2 | τmax (Pa) | η∞ (mPa s) | γc1 (%) | γc2 (%) | G* (Pa) | tan(delta) | |
| 0.00 | 0.287 | 0.147 | 0.581 | 0.996 | 0.313 | 11.370 | 44.632 | 1.632 | 8.263 | 0.109 |
| 3.76 | 0.558 | 0.113 | 0.601 | 0.949 | 0.571 | 10.591 | 47.370 | 1.933 | 9.460 | 0.103 |
| 6.26 | 0.702 | 0.103 | 0.627 | 0.665 | 6.703 | 10.760 | 51.103 | 2.530 | 11.012 | 0.098 |
| 12.53 | 0.816 | — | — | 0.096 | 19.961 | 7.192 | 80.908 | 4.024 | 11.253 | 0.091 |
| 18.80 | 1.246 | — | — | 0.037 | 37.361 | 6.503 | 104.15 | 6.163 | 14.276 | 0.089 |
To answer this question, there were two interesting observations from these experiments about the LVE regime (Fig. 6). First, the PAM-conditioned sludge exhibited greater network strength than raw sludge before the sludge system yield. Secondly, the higher the PAM dosage added, the bigger the deviation of the sludge rheogram. These changes reveal that the distribution between solid-phase and liquid-phase may become homogeneous and orderly with the increase of entropy, which makes the network and strength of the system more stable. These observations were consistent with the results in Fig. 4 because more bound water was transformed to free water with increasing PAM dosage in the range of 0–18.80 mg g−1 VSS (Fig. 2). Once the critical shear rate is achieved, the network will be dissipated and sensitive to shear in the non-LVE regime. Thus, the fluidity of the liquid phase can be effective. As a result, the apparent viscosity decreases with PAM addition.
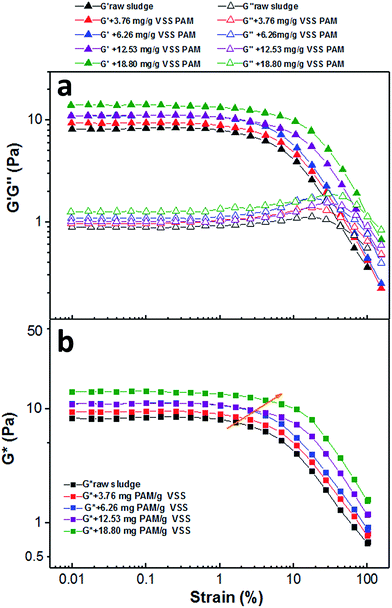 | ||
| Fig. 7 Evolution of (a) storage and loss moduli and (b) complex modulus during strain sweep with SS of 23.60 g L−1 at various PAM dosages. | ||
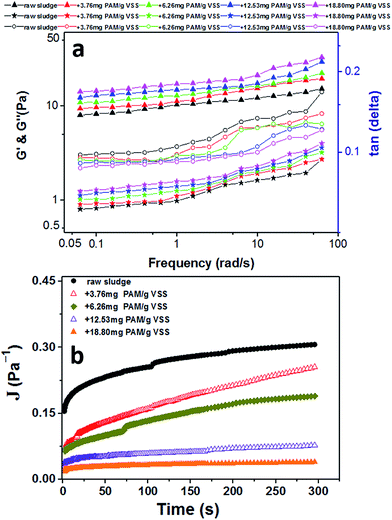
To better understand the viscoelastic properties within the LVE regime for PAM-conditioned sludge, a typical frequency sweep was performed. As shown in Fig. 8a, all of these samples presented as a solid-like regime (G′ > G′′). The values of tan(δ) significantly decreased after addition of PAM, suggesting that the strengthened viscoelastic properties of the sludge after PAM conditioning for increased solid-like properties.
Furthermore, the creep tests were performed to probe the time-dependent nature of changes in these sludge samples. Fig. 8b shows the values of compliance as a function of time. As expected, a significantly lower compliance (J(t)) was observed by a given stress with increased PAM dosage, indicating that the addition of PAM strengthened the internal structures of sludge flocs. The sludge conditioned with PAM showed more rigid or elastic structures within the linear viscoelastic regime. These results were consistent with the ones from flow tests before yield (Fig. 6) and frequency tests before yield (Fig. 8a).
3.4. The mechanism of PAM conditioning on sludge dewatering
This study illustrates the physicochemical behavior and rheological properties of raw and PAM-conditioned sludge. Although many rheological parameters of sludge have been proposed to describe and predict both lab-scale and full scale dewatering,21,33,35,36 here rheological analysis is used to reveal the mechanism of PAM conditioning on sewage sludge dewatering. In an efficient cake filtration process, the stress or shear applied in the sludge system hinders the fluid flow through the denser solid matrix and ultimately forces out large amounts of water from the cake.21 Based on the experimental results, we propose that well polymer-flocculated sludge should possess the two following characteristics:(1) The flocs should have pronounced elastic behavior and steric network to resist applied stress to create a cake with high porosity and permeability and hinder fluid flow through a denser solids matrix. As a consequence, the distribution of solid-phase and liquid-phase should be more orderly.
(2) Water is separated from the solid matrix after yield during the filtration process, meaning that the performance of solid–liquid sludge separation is effective.
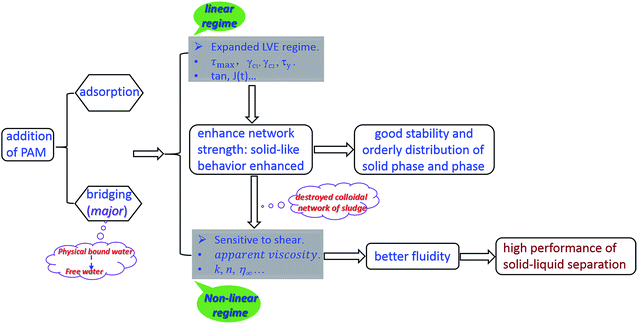
The effect of PAM conditioning on activated sludge dewatering is proposed in Fig. 9. When the PAM dosage was increased from 0 to 18.80 mg g−1 VSS, there was nearly no change in the intracellular material contents or the biochemical properties of sludge, and only a small increase in electrostatic neutralization. However, the irregular flocs appeared to become compacted and aggregated with increasing PAM dosage (Fig. 4), which would cause the possible extrusion of more physical bound water to free water, consequently, the content of bound water decreased (Fig. 2). These observations reflected in the dynamic measurements were that the addition of PAM significantly increased the strength of floc network and flocculation by anionic PAM based on the rheological properties. Consequently, the maximum shear stress (τmax) and the yield stress obtained by the flow increased after the dosage of PAM (Fig. 6). These phenomena are due to the enhanced network strength of sludge flocs (Fig. 6–8) and the linear viscoelastic regime is expanded based on the dynamic measurement (Table 3). The flocculation mode of sludge particles by polymers includes polymer adsorption (electrostatic interaction, hydrogen bonding) and polymer bridging.37 Our results suggest that the latter is the main flocculation mode for PAM-conditioned sludge (Fig. 3, Table 3). Because more bound water was transformed to free water with increasing PAM dosage, once the stress is high enough to dissipate the colloidal network, the sludge system will be sensitive to the shear rate in the non-LVE regime and the fluidity of liquid phase can be more effective. As a result, better dewatering performance can be achieved, which is indicated by the improvement of filterability (Fig. 1).
Till to now, the works about applying rheology measurement for sludge dewatering to provide guideline mainly focus on determining right dose of additive for a better dewatering. While after summarizing previous works and our results achieved, we thought it was still a challenge to provide precise and scientific guideline on it. Many literatures21,22,33,34,38,39 attempt to explore the correlation between rheological measurements and additive dose assessment/control, but no clear conclusion can be drawn because of consensus is still unachieved. For example, Ormeci38 indicated that the peaks observed in torque readings and entire torque-time rheograms could be used for the determination of the optimum polymer dose and mixing conditions. Oliveira, et al.22 demonstrated that rheological parameter such as η[0.1/s] could be used for optimizing polymer dosage. Wolny, et al.40 indicated that liquid limit might be useful as the control parameter to guide dosing of additive in sludge treatment. Furthermore, some researchers also point out the limitation about rheology measurements for guiding dosing of additive in sludge dewatering.21,34 Though rheological parameters can be used to optimize sludge conditioning and dewatering, the choice of rheological parameters as a dewatering index to determine the optimal dosage in sludge conditioning depends upon the type of sludge and the means of conditioning. So, previous efforts have not provided strong correlation between rheological parameters and sludge dewatering. Thus, it is hasty to provide guideline to select conditioners or determine right dose of additive to reach a good level of dewatering using rheological analysis in this stage. Therefore, we propose that applying rheology analysis can help us understand the mechanism of sludge dewatering process better. On this basis, we hope to give useful indication especially for predicting right dosing of additive for a better dewatering in the future.
4. Conclusions
This study explored the PAM conditioning process for activated waste sludge and evaluated the feasibility of applying rheological analysis to understand the mechanism of PAM conditioning on sludge dewatering. Following outcomes were obtained:(1) The dosage of PAM slightly decreased the moisture level of sludge cake, which was due to the transformation of physical bound water instead of chemical bound water to free water through bridging mechanism.
(2) PAM addition tended to enhance the solid-like character of conditioned sludge in the linear regime.
(3) PAM addition improved the sensitivity of sludge system to shear in the non-linear regime due to the changes of both the bound water content and the linear regime property. So high performance of solid–liquid separation was achieved.
(4) Rheological analysis could act as a useful indicator to reveal the mechanism of sludge dewatering.
Abbreviations
| CST | Capillary suction time (s) |
| PAM | Polyacrylamide |
| Wc | Water content |
| Wt | Total water |
| Wb | Bound water |
| EPS | Extracellular polymeric substances |
| LB EPS | Loosely bound extracellular polymeric substances |
| TB EPS | Tightly bound extracellular polymeric substances |
| PN | Protein |
| PS | Polysaccharide |
| HS | Humic-like substances |
| TOC | Total organic carbon |
| SCOD | Contents of soluble chemical oxygen demand in the soluble EPS |
| Sol-EPS | Soluble extracellular polymeric substances |
| Bound-EPS | Bound extracellular polymeric substances |
| τy | Yield stress (Pa) |
| τmax | Maximum shear stress (Pa) |
| G′ | Storage modulus (Pa) |
| G′′ | Loss modulus (Pa) |
| γc1 | The critical shear strain (G′ = G′′) |
| γc2 | The critical shear strain (rheological properties begin independent of strain) |
| η∞ | Limiting viscosity (mPa s) |
| LVE | Linear viscoelastic |
| k | Consistency index (Pa sn) |
| n | Flow behavior index |
| G* | Complex modulus (Pa) |
| tan | Ratio of G′′/G′ |
| J(t) | Creep compliance (Pa−1) |
| ZP | Zeta potential (mV) |
Acknowledgements
The authors would like to acknowledge financial support from the Petro China Innovation Foundation (2014D-5006-0205), the Program for Changjiang Scholars and Innovative Research Team in University, the Fundamental Research Funds for the Central Universities, and the Collaborative Innovation Center of Suzhou Nano Science and Technology.References
- D. Mowla, H. N. Tran and D. G. Allen, Biomass Bioenergy, 2013, 58, 365–378 CrossRef CAS.
- L. H. Mikkelsen and K. Keiding, Water Res., 2002, 36, 2451–2462 CrossRef CAS PubMed.
- F. W. Liu, J. Zhou, D. Z. Wang and L. X. Zhou, J. Environ. Sci., 2012, 24, 1403–1410 CrossRef CAS.
- M. Raynaud, J. Vaxelaire, J. Olivier, E. Dieude-Fauvel and J. C. Baudez, Water Res., 2012, 46, 4448–4456 CrossRef CAS PubMed.
- Y. Qi, K. B. Thapa and A. F. A. Hoadley, Chem. Eng. J., 2011, 171, 373–384 CrossRef CAS.
- B. Jin, B. M. Wilen and P. Lant, Chem. Eng. J., 2004, 98, 115–126 CrossRef CAS.
- G. P. Sheng, H. Q. Yu and X. Y. Li, Biotechnol. Adv., 2010, 28, 882–894 CrossRef CAS PubMed.
- E. Neyens, J. Baeyens, R. Dewil and B. De heyder, J. Hazard. Mater., 2004, 106, 83–92 CrossRef CAS PubMed.
- M. Ruiz-Hernando, G. Martinez-Elorza, J. Labanda and J. Llorens, Chem. Eng. J., 2013, 230, 102–110 CrossRef CAS.
- Y. G. Chen, H. Z. Yang and G. W. Gu, Water Res., 2001, 35, 2615–2620 CrossRef CAS PubMed.
- M. S. Nasser and A. E. James, Sep. Purif. Technol., 2006, 52, 241–252 CrossRef CAS.
- P. Huang and L. Ye, J. Macromol. Sci., Part B: Phys., 2014, 53, 1465–1476 CrossRef CAS.
- Q. Guan, M. Tang, H. Zheng, H. Teng, X. Tang and Y. Liao, Desalin. Water Treat., 2015, 57, 12988–12997 CrossRef.
- M. Smollen, Water Sci. Technol., 1990, 22, 153–161 CAS.
- N. Katsiris and A. Kouzelikatsiri, Water Res., 1987, 21, 1319–1327 CrossRef CAS.
- J. Vaxelaire and P. Cezac, Water Res., 2004, 38, 2215–2230 CrossRef CAS PubMed.
- J. C. Baudez and P. Coussot, J. Rheol., 2001, 45, 1123–1139 CrossRef CAS.
- D. T. N. Chen, Q. Wen, P. A. Janmey, J. C. Crocker and A. G. Yodh, Annu. Rev. Condens. Matter Phys., 2010, 1, 301–322 CrossRef CAS.
- Y. M. Lin, P. K. Sharma and M. C. M. van Loosdrecht, Water Res., 2013, 47, 57–65 CrossRef CAS PubMed.
- I. L. Chang and D. J. Lee, Water Res., 1998, 32, 905–914 CrossRef CAS.
- M. Marinetti, S. K. Dentel, F. Malpei and L. Bonomo, Water Res., 2010, 44, 5398–5406 CrossRef CAS PubMed.
- I. Oliveira, J. P. Reed, M. Abu-Orf, V. Wilson, D. Jones and S. R. Esteves, Water Res., 2016, 105, 320–330 CrossRef CAS PubMed.
- I. M. C. Lo, K. C. K. Lai and G. H. Chen, Environ. Sci. Technol., 2001, 35, 4691–4696 CrossRef CAS PubMed.
- X. Y. Li and S. F. Yang, Water Res., 2007, 41, 1022–1030 CrossRef CAS PubMed.
- K. Luo, Q. Yang, X. M. Li, S. Y. Zhang, Y. Pang, X. Li and X. S. Liao, Appl. Biochem. Biotechnol., 2015, 176, 2346–2357 CrossRef CAS PubMed.
- K. Xiao, Y. Chen, X. Jiang, Q. Yang, W. Y. Seow, W. Zhu and Y. Zhou, Water Res., 2017, 109, 13–23 CrossRef CAS PubMed.
- B. Frolund, R. Palmgren, K. Keiding and P. H. Nielsen, Water Res., 1996, 30, 1749–1758 CrossRef.
- B. Frolund, T. Griebe and P. H. Nielsen, Appl. Microbiol. Biotechnol., 1995, 43, 755–761 CrossRef CAS PubMed.
- Y. J. Ma, C. W. Xia, H. Y. Yang and R. J. Zeng, Water Res., 2014, 50, 171–178 CrossRef CAS PubMed.
- M. Ruiz-Hernando, F. X. Simon, J. Labanda and J. Llorens, Chem. Eng. J., 2014, 255, 14–22 CrossRef CAS.
- G. H. Feng, L. Y. Liu and W. Tan, Ind. Eng. Chem. Res., 2014, 53, 11185–11192 CrossRef CAS.
- D. Q. He, L. F. Wang, H. Jiang and H. Q. Yu, Chem. Eng. J., 2015, 272, 128–134 CrossRef CAS.
- B. H. Chen, S. J. Lee and D. J. Lee, Water Res., 2005, 39, 4429–4435 CrossRef CAS PubMed.
- M. M. Abu-Orf and S. K. Dentel, J. Environ. Eng., 1999, 125, 1133–1141 CrossRef CAS.
- F. Chaari, G. Racineux, A. Poitou and M. Chaouche, Rheol. Acta, 2003, 42, 273–279 CAS.
- A. Ayol, S. K. Dentel and A. Filibell, Water Sci. Technol., 2006, 54, 17–22 CrossRef CAS PubMed.
- B. Bolto and J. Gregory, Water Res., 2007, 41, 2301–2324 CrossRef CAS PubMed.
- B. Ormeci, Water Res., 2007, 41, 1243–1252 CrossRef PubMed.
- P. S. Yen, L. C. Chen, C. Y. Chien, R. M. Wu and D. J. Lee, Water Res., 2002, 36, 539–550 CrossRef CAS PubMed.
- L. Wolny, P. Wolski and I. Zawieja, Desalination, 2008, 222, 382–387 CrossRef CAS.
| This journal is © The Royal Society of Chemistry 2017 |

