
 Open Access Article
 This Open Access Article is licensed under a
 Creative Commons Attribution 3.0 Unported Licence
A computational study on hydrogen storage in potential wells using K-intercalated graphite oxide
Jaehyun Baeab,
Dongwook Kimb,
Jong Hyun Jung b and
Jisoon Ihm*cb
b and
Jisoon Ihm*cb
aCenter for Correlated Electron Systems, Institute for Basic Science (IBS), Seoul 08826, Republic of Korea
bDepartment of Physics and Astronomy, Seoul National University (SNU), Seoul 08826, Republic of Korea
cDepartment of Physics, Pohang University of Science and Technology (POSTECH), Pohang 37673, Republic of Korea. E-mail: jihm1@postech.ac.kr; Fax: +82 54 279 3099; Tel: +82 54 279 2065
First published on 5th July 2017
Abstract
Using ab initio electronic structure calculations and grand canonical Monte Carlo simulations, we investigate the storage capacity of hydrogen molecules in a potential well created inside potassium-intercalated graphite oxide layers. We show that the binding energy of hydrogen located between layers of graphite oxide mainly originates from the dispersion interaction, and it is further increased slightly by induced dipole interactions. Its strength is fairly insensitive to the precise positions of the hydrogen molecules on the graphene plane, so the system may be described as a quasi-two-dimensional potential well. In this situation, the storage capacity is enhanced by the corresponding Boltzmann factor based on equilibrium thermodynamics. The trend of storage capacity with different geometries and chemical compositions of the scaffold materials is explained. With the present model, the density functional theory calculations and grand canonical Monte Carlo simulations predict a 2.5 wt% hydrogen storage capacity at room temperature at 10 MPa. For a model with increased potential depth, the storage capacity is predicted to increase up to 5.5 wt%.
Introduction
Hydrogen is considered to be a clean and sustainable future energy source,1 but storing hydrogen safely and efficiently under ambient conditions is a major obstacle in commercializing hydrogen fuel cell powered vehicles. Metal or chemical hydrides show high storage capacity2 but do not satisfy the requirements for the fast kinetics and reversibility. Metal–organic frameworks (MOFs) have been regarded as promising storage materials owing to their porosity, fast kinetics and reversibility,3,4 but high pressure and cryogenics are necessary for the adsorption process because of the weak adsorption energy of hydrogen molecules, mainly via van der Waals interactions (≈0.05 eV/H2). It has been found that the optimal binding energy for ambient condition storage (≈0.3 eV/H2) is realizable by introducing transition metal (TM) atoms into the MOFs.5,6 TM atoms are bound to the linker part of the MOFs and H2 molecules are adsorbed to the TM atoms through the so-called Kubas interaction.7 However, because of their high cohesive energy and reactivity, TM atoms tend to form clusters and are easily contaminated by other gas molecules. This hinders the experimental realization of the target for storage density set by the US Department of Energy (DOE) by the year 2020 (5.5 wt% and 40 g L−1).Recently, it has been shown that a class of material mostly based on pillared graphene layers has large surface areas, and the magnitude of the hydrogen binding energy to the material is increased by functionalization and alkali metal ion doping.8–14 For example, Deng et al. proposed alkali-doped pillared carbon materials to maximize reversible H2 storage and suggested a possible scheme to synthesize practical storage materials.8 Dimitrakakis et al. used lithium-doped 3-dimensional carbon nanostructures as a storage material and showed that the induced dipole interaction between H2 and doped lithium increases the volumetric storage capacity significantly.9 Tylianakis et al. studied the hydrogen storage capacity of lithium-doped graphite oxide, and explained that the storage capacity is closely related to the pore volume and the carbon to oxygen ratio of graphite oxide.10
In this study, we propose a storage mechanism based on the diffusive equilibrium between systems with different potentials and also suggest a storage material for the realization of this mechanism. The equilibrium condition of hydrogen inside and outside the material is μin = μout, where μ is the chemical potential of the hydrogen molecule. If the material can provide, to a first order approximation, a uniform potential well with a depth of V (<0) relative to the outside, we will show later that the gas density in the potential well becomes  times larger than that outside the potential well,15 where T is the temperature and kB is the Boltzmann constant. The exponential dependence of the density inside the material on V allows for practical room temperature storage with a relatively small potential depth (e.g. the enhancement factor,
 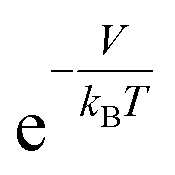 , turns out to be 100 for V = −0.12 eV at 25 °C). Since an experimental technique for tailoring a strict 3-dimensional (3D) attractive potential for a non-polar molecule is not available in practice, we searched for 2-dimensional (2D) materials that interact with hydrogen molecules with the desired binding strength. For example, if the interlayer distance, d (in the z-direction), of graphite is increased to twice the equilibrium distance between a H2 molecule and a single-layer graphene, then H2 can penetrate between the layers and it interacts with both the upper and lower layers. In this situation, the van der Waals (dispersion) interaction energy between H2 and two graphene layers can reach ≈−0.10 eV and the extra binding energy of only a few tens of meV is enough for practical room temperature storage. Furthermore, the van der Waals interaction is almost independent of the xy position of H2 on the graphene layer, so that the H2 molecules behave almost like a gas in 2D space as desired.16,17
To utilize the layered structure with enhanced d derived from graphite, we suggest potassium intercalated graphite oxide (KGO) as a possible storage material. In a recent experiment, it was reported that the d of graphite can be increased to 6–7 Å by oxidation, and further increased to 1 nm or more by potassium intercalation.18 In the experiment, graphite oxide (GO) was dispersed in KOH aqueous solution to expand the layers, and the GO was hydrothermalized to remove moisture.19 Although the proposed storage material here (KGO) is somewhat similar to other porous materials, the storage mechanism is very different. In our storage mechanism, the H2 molecules vigorously move around inside the potential well, which originated mainly from the H2–graphene layer interaction. This is clearly distinct from the H2 storage mechanism in the aforementioned study, where a hydrogen molecule binds at a particular binding site and the storage material (whether it is a MOF, any carbon-based material, or otherwise) is used to provide the scaffold structure to maintain the binding sites. In the material we propose, however, a more or less uniform potential in the void space is desirable to achieve gas-phase storage in the potential well.
Methods
We performed ab initio density functional theory (DFT) electronic structure and total energy calculations20,21 and obtained the H2 potential energy surface (PES) of the system. In the calculations, the generalized gradient approximation of Perdew et al.22 with Grimme-type23 van der Waals interaction correction was employed to describe the exchange–correlation energy in the Vienna ab initio simulation package (VASP).24 An energy cutoff of 400 eV was used for the projector-augmented wave pseudopotential basis set. In the atomic structure relaxation, the atomic configuration was adjusted until the Hellmann–Feynman force on each atom was less than 0.01 eV Å−1. To quantify the storage capacity of the materials at finite temperatures, we performed grand canonical Monte Carlo (GCMC) simulations. In the GCMC simulations, a hydrogen molecule was modelled as a single classical point particle, and the intermolecular (H2–H2) interaction was described by the Silvera–Goldman potential.25Results and discussion
Local atomic configurations and the chemical composition of KGO depend strongly on the synthesis conditions,26 and their precise determination in experiments is still difficult. On the theoretical side, there were efforts to search for structures of GO with various functional group coverage,27,28 but only a small set of configurations were examined in most cases due to computational limitations. After the calculation of atomic relaxations, we found that all oxygen atoms were strongly bound to carbon atoms and formed epoxy groups. Potassium atoms were attached near the oxygen atoms (Fig. 1). For computational simplicity, pillar molecules between the layers (which should exist in reality to maintain the interlayer distance, d) were ignored, and d was kept constant in the relaxation calculation.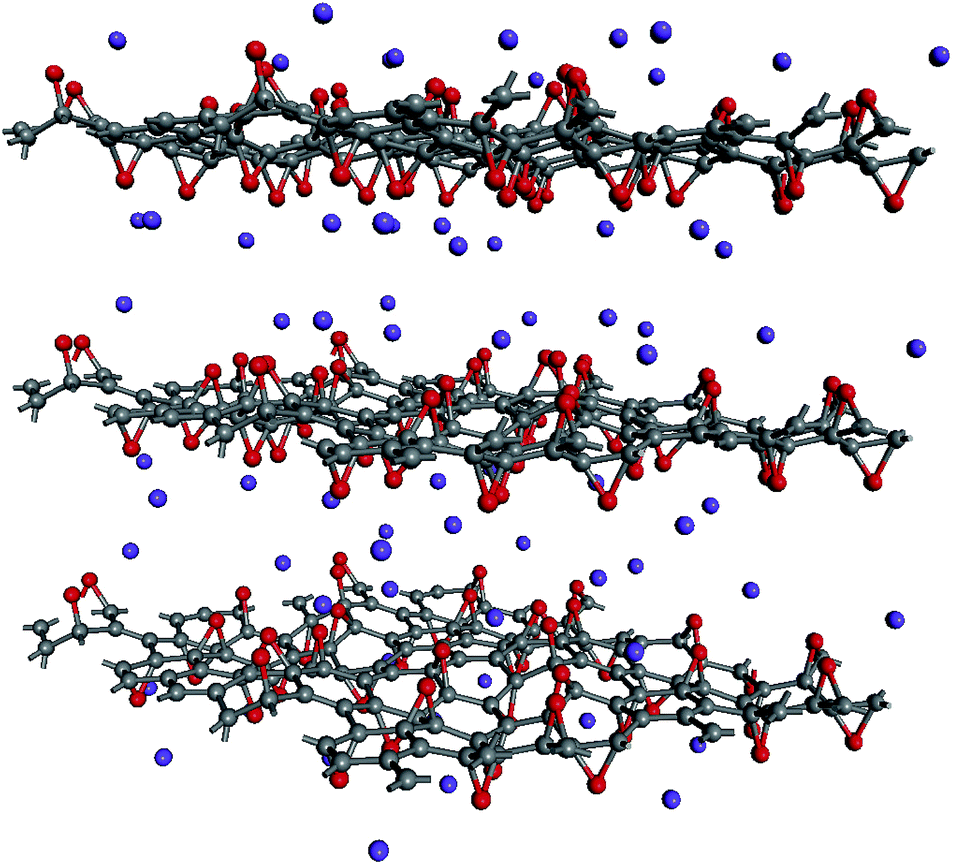 | ||
| Fig. 1 A model of the atomic structure of KGO. Gray, red and purple dots represent carbon, oxygen and potassium atoms, respectively. | ||
We define the potential energy of a H2 molecule as a function of its position in the space between layers as follows:
V(![[r with combining right harpoon above (vector)]](https://www.rsc.org/images/entities/i_char_0072_20d1.gif) ) = E[M + H2()] − E[M] − E[H2], ) = E[M + H2()] − E[M] − E[H2],
| (1) |
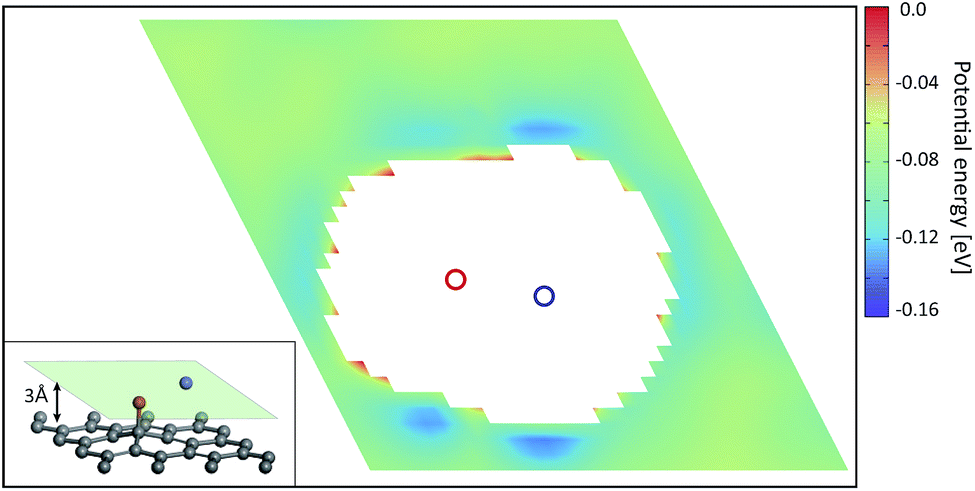
Fig. 2 shows the PES of KGO (the atomic configuration is displayed in the inset and its chemical formula is CO0.25K0.125, unless stated otherwise) with d = 10 Å in the plane parallel (x–y) to the graphene layer at z = 5 Å (green parallelogram in the inset). In the calculation, the x–y plane is partitioned into 30 × 30 grids parallel to the lattice vector of a unit supercell, and energy optimization is done with the constraint of the centers of the H2 molecules kept fixed at each grid point. The PES of the arbitrary points is obtained by spline interpolation. The regions of positive potential energy (thus inaccessible to the H2 molecules) are represented in white color. It is clearly seen from Fig. 2 that the potential energy is relatively uniform in the plane, except in the regions close to the oxygen and potassium atoms. The enhancement and uniformity of the attractive interaction are especially remarkable in the region denoted by a dashed parallelogram in Fig. 2. The average depth of the attractive potential well in this region reaches −0.12 eV, and this region provides an efficient hydrogen diffusion pathway.
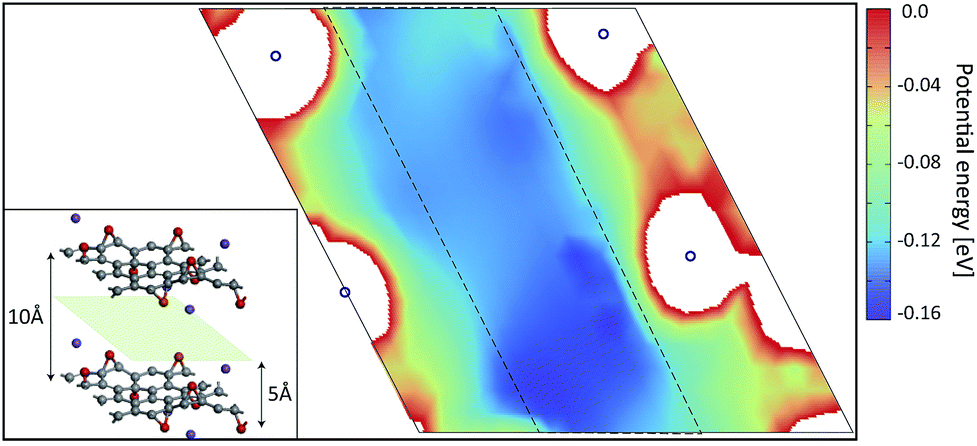 | ||
| Fig. 2 The potential energy surface of KGO with d = 10 Å in the plane passing through the center of two graphene layers (the light green parallelogram in the inset). The region of positive potential energy is shown in white color. The positions of 4 potassium atoms are denoted by blue circles. The inset shows the atomic configuration of the unit supercell in the ab initio calculation. | ||
In order to understand the reason for the potential strength enhancement by the epoxy groups and intercalated potassium ions, we also calculated the PES of the simplest building block of KGO, i.e. a single potassium-attached epoxy (K-epoxy) group on the 4 × 4 graphene supercell. Fig. 3 shows the PES in the plane at z = 3 Å (the light parallelogram in the inset). The average potential energy of the accessible region (where V < 0) at the plane 3 Å above the graphene layer is −83 meV, which is 23 meV stronger than that of the pristine graphene layer (−60 meV, via van der Waals interaction only). The deepest potential well near the potassium ion reaches −0.16 eV. The enhancement of the attractive potential by functionalization is attributed to the induced dipole interactions of H2 with the electric field generated by oxygen atoms or potassium ions (and minute orbital hybridization).10,29 According to atomic charge analysis,30 a potassium atom donates nearly one electron to graphene and the epoxy group, and becomes a positive ion (K+). The magnitude of the electric field at the position of the largest potential is 1.78 V Å−1, and we can estimate roughly that the largest contribution of the induced dipole interaction to the binding energy (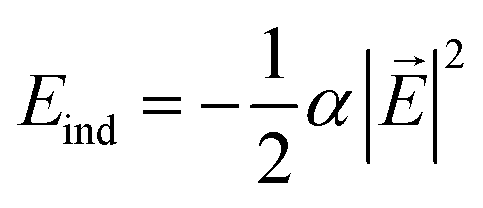 , where α is the polarizability of the H2 molecule) is −0.11 eV (the average contribution is a few tens of meV).
 | ||
| Fig. 3 The potential energy surface of a 4 × 4 graphene supercell with a potassium-attached epoxy group. The plane of the plot is parallel with and 3 Å above the graphene layer (the light green parallelogram in the inset). The region of positive potential energy is shown in white color. The positions of the oxygen and potassium atoms are denoted by red and blue circles, respectively. The inset shows the atomic configuration of the unit supercell in the ab initio calculation. | ||
Using the PES obtained by ab initio calculations, we modelled the effective potentials used in the GCMC simulation. The interaction between a hydrogen molecule and KGO is assumed to be the sum of the potentials contributed to by each constituent of KGO, i.e. the graphene layer, the epoxy group or the potassium-attached epoxy group (K-epoxy):
 | (2) |
) is the interaction potential between H2 and the graphene layers, VH2–O( −O,i) is the potential between H2 and the ith epoxy group, and VH2–KO( − KO,i) is the potential between H2 and the ith K-epoxy group. The interactions between H2 and the epoxy/K-epoxy/carbon are described by the Lennard-Jones potential, 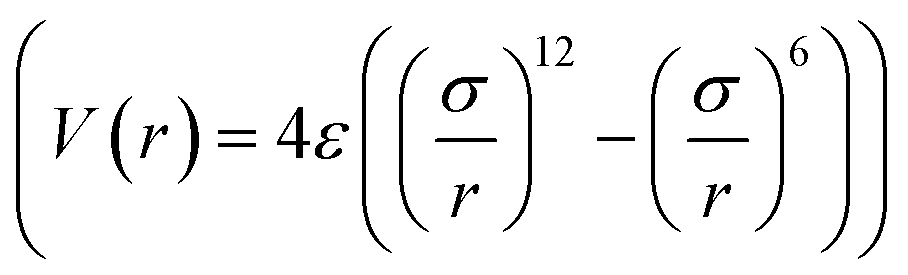 , where rcutoff is the cutoff distance. In minimizing the total (integrated) deviation of the Lennard-Jones potentials from the ab initio potentials, we used the local weighting factor, exp[−Vab()/kBT], because reproducing low potential regions is more important than reproducing high potential regions. The parameters obtained from this procedure are listed in Table 1. The PES on the cross section between two adjacent KGO layers, obtained from ab initio calculations, is shown in Fig. 4(a), and the one obtained from the parameterized Lennard-Jones potentials is shown in Fig. 4(b), which reproduces Fig. 4(a) reasonably well (within 0.03 eV deviation in most regions).
 , for A = epoxy, K-epoxy, and carbon
| A | εH2–A [meV] | σH2–A [Å] |
|
|---|---|---|---|
| Carbon | 5.4 | 2.97 | 6.0 |
| Epoxy | 11.0 | 2.70 | 7.0 |
| K-Epoxy | 60.0 | 2.50 | 7.0 |

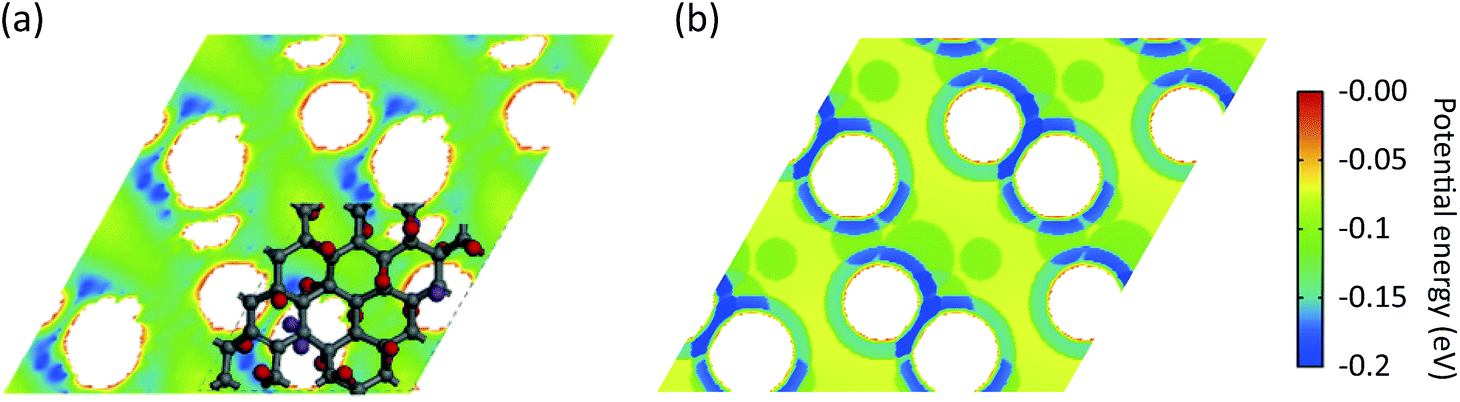 | ||
| Fig. 4 (a) The potential energy experienced by H2 in the plane passing through the center between two KGO layers separated by 9 Å, using ab initio calculations. (b) The same potential energy surface obtained from Lennard-Jones potentials optimally fitted to the ab initio calculations in (a). | ||
The GCMC simulation results of the gravimetric storage capacity as a function of the pressure (P ≤ 10 MPa at 300 K) of KGO with different d values are shown in Fig. 5. The isotherms of KGO with three different d values (d = 8, 9 and 10 Å) show similar behavior, but it was noticed that when d = 10 Å, the highest storage capacity is shown among the three different d values as the external pressure increases. The gravimetric storage density reaches 2.5 wt% at 10 MPa. The storage capacity of KGO with d = 7 Å is smaller than that of the others in the whole range of pressure. The trend in storage capacity can be explained in terms of the density enhancement factor and the accessible volume, Vacc (with negative potential energy), inside the KGO layers. The interlayer distance is one of the key factors in determining these two values by changing the H2 PES and the volume of the void space inside KGO. Since the accessible volume is of major importance in high pressure storage, increasing the interlayer distance results in the increase of storage capacity at 10 MPa. However, as far as the present structure of KGO is concerned, if we increase d further, beyond 10 Å, the capacity ceases to increase because the dispersion interaction decreases when the interlayer distance becomes too large. With the present atomic structure of KGO, the gravitational storage density at room temperature reaches 2.5 wt% at 10 MPa. We will explain later that the storage capacity can increase up to 5.5 wt% with a different choice of uniform average potential, VEFF. In the following discussion, we will explain how the PES and the accessible volume determine the storage capacity in detail.
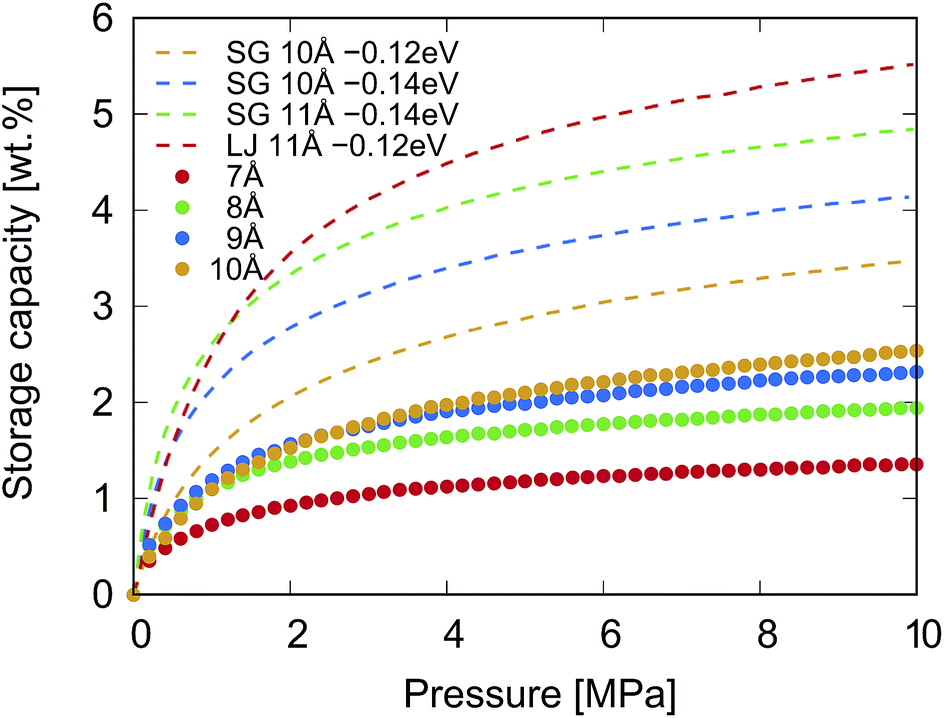 | ||
| Fig. 5 The dotted curves represent the calculated gravimetric storage capacity of KGO (CO0.25K0.125) with different d values at 300 K. The interaction between H2 and KGO was described by Lennard-Jones potentials, and that between H2 molecules was described by the Silvera–Goldman potential. The dashed curves represent the structural model with a given uniform potential, VEFF, as explained in the text. The interaction between H2 molecules was due to either the Silvera–Goldman potential (SG) or the Lennard-Jones potential (LJ). The dashed curves, representing the capacity with uniform potential, were reprinted with permission from ref. 19, copyright 2016, Elsevier. | ||
The interaction between hydrogen and KGO gives rise to the formation of the relatively uniform attractive potential well between KGO layers, and the equilibrium hydrogen density inside KGO, nin, is much higher than that outside KGO (the H2 reservoir), nout. For an ideal gas, the local equilibrium density enhancement at position follows the Boltzmann factor, 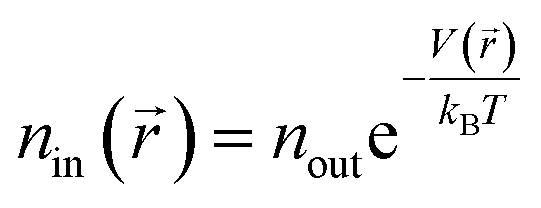 , as mentioned before. The average density enhancement factor,
 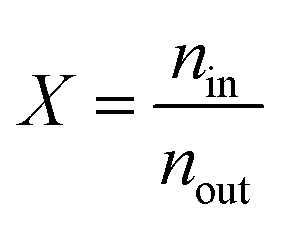 , is given by
 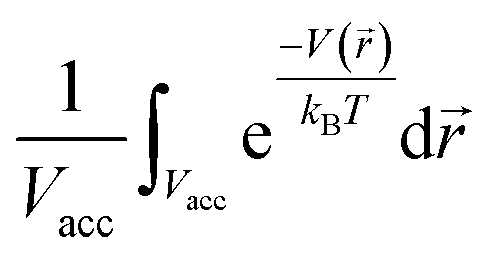 . In the case of a uniform potential, V() = V0, and X is given by
 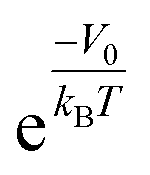 as stated in the introduction. For a non-ideal gas, however, the contribution of intermolecular interactions to the chemical potential inside the material (μint(nin)) is not negligible and should be taken into account to obtain the correct density enhancement. nin is determined by solving the chemical potential equality inside and outside KGO:
| μkin(nin) + VEFF + μint(nin) = μ(nout). | (3) |
Outside the storage material, the H2–H2 interaction is sufficiently small as long as we are interested in the pressure, P ≤ 10 MPa, at room temperature. We make an ideal gas approximation that μ(nout) = kBT![[thin space (1/6-em)]](https://www.rsc.org/images/entities/char_2009.gif) log(noutλ3), where λ is the thermal wavelength (
log(noutλ3), where λ is the thermal wavelength ( , where h is the Planck constant and m is the mass of the H2 molecule). The contribution to μ from rotational and vibrational motion is not included here and will be discussed later. In eqn (3), the kinetic energy contribution to μ inside the storage material has the same expression as outside, μkin(nin) = kBTlog(ninλ3). We separate the chemical potential contribution from the external potential and intermolecular interaction into two parts (VEFF + μint(nin)):
 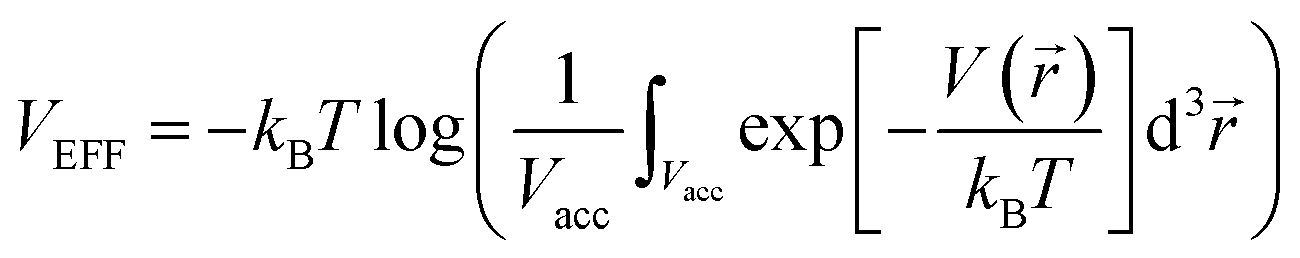 is the effective external potential for an ideal gas, and
 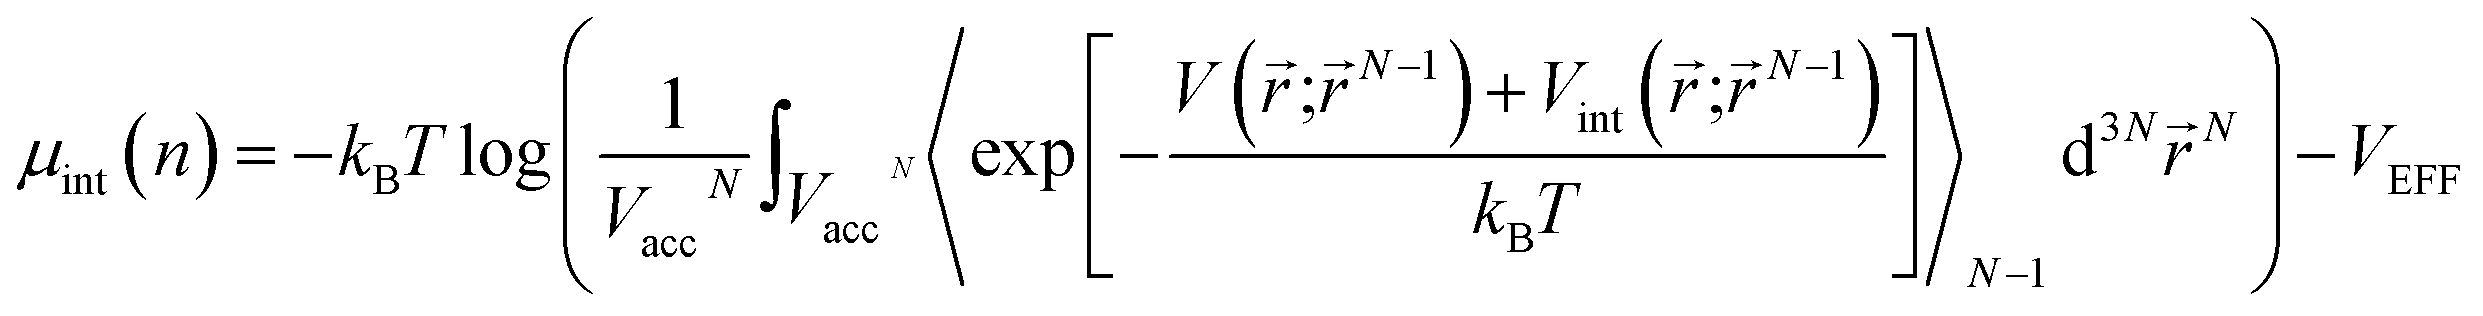 is the chemical potential from intermolecular interaction.16,31 N is the number of particles in volume Vacc (N = nVacc), 〈…〉N denotes the canonical ensemble average over the configuration space of the N − 1 particle system and V(int)(;N−1) is the external (interaction) potential between a particle at and other N − 1 particles at N − 1 particle configuration space, N−1 = (1, 2,…,N−1). Silvera–Goldman potentials are used for Vint(;N−1).25 If we were to adopt a more attractive H2–H2 interaction than Silvera–Goldman, the enhancement factor and the corresponding storage capacity would further increase. Fig. 6 shows a graphical solution of eqn (3) and the density enhancement as a function of the H2 pressure in the outside reservoir. For example, if the H2 pressure outside KGO is 5 MPa (the green dot in Fig. 6(a)), the chemical potential is ≈−0.2 eV. The corresponding H2 density inside the KGO layer (the solution of eqn (3)) is ≈0.03 Å−3 (the red dot in Fig. 6(a)) and the density enhancement factor, X, at room temperature (T = 300 K) is ≈24. Not all of the space inside the KGO layer is available for storage, because the strong repulsive interaction between H2 molecules and the functional groups prohibits hydrogen molecules from approaching the region of positive potential near the functional groups. Storage capacity is essentially the product of three quantities: the density in the outside KGO layer, the volume of the space of negative potential inside the KGO layer, and the density enhancement factor due to the negative potential, i.e. the storage capacity = cnoutXVacc. The proportionality constant, c, is related to the mass density of KGO.
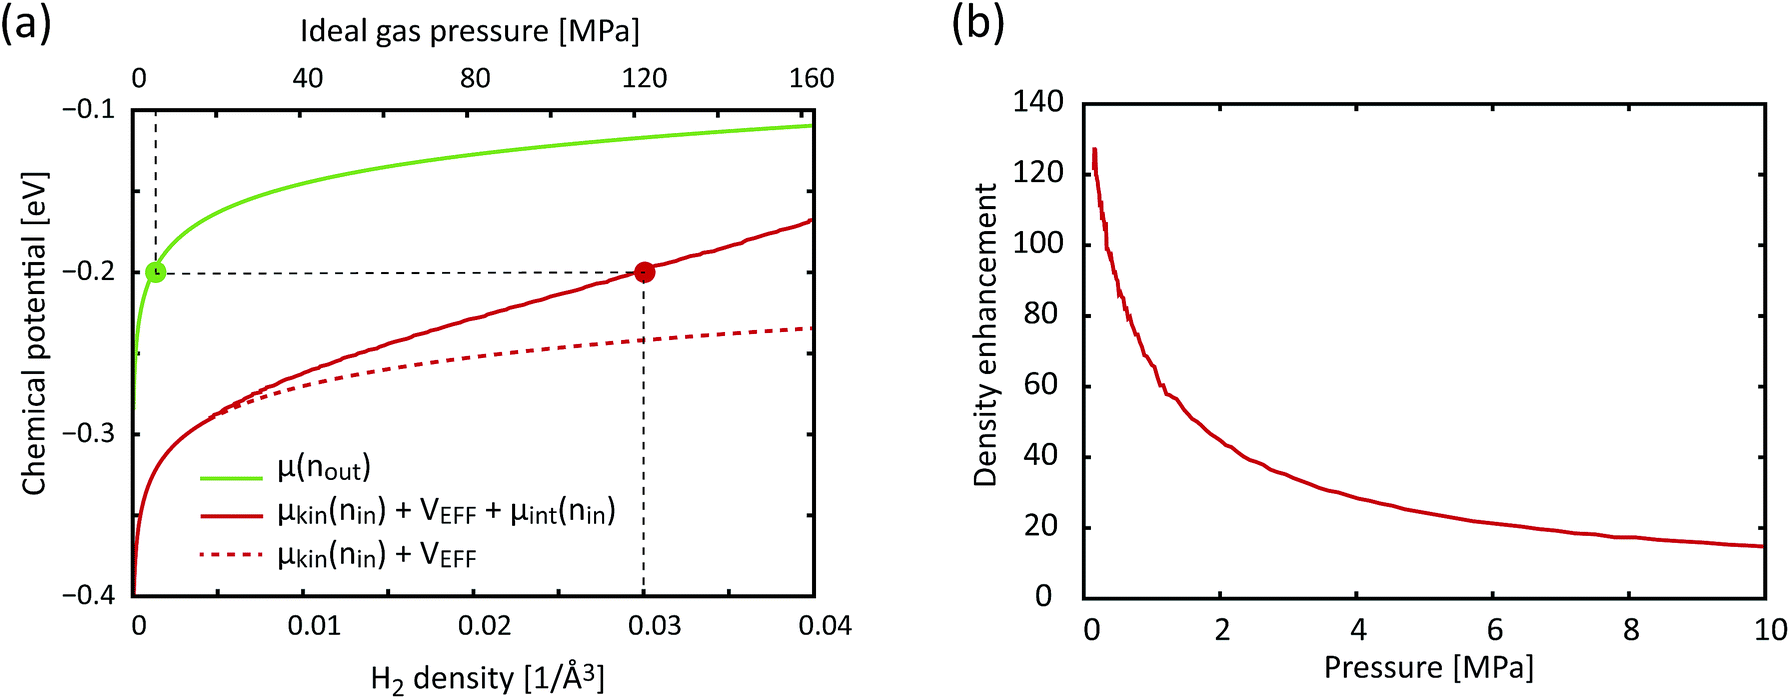 | ||
| Fig. 6 (a) The chemical potential as a function of the H2 density (lower x-axis), outside (green curve, RHS of eqn (3)) and inside (solid red curve, LHS of eqn (3)) KGO, with d = 10 Å. For comparison, the dashed red curve represents the chemical potential inside the KGO layer under the ideal gas assumption. The upper x-axis is the ideal gas pressure corresponding to the gas density on the lower x-axis. (b) The density enhancement factor, X, as a function of the H2 pressure outside the KGO layer. T = 300 K in all cases. | ||
At a very low pressure (≲1 MPa), the hydrogen density both inside and outside KGO is so low that the average intermolecular distance is larger than the H2–H2 interaction range. In this case, the hydrogen molecules behave like an ideal gas and the contribution of intermolecular interactions to the chemical potential is very small. The chemical potential difference between the interacting gas (solid red curve) and the ideal gas inside (dashed red curve) the KGO layer is very small (Fig. 6(a)), and the corresponding density enhancement factor is approximately given by  (Fig. 6(b)). Thus the storage capacity is linearly related to pressure, and its slope is proportional to
  . Based on this argument, we will explain the isotherms in Fig. 5. The initial slope of the isotherm for KGO with d = 8 Å is the steepest among the four cases (d = 7, 8, 9 and 10 Å). This indicates that |VEFF| is largest when d = 8 Å, because 8 Å is about twice the equilibrium distance between the hydrogen molecule and a single layer of KGO; the hydrogen molecules interact with both the upper and lower layers. The magnitude of VEFF for KGO with d = 7 Å is similar to that for KGO with d = 8 Å, but Vacc for d = 7 Å is smaller than Vacc for d = 8 Å, so the storage capacity for d = 7 Å is smaller than that for d = 8 Å. Although Vacc for d = 8 Å is less than that for d = 9 Å or d = 10 Å, the storage capacity depends linearly on Vacc but exponentially on VEFF, so that increasing |VEFF| is more effective for low pressure storage.
At a higher external pressure, however, the contribution of the repulsive intermolecular interaction to the chemical potential is substantial. In this case, the total effective potential (VEFF + μint) becomes less attractive, and the density enhancement factor gets smaller. Here, a larger Vacc becomes a more important factor than in the lower pressure case, and a larger d creates a larger Vacc inside the layers, leading to a higher storage capacity. Fig. 7(a) presents a snapshot of the GCMC simulation for KGO with d = 10 Å. A quasi-2D bilayer structure of the distribution of hydrogen molecules (indicated by two arrows in Fig. 7(b)) is formed in d = 10 Å KGO layers, and the distance between the two hydrogen molecule layers is in the range of the attractive H2–H2 interaction.
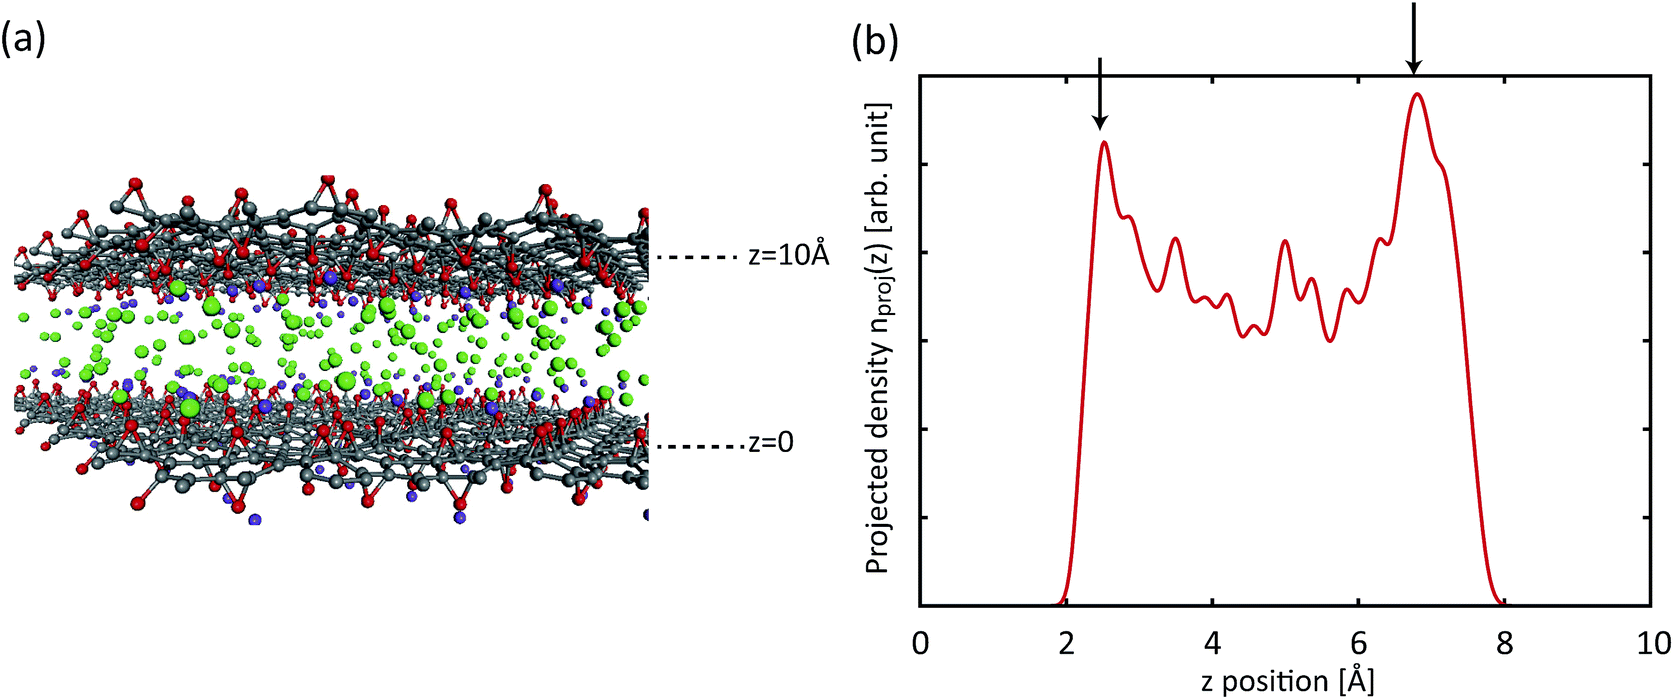 | ||
Fig. 7 (a) A snapshot of the grand canonical Monte Carlo simulation after reaching equilibrium. Gray, red, purple and green dots represent carbon, oxygen, potassium and hydrogen molecules, respectively. (b) The z-axis-projected density of hydrogen molecules, 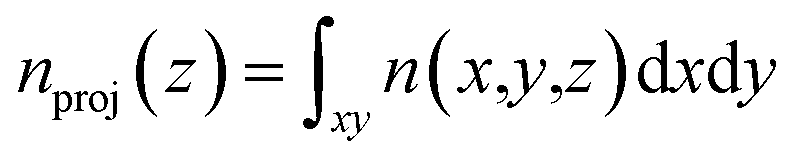 , between two KGO layers located at z = 0 and z = 10 Å. Peak positions in the distribution of hydrogen molecules are indicated by arrows. , between two KGO layers located at z = 0 and z = 10 Å. Peak positions in the distribution of hydrogen molecules are indicated by arrows. | ||
In the dense hydrogen environment, an epoxy group may be reduced to a hydroxyl group.32,33 The binding energy (or PES) between a hydrogen molecule and a hydroxyl group is similar to that between a hydrogen molecule and an epoxy group. Because of the strong bond between the epoxy group and a K ion (2.5 eV), the migration of a K ion from the epoxy group to the hydroxyl group is unfavorable and the K ions remained near the epoxy groups, so the interaction between the hydrogen molecule and the storage material is hardly changed by the reduction.
We then decided to examine another aspect of the storage material, namely the influence of the coverage of functional groups on the storage capacity. We calculated the hydrogen storage capacity of KGO with d = 10 Å for different functional group densities. Fig. 8 shows the computational results with different functional group coverages: C32O4K2, C32O8K4, C32O12K6 and C32O16K8. Since the epoxy and K-epoxy groups increase the magnitude of VEFF (Fig. 3), the gravimetric storage capacity increases as the functional group density increases in the low pressure range (P ≤ 2 MPa). However, the isotherms of KGO at higher pressures show that the storage capacity cannot be increased further by too high a functional group coverage. The increase in the weight of the functional groups and the expansion of the volume of the steric hindrance region are responsible for the decrease in storage capacity. For the reasons mentioned above, we found that the C32O8K4 case (whose coverage is 1 K atom per 4 unit cells of graphene, or 1 K atom per 20.96 Å2) is the optimal condition for hydrogen storage, and its storage capacity reaches 2.5 wt% at 10 MPa and room temperature.
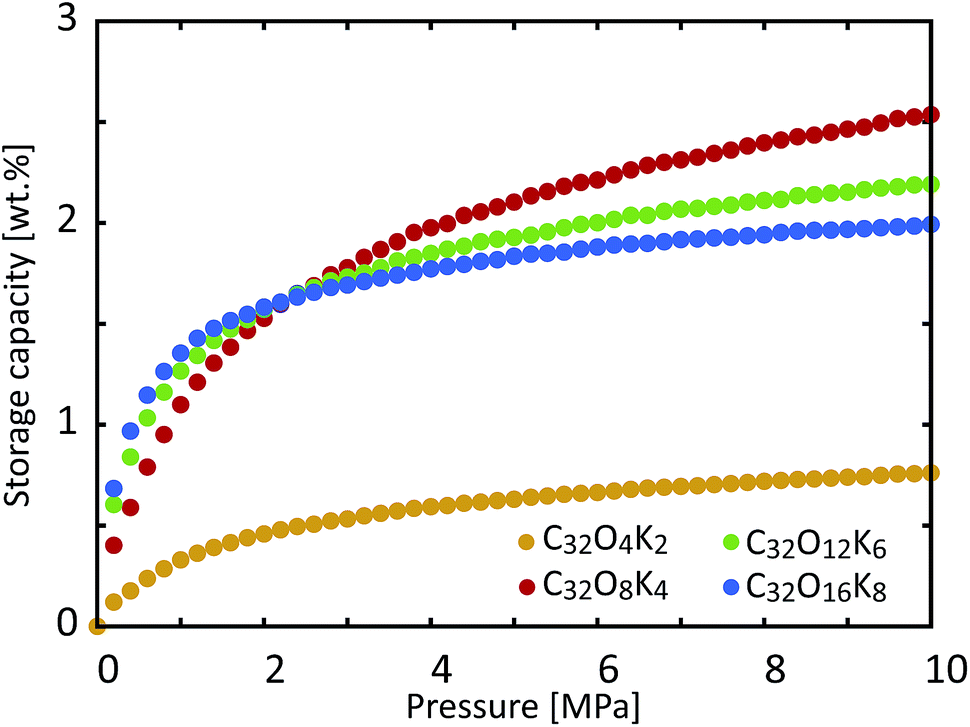 | ||
| Fig. 8 Room temperature storage capacity of KGO with d = 10 Å for different functional group coverages: C32O4K2, C32O8K4, C32O12K6 and C32O16K8. | ||
In the GCMC simulations, we calculated the thermodynamic quantities under the classical point particle approximation. In this approximation, we replaced the quantum mechanical partition function  with phase-space integration (
 , where (N,
![[p with combining right harpoon above (vector)]](https://www.rsc.org/images/entities/i_char_0070_20d1.gif) N) represents the position and momentum coordinates in the N-particle phase-space) and ignored the vibrational and rotational degrees of freedom of the diatomic molecule. The quantum mechanical correction due to confinement in the z-direction was considered by directly solving the single particle Schrödinger equation in the z-direction. The PES of the hydrogen molecule inside KGO with d = 10 Å (Fig. 2) was used as an example of our quantitative analysis. Our calculation of the partition function for the quantum point particle turned out to be slightly lower (≈3%) than that of the classical point particle, indicating that the classical single particle approximations slightly overestimate the storage capacity. Although the vibrational modes are not excited at room temperature due to the large vibrational energy (hν) compared to kBT, the zero point energy
N) represents the position and momentum coordinates in the N-particle phase-space) and ignored the vibrational and rotational degrees of freedom of the diatomic molecule. The quantum mechanical correction due to confinement in the z-direction was considered by directly solving the single particle Schrödinger equation in the z-direction. The PES of the hydrogen molecule inside KGO with d = 10 Å (Fig. 2) was used as an example of our quantitative analysis. Our calculation of the partition function for the quantum point particle turned out to be slightly lower (≈3%) than that of the classical point particle, indicating that the classical single particle approximations slightly overestimate the storage capacity. Although the vibrational modes are not excited at room temperature due to the large vibrational energy (hν) compared to kBT, the zero point energy  can contribute to the partition function. The calculated vibrational energy of the H2 molecule at the energy minimum position of KGO with d = 10 Å (Fig. 2) is 527.5 meV, which is 5.5 meV lower than that of a free H2 molecule. The softening of the H2 vibration mode (ΔEvib < 0) leads to an increase in the partition function inside KGO by
 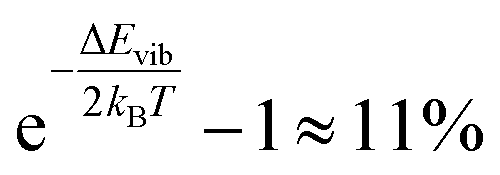 at room temperature.17,34
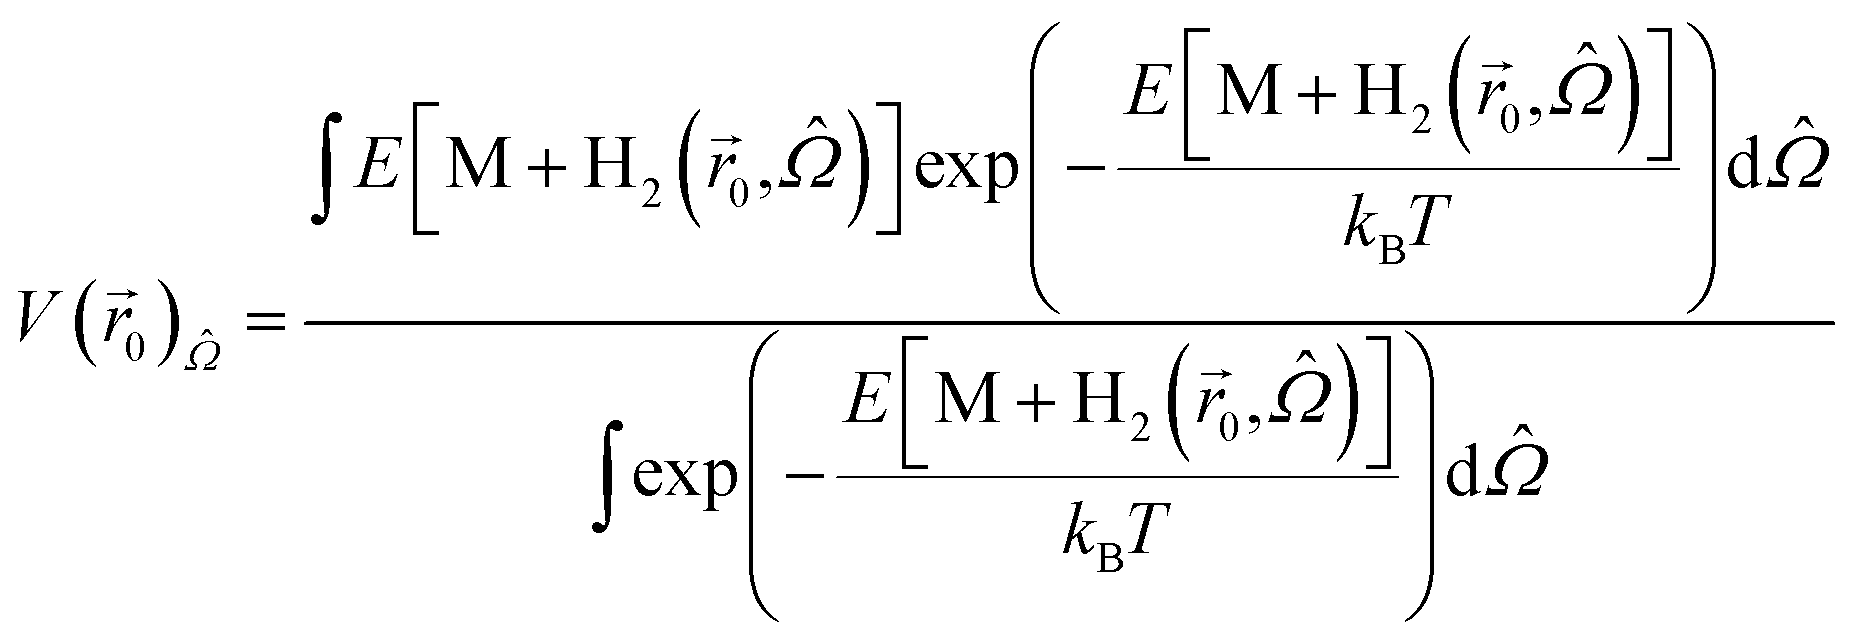
In the definition of the PES (eqn (1)), we assumed that the direction of the H2 molecule is fully relaxed to the minimum energy configuration, i.e. E[M + H2()] ≡ Min![[capital Omega, Greek, circumflex]](https://www.rsc.org/images/entities/i_char_e1e5.gif) E[M + H2(,)] (where (θ,φ) is the direction of the H2 molecule and E[M + H2(,)] is the total energy of the storage material M and H2 molecules). In order to account for the decrease of the partition function due to rotational motion of the H2 molecule with respect to the direction of the minimum energy, we computed the angle () dependent energy, E[M + H2(,)], at position 0 near the energy minimum position of the same system used in the vibrational motion analysis above, and obtained the angle averaged potential energy,
E[M + H2(,)] (where (θ,φ) is the direction of the H2 molecule and E[M + H2(,)] is the total energy of the storage material M and H2 molecules). In order to account for the decrease of the partition function due to rotational motion of the H2 molecule with respect to the direction of the minimum energy, we computed the angle () dependent energy, E[M + H2(,)], at position 0 near the energy minimum position of the same system used in the vibrational motion analysis above, and obtained the angle averaged potential energy,
 0)rot (=V(0) − V(0)), is 2.6 meV, so the rotational motion of the H2 molecule reduces the partition function inside KGO by
 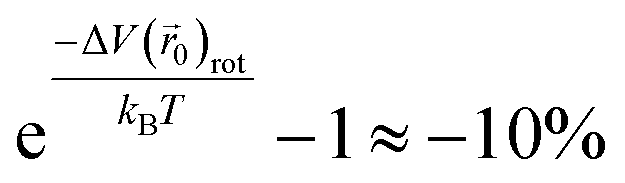 . The net correction to the partition function from the above three contributions is ≈−3% (=0.97 × 1.11 × 0.9), and this means that the single particle assumption of the H2 molecule in the classical picture is still valid in the context of the storage capacity calculation.
Previously, people attempted to decorate storage materials with various TM atoms, but the clustering of TM atoms posed a serious synthesis problem.35,36 The present system is free from metal atom clustering; the K ions are prevented from clustering by the repulsive electrostatic interaction between the positively charged potassium ions. Our calculations show that the binding energy between the potassium atom and the epoxy group (2.5 eV) is larger than the cohesive energy of potassium (1.0 eV), and the configuration of separated potassium atoms is more stable than that of aggregated ones.
So far, we have investigated in detail the hydrogen storage capacity of a particular structure of KGO. The calculated room-temperature storage capacity of 2.5 wt% at 10 MPa is better than most storage materials using the physisorption of H2 molecules, but is still not satisfactory for practical applications. It is noteworthy that the storage capacity depends on the atomic constituents and structures. To make more general predictions (possibly with different potential strengths) of the storage capacity and determine the range of the storage capacity using the present mechanism (storage in the potential well in the H2 gas form), we also performed GCMC simulations using different potential strengths between H2 and the scaffold materials, VEFF. The storage capacity for a given uniform average potential strength, VEFF, is juxtaposed with the results presented before as dashed curves in Fig. 5. For the cases of VEFF = − 0.12 and −0.14 eV with d = 10 Å, the gravimetric density at 10 MPa and 300 K reaches about 3.5 and 4.2 wt% respectively with the Silvera–Goldman H2–H2 interaction. If d becomes 11 Å with VEFF = −0.14 eV, the capacity further increases to 4.8 wt%. There also exists a dependence of storage capacity on the choice of H2–H2 interaction: the Lennard-Jones potential gives about 5.5 wt% for d = 11 Å with VEFF = −0.12 eV. Some of the results (dashed curves) were previously reported in the literature.19 These results indicate that there is significant room for enhancement of the storage capacity using other atoms or molecules for intercalation, which can provide different VEFF or d values. We note that the storage capacity increases rapidly with potential strength, since the capacity essentially depends on it exponentially. One should be cautioned, however, that such a sensitive dependence sets a certain limit on the accuracy of the calculated storage capacity.
Conclusions
In summary, we proposed a novel hydrogen storage mechanism in the potential well inside the void space of porous materials, and showed that potassium-intercalated graphite oxide can provide such a void space with a negative potential to realize room temperature hydrogen storage. A relatively uniform potential well was found to be created between the layers and the origin of the enhanced attractive potential was closely examined. The dependence of the hydrogen storage capacity on the interlayer distance and the coverage of functional groups was explained in terms of the effective external potential and the corresponding density enhancement factor.Acknowledgements
This work was supported by the NRF funded by the MSIP of the Korean government (Grant No. 2006-0093853) and IBS-R009-D1. Computations were supported by the Korea Institute of Science and Technology Information.References
- L. Schlapbach and A. Züttel, Nature, 2001, 414, 353–358 CrossRef CAS PubMed
.
- B. Sakintuna, F. Lamari-Darkrim and M. Hirscher, Int. J. Hydrogen Energy, 2007, 32, 1121–1140 CrossRef CAS
- L. J. Murray, M. Dincă and J. R. Long, Chem. Soc. Rev., 2009, 38, 1294–1314 RSC
- M. P. Suh, H. J. Park, T. K. Prasad and D.-W. Lim, Chem. Rev., 2011, 112, 782–835 CrossRef PubMed
- M. Dinca, A. Dailly, Y. Liu, C. M. Brown, D. A. Neumann and J. R. Long, J. Am. Chem. Soc., 2006, 128, 16876–16883 CrossRef CAS PubMed
- E. Durgun, S. Ciraci, W. Zhou and T. Yildirim, Phys. Rev. Lett., 2006, 97, 226102 CrossRef CAS PubMed
- G. J. Kubas, J. Organomet. Chem., 2001, 635, 37–68 CrossRef CAS
- W.-Q. Deng, X. Xu and W. A. Goddard, Phys. Rev. Lett., 2004, 92, 166103 CrossRef PubMed
- G. K. Dimitrakakis, E. Tylianakis and G. E. Froudakis, Nano Lett., 2008, 8, 3166–3170 CrossRef CAS PubMed
- E. Tylianakis, G. M. Psofogiannakis and G. E. Froudakis, J. Phys. Chem. Lett., 2010, 1, 2459–2464 CrossRef CAS
- J. W. Burress, S. Gadipelli, J. Ford, J. M. Simmons, W. Zhou and T. Yildirim, Angew. Chem., Int. Ed., 2010, 49, 8902–8904 CrossRef CAS PubMed
- S. S. Han and S. S. Jang, Chem. Commun., 2009, 5427–5429 RSC
- R. B. Getman, J. H. Miller, K. Wang and R. Q. Snurr, J. Phys. Chem. C, 2011, 115, 2066–2075 CAS
- E. Klontzas, A. Mavrandonakis, E. Tylianakis and G. E. Froudakis, Nano Lett., 2008, 8, 1572–1576 CrossRef PubMed
- C. Kittel and H. Kroemer, Thermal Physics, W. H. Freeman, New York, 2nd edn, 1980 Search PubMed
- R. S. Aga, C. L. Fu, M. Krčmar and J. R. Morris, Phys. Rev. B: Condens. Matter Mater. Phys., 2007, 76, 165404 CrossRef
- S. Patchkovskii, S. T. John, S. N. Yurchenko, L. Zhechkov, T. Heine and G. Seifert, Proc. Natl. Acad. Sci. U. S. A., 2005, 102, 10439–10444 CrossRef CAS PubMed
- H.-K. Jeong, Y. P. Lee, R. J. Lahaye, M.-H. Park, K. H. An, I. J. Kim, C.-W. Yang, C. Y. Park, R. S. Ruoff and Y. H. Lee, J. Am. Chem. Soc., 2008, 130, 1362–1366 CrossRef CAS PubMed
- T. H. Kim, J. Bae, T. H. Lee, J. Hwang, J. H. Jung, D. K. Kim, J. S. Lee, D. O. Kim, Y. H. Lee and J. Ihm, Nano Energy, 2016, 27, 402–411 CrossRef CAS
- P. Hohenberg and W. Kohn, Phys. Rev., 1964, 136, B864 CrossRef
- W. Kohn and L. J. Sham, Phys. Rev., 1965, 140, A1133 CrossRef
- J. P. Perdew, K. Burke and M. Ernzerhof, Phys. Rev. Lett., 1996, 77, 3865 CrossRef CAS PubMed
- S. Grimme, J. Comput. Chem., 2006, 27, 1787–1799 CrossRef CAS PubMed
- G. Kresse and J. Furthmüller, Phys. Rev. B: Condens. Matter Mater. Phys., 1996, 54, 11169 CrossRef CAS
- I. F. Silvera and V. V. Goldman, J. Chem. Phys., 1978, 69, 4209–4213 CrossRef CAS
- K. A. Mkhoyan, A. W. Contryman, J. Silcox, D. A. Stewart, G. Eda, C. Mattevi, S. Miller and M. Chhowalla, Nano Lett., 2009, 9, 1058–1063 CrossRef CAS PubMed
- R. Lahaye, H. Jeong, C. Park and Y. Lee, Phys. Rev. B: Condens. Matter Mater. Phys., 2009, 79, 125435 CrossRef
- D. W. Boukhvalov and M. I. Katsnelson, J. Am. Chem. Soc., 2008, 130, 10697–10701 CrossRef CAS PubMed
- M. C. Nguyen, M.-H. Cha, K. Choi, Y. Lee and J. Ihm, Phys. Rev. B: Condens. Matter Mater. Phys., 2009, 79, 233408 CrossRef
- G. Henkelman, A. Arnaldsson and H. Jónsson, Comput. Mater. Sci., 2006, 36, 354–360 CrossRef
- D. Frenkel and B. Smit, Understanding Molecular Simulation: From Algorithms to Applications, Academic Press, San Diego, Calif, 2nd edn, 2001 Search PubMed
- C. Robledo, M. Rojas, O. Camara and E. Leiva, Int. J. Hydrogen Energy, 2014, 39, 4396–4403 CrossRef CAS
- A. Sigal, M. Villarreal, M. Rojas and E. Leiva, Int. J. Hydrogen Energy, 2014, 39, 5899–5905 CrossRef CAS
- C. P. Herrero and R. Ramírez, Phys. Rev. B: Condens. Matter Mater. Phys., 2010, 82, 174117 CrossRef
- A. Sigal, M. Rojas and E. Leiva, Phys. Rev. Lett., 2011, 107, 158701 CrossRef CAS PubMed
- J. Hwang, C. Park, K. Choi, M.-H. Cha, R. Ahuja, D. W. Kim, D. O. Kim, K. Sagong, U. G. Joung and H. Jeong, Nano, 2012, 7, 1250044 CrossRef
| This journal is © The Royal Society of Chemistry 2017 |