 Open Access Article
Amino acid-modified graphene oxide magnetic nanocomposite for the magnetic separation of proteins†
Min Yan ,
Qionglin Liang*,
Wei Wan,
Qiang Han,
Siyuan Tan and
Mingyu Ding*
The Key Laboratory of Bioorganic Phosphorus Chemistry & Chemical Biology, Ministry of Education, Department of Chemistry, Tsinghua University, Beijing 100084, China. E-mail: dingmy@mail.tsinghua.edu.cn; liangql@mail.tsinghua.edu.cn; Tel: +86-10-62797087 Tel: +86-10-62772263
First published on 9th June 2017
Abstract
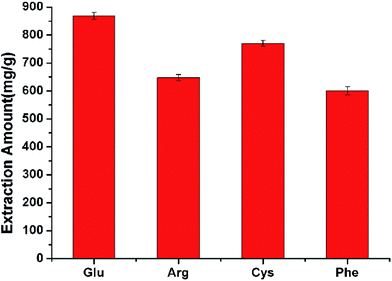
A novel amino acid-modified graphene oxide magnetic nanocomposite was successfully synthesized for the magnetic separation of proteins. The extraction capacity was influenced by several parameters including the type of amino acid, the solution pH value, the addition of electrolyte, the extraction time and the protein concentration. The nanocomposite showed excellent extraction capacity for bovine hemoglobin (868.3 mg g−1). By adsorbing bovine hemoglobin, bovine serum albumin, ovalbumin and lysozyme, the nanocomposite had a better performance than magnetic graphene oxide in the extraction of bovine hemoglobin and lysozyme, owing to the intensive electrostatic interaction. The proposed nanocomposite could be easily recycled and reused more than three times. Moreover, the proposed method was successfully applied to selectively extract bovine hemoglobin in acid protein mixtures and real samples.
1. Introduction
Protein is an important material basis of life and is closely linked to various forms of life activity.1 As protein is the direct manifestation of life phenomena, the analysis of protein is of great significance in the field of life science. However, protein is usually present in a complex sample matrix, which causes significant interference in its detection.2 Moreover, the disturbance of other different proteins is a challenge that particularly needs to be addressed. Consequently, sample clean-up, separation and enrichment are necessary before protein analysis.Recently, magnetic separation has attracted widespread attention due to its unique advantages.3–5 Compared to conventional solid-phase extraction (SPE), the magnetic materials do not need to be packed into the cartridge, which avoids the problem of column clogging encountered in SPE. In addition, the phase separation of magnetic materials is much more conveniently performed by applying an external magnetic field,6 so that magnetic adsorbents can be easily recycled.7,8 Furthermore, the magnetic nanocomposites have a large specific surface area, so extraction and separation can be attained with only a small amount of adsorbents and a shorter equilibration time, improving the extraction capacity and efficiency.9,10 Consequently, magnetic separation is a simple, rapid and low-cost technique that requires no cumbersome operation and offers high extraction efficiency, and is widely used in sample pretreatment procedures.11–13
Graphene (G) is a novel carbon-based material with two-dimensional properties.14 It has attracted a great amount of research interest because of its physical and chemical properties such as extraordinary electrical conductivity, and excellent thermal and mechanical qualities.15–18 In addition, graphene has been widely used in sample pretreatment owing to its large specific surface area, good dispersibility and hydrophobicity.19,20 Graphene oxide (GO), the oxidation product of graphene, is considered to be an ideal adsorbent material in analytical chemistry.21 On one hand, GO still maintains the basic framework of graphene, which means it has a huge surface area. On the other hand, there are many oxygenated groups on the surface of GO, such as epoxy, hydroxyl and carboxyl, making GO more hydrophilic.22 Furthermore, the functional groups can form hydrogen bonding and electrostatic interactions with adsorbates, and can tune the adsorption properties of specific adsorbates via functional modification.23 Therefore, GO has potential for sample pretreatment. However, it is difficult to separate GO from aqueous solution, which limits its direct use in sample pretreatment. To overcome this drawback, graphene hybrid materials have become the research focus. Magnetic GO possesses high adsorption capacity and can be easily separated by an external magnetic field, which indicates good potential in magnetic separation applications.24 Recently, magnetic GO has been applied as the sorbent for organic compounds,25 heavy metal ions,26 phosphopeptides27 and proteins.28 Moreover, Ding et al. modified the functional guanidinium ionic liquids on GO to synthesize a magnetic composite material, which improved the extraction capacity of proteins.29 Modification of the oxygenated groups on GO seems to be a good approach to enhance the extraction efficiency of proteins.
Amino acids, the basic building units of protein, exhibit good biocompatibility.30 In addition, they possess functional groups such as amino, carboxyl, phenyl and sulfhydryl groups which can form hydrogen bonding, electrostatic and π–π interactions with proteins. Modification of the amino acids on GO can improve the biocompatibility and adsorbability of the adsorbents. However, modification of amino acids on GO as the absorbent for proteins has rarely been reported.
In this paper, amino acid-modified graphene oxide magnetic nanocomposite (AMGO@Fe3O4) was synthesized for the magnetic separation of proteins. We have chosen four kinds of amino acid with different functional groups to modify the surface of GO. Bovine hemoglobin (BHb) was selected as the representative protein to explore the adsorption capacity. After adsorption, the concentration of protein in the supernatant was measured by a UV-vis spectrophotometer. The parameters influencing extraction efficiency, including pH value, addition of electrolyte, extraction time and protein concentration, were optimized in detail. AMGO@Fe3O4 has also been used to explore extraction selectivity, and the results indicated that it could selectively extract BHb in an acidic protein mixture and in real samples.
2. Materials and methods
2.1 Materials
Expanded graphite powder (100 mesh) was supplied by the Xinghe Graphite Co., Ltd (Qingdao, China). Amino acids were obtained from Beijing Chemical Reagent Co. (Beijing, China). 1-Ethyl-3-(3-dimethylaminopropyl)carbodiimide hydrochloride (EDC) was purchased from J&K Chemical Technology Co., Ltd (Beijing, China). Ferric chloride and ferrous chloride were bought from Xilong Chemical Co., Ltd (Guangdong, China). Ammonia solution (25%) was acquired from Beijing Chemical Works (Beijing, China). Proteins including bovine hemoglobin (BHb), bovine serum albumin (BSA) and lysozyme (Lyz) were obtained from Beijing Keao Biological Pharmaceutical Co., Ltd (Beijing, China). Ovalbumin (OVA) was from Beijing Century Hualin Biotechnology Co., Ltd (Beijing, China). Bovine plasma was purchased from Beijing Keao Biological Pharmaceutical Co., Ltd (Beijing, China). All other reagents used in this study were analytical grade, and deionized water was used throughout the work.2.2 Preparation of GO
GO was synthesized from expanded graphite powder following a modified Hummers' method.31 About 18 g of potassium permanganate was added into a mixture of frozen concentrated H2SO4 (360 mL) and H3PO4 (40 mL), then 3 g of expanded graphite powder was slowly added with vigorous agitation to avoid a sudden increase in temperature. The reaction was maintained at 50 °C for 12 h. After this, the mixture was transferred into an ice–water mixture with the same volume, and 30% H2O2 was added dropwise until the color of the slurry turned to golden yellow. The slurry was washed with 10% HCl and deionized water and centrifuged to remove the supernatant. Then the product was purified by dialysis for 1 week to remove the remaining metal species. After the dialysis, the GO was ultrasonicated for 2 h to obtain an aqueous dispersion (10 mg mL−1).2.3 Preparation of AMGO
EDC (0.25 g) was added into 10 mL GO aqueous dispersion (10 mg mL−1) under agitation. After stirring for 30 min, different amino acids (0.3 g each) including L-arginine (Arg), glutamic acid (Glu), phenylalanine (Phe) and cysteine (Cys) were added to separate GO/EDC solutions. The mixtures were stirred for 24 h at room temperature. Then the amino acid-modified GO materials (AMGO) were washed with deionized water and centrifuged 5 times to remove the unreacted amino acids. Finally, the materials were dried in oven at 60 °C for 12 h.2.4 Preparation of AMGO@Fe3O4
AMGO@Fe3O4 was synthesized by the chemical coprecipitation method.26 The synthesized AMGO was dispersed in deionized water and ultrasonicated for 6 h to obtain an aqueous dispersion of AMGO (1 mg mL−1). Then, 250 mg of ferric chloride and 500 mg of ferrous chloride were added slowly to 50 mL of the AMGO dispersion at 50 °C under N2. Afterwards, 2 mL of ammonia solution was added slowly for synthesis of magnetite particles, and the reaction was maintained under vigorous stirring for 30 min. Then the mixture was subjected to an external magnetic field to separate the AMGO@Fe3O4. Finally, the AMGO@Fe3O4 was washed with deionized water 5 times and dispersed in deionized water (2 mg mL−1).2.5 Magnetic separation procedures
Magnetic separation experiments were performed using the AMGO@Fe3O4 as the adsorbent and BHb as the target protein to examine the extraction capacity. A 1 mL portion of the homogenized adsorbent solution (2 mg mL−1) was placed in a centrifuge tube. The adsorbent was isolated using an external magnetic field to remove the supernatant. Then 2 mL of aqueous protein solution was transferred into the centrifuge tube and the mixture was shaken at room temperature for 1 h. Afterwards, AMGO@Fe3O4 was magnetically separated by an external magnetic field. The concentration of protein in the supernatant was measured by a UV-vis spectrophotometer at the maximum absorption wavelength.2.6 Characterization of graphene nanocomposites
Fourier transform infrared spectra were recorded in the range 4000–500 cm−1 on a Bruker Fourier Transform Infrared Spectrometer (Horiba, Germany). The magnetic properties were measured with a 7307 Vibrating Sample Magnetometer (LakeShore, USA). X-ray photoelectron spectroscopy data were evaluated using a PHI-5300 ESCA X-ray photoelectron spectrometer (PHI, USA). Transmission electron microscopy images were taken with an H-7650B transmission electron microscope (Hitachi, Japan). Ultraviolet visible detection was carried out on a U-3010 UV-vis spectrophotometer (Hitachi, Japan). Zeta potential data were measured using a SZ-100 Nanoparticle Analyzer (Horiba, Japan).3. Results and discussion
3.1 Characterization of AMGO@Fe3O4
The AMGO@Fe3O4 synthesis procedure is illustrated schematically in Fig. 1. First, GO was prepared by the modified Hummers' method, and then the oxygenated groups including epoxy, hydroxyl and carboxyl were introduced to the surface of graphene. Second, the amide reaction occurred between the amine groups of amino acids and the carboxyl groups of GO, introducing amino acids to the surface of GO. Elemental analysis results showed that the content of nitrogen increased from 0.58% to 8.21%, and the content of carbon decreased from 44.25% to 38.91% after modification. Third, the AMGO@Fe3O4 was synthesized by the chemical coprecipitation method. The iron ions (Fe2+ and Fe3+) were seized on the surface of the AMGO sheets and then the Fe3O4 precipitate formed in the presence of ammonia solution. Finally, the nanocomposites we required were obtained.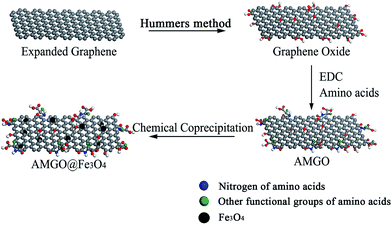 | ||
| Fig. 1 Schematic illustration of the synthesis of AMGO@Fe3O4. AMGO, amino acid-modified graphene oxide; EDC, 1-ethyl-3-(3-dimethylaminopropyl)carbodiimide hydrochloride. | ||
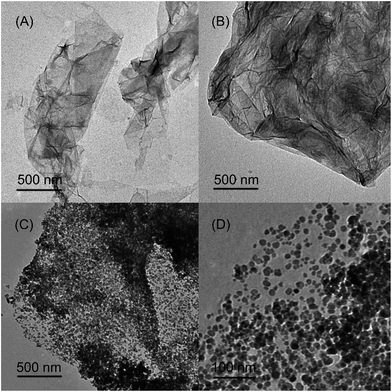
We chose the glutamic acid modified magnetic composite AMGO-Glu@Fe3O4 as the model to study the physical and chemical properties.
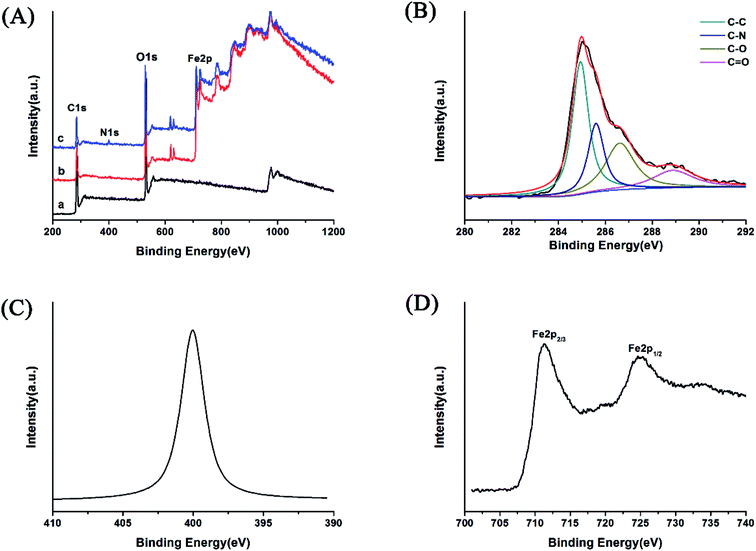
![[double bond, length as m-dash]](https://www.rsc.org/images/entities/char_e001.gif) O and C
O and C![[double bond, length as m-dash]](https://www.rsc.org/images/entities/char_e001.gif) C stretching vibrations, respectively, indicating the successful oxidation process.30 For the FTIR spectra of AMGO-Glu and AMGO-Glu@Fe3O4, the peaks at 1617.3 cm−1 and 1380.9 cm−1 were assigned to the C
C stretching vibrations, respectively, indicating the successful oxidation process.30 For the FTIR spectra of AMGO-Glu and AMGO-Glu@Fe3O4, the peaks at 1617.3 cm−1 and 1380.9 cm−1 were assigned to the C![[double bond, length as m-dash]](https://www.rsc.org/images/entities/char_e001.gif) O stretching vibration and C–N bending vibration of –NHCO–, respectively.29 The peak at 1576.8 cm−1 corresponded to the N–H bending vibration. The results indicated that the amino acids had been covalently grafted to the surface of GO. In addition, both the GO@Fe3O4 and AMGO-Glu@Fe3O4 presented a sharp peak at 578.6 cm−1 attributed to the Fe–O stretching vibration. This proved the existence of Fe3O4.
O stretching vibration and C–N bending vibration of –NHCO–, respectively.29 The peak at 1576.8 cm−1 corresponded to the N–H bending vibration. The results indicated that the amino acids had been covalently grafted to the surface of GO. In addition, both the GO@Fe3O4 and AMGO-Glu@Fe3O4 presented a sharp peak at 578.6 cm−1 attributed to the Fe–O stretching vibration. This proved the existence of Fe3O4.![[double bond, length as m-dash]](https://www.rsc.org/images/entities/char_e001.gif) O, respectively.5 The appearance of C–N confirmed the successful modification of GO with amino acids.
O, respectively.5 The appearance of C–N confirmed the successful modification of GO with amino acids.
3.2 Optimization of the magnetic separation conditions
Bovine hemoglobin (BHb) was chosen as the representative protein to study the extraction capacity of the prepared AMGO@Fe3O4. The extraction amount was calculated according to the following formula:26
 | (1) |
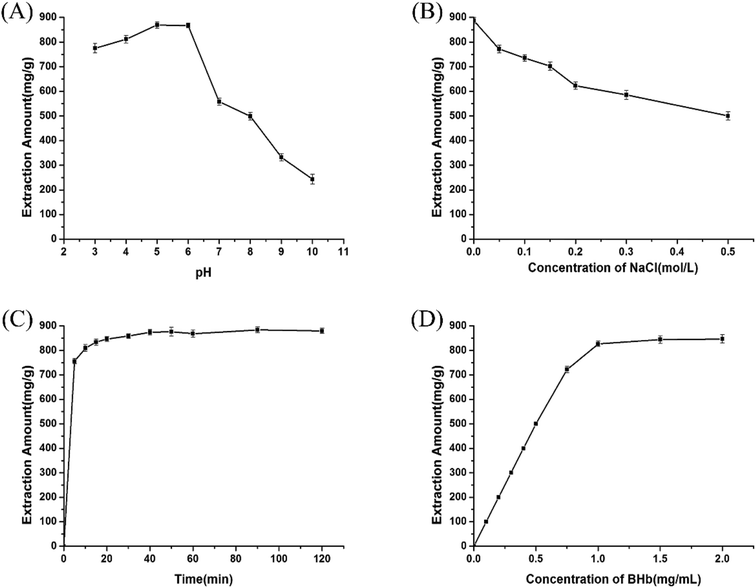
Several factors including the type of amino acid, pH value, addition of electrolyte, extraction time, and protein concentration were optimized to attain the best adsorption efficiency.
3.3 Comparison of GO@Fe3O4 and AMGO-Glu@Fe3O4
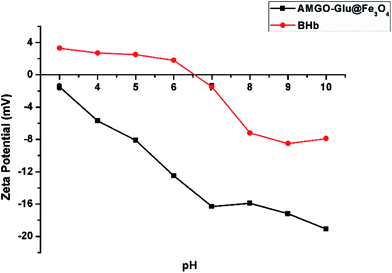
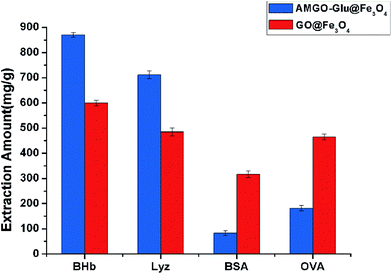
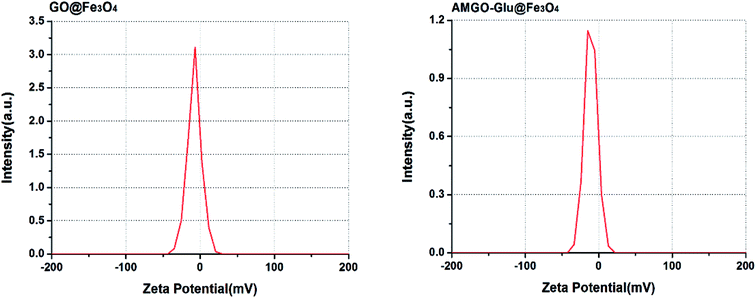
GO@Fe3O4 and AMGO-Glu@Fe3O4 were used to adsorb proteins under the same conditions to evaluate the advantage of the proposed AMGO-Glu@Fe3O4. It can be seen from Fig. 8 that both adsorbents had the ability to extract proteins, but their extraction capacities were different. Because of the conjugated structure and the existence of oxygenated groups on GO, the GO@Fe3O4 could form electrostatic, hydrogen bonding and π–π interactions with proteins. When glutamic acid was modified on the surface of GO, the extraction capacities of BHb and Lyz increased. This may be because the carboxyl groups in glutamic acid could increase the negative charge on the surface after modification. As shown in Fig. 9, the zeta potentials of GO@Fe3O4 and AMGO-Glu@Fe3O4 were −6.8 mV and −14.1 mV, respectively. In addition, the chosen pH value of extraction was 6.0, so the BHb (pI = 6.8) and Lyz (pI = 11.0) were positively charged. The increase in negative charge could enhance the electrostatic attraction between protein and the adsorbent, which improved the extraction capacities. However, under the same pH value, BSA (pI = 4.8) and OVA (pI = 4.7) were negatively charged, and the increase in negative charge could strengthen the electrostatic repulsion, so that the extraction capacities decreased. Moreover, the adsorption ratios of BHb/BSA and BHb/OVA were 10.54 and 4.79, respectively, which indicated that AMGO-Glu@Fe3O4 could selectively extract BHb from an acidic protein mixture.3.4 Regeneration of the AMGO@Fe3O4
In order to explore the regeneration of AMGO-Glu@Fe3O4, a series of desorption experiments were performed. It can be seen in Sections 3.2.2 and 3.2.3 that an increase in pH value and concentration of NaCl could decrease the amount of BHb extracted. In addition, the hydrogen bonds between AMGO-Glu@Fe3O4 and BHb could be broken under alkaline conditions. Therefore, 0.05 mol L−1 PBS buffer solution (pH 11.0) containing 0.5 mol L−1 NaCl was chosen as the eluent. After desorption, the AMGO-Glu@Fe3O4 was recovered by an external magnetic field and washed 3 times with deionized water, then it was utilized to extract BHb again. Three consecutive extraction–desorption cycles were carried out and the results are shown in Fig. S2.† The results showed only a minor decrease in the extraction capacity after three consecutive cycles, indicating the good recyclability of the proposed AMGO-Glu@Fe3O4 in magnetic separation.3.5 Extraction selectivity
In order to examine the possibility of selective extraction of BHb based on AMGO-Glu@Fe3O4, a protein mixture including BSA and BHb was used as a model. Meanwhile, the extraction selectivity of GO@Fe3O4 was explored under the same conditions for comparison. After adsorption and desorption, the supernatants were both collected for analysis by sodium dodecyl sulfate polyacrylamide gel electrophoresis (SDS-PAGE) assay. The results are shown in Fig. S3.† For GO@Fe3O4, the presence of protein was not observed in the supernatant after adsorption (lane 3), whereas both the BSA band around 66 kDa and the BHb band around 14 kDa were found in the eluent (lane 5). The results showed that both BHb and BSA were adsorbed by GO@Fe3O4, which indicated that the protein extraction of GO@Fe3O4 was nonspecific. On the other hand, after adsorption by AMGO-Glu@Fe3O4, only the BSA band was discovered in the supernatant (lane 4), while in the recovered eluent, only the BHb band was observed (lane 6). The results showed that AMGO-Glu@Fe3O4 could selectively extract BHb from BSA.3.6 Analysis of real samples
To evaluate the performance of AMGO-Glu@Fe3O4 in real samples, the nanocomposite was used to extract BHb from bovine plasma. After adsorption and desorption, the supernatants were both collected for analysis by SDS-PAGE assay. As shown in Fig. S4,† some protein bands were recorded for the bovine plasma sample (lane 2), which may be attributed mainly to BSA, BHb, transferrin and so on. After adsorption by AMGO-Glu@Fe3O4, the bands were still observed in the supernatant (lane 3). This is because the amount of proteins in bovine plasma was excessive for the adsorbent; however, in the recovered eluent, lane 4 showed a major band corresponding to 14 kDa, which was identified as BHb. The results showed that AMGO-Glu@Fe3O4 could selectively extract BHb in complex real samples.3.7 Validation of the proposed method
To evaluate the analytical performance of the proposed method, stability, repeatability and precision experiments were carried out. The stability experiment was performed by detecting a sample continuously over 3 days under the same conditions and the relative standard deviation (RSD) was 1.00% (n = 3). The repeatability experiment was performed by monitoring three copies of the same sample under the same conditions and the RSD was 0.76% (n = 3). The apparatus precision experiment was performed by measuring the same sample three times using a UV-vis spectrophotometer, and the value of RSD was 0.02% (n = 3). The results indicated the proposed method possessed excellent precision, repeatability, and stability.4. Conclusions
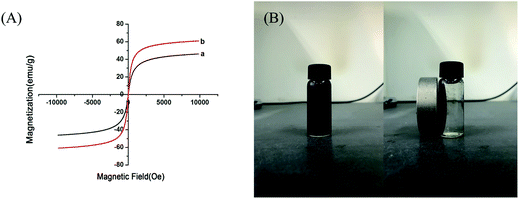
A novel amino acid-modified GO magnetic nanocomposite AMGO@Fe3O4 was successfully synthesized for the magnetic separation of proteins. The material displayed good magnetic properties and proteins could be separated rapidly using an external magnet. The research results showed that the AMGO@Fe3O4 was superior to GO@Fe3O4 in the extraction of BHb and Lyz, and could selectively extract BHb from BSA in complex real samples. Moreover, the AMGO@Fe3O4 could be easily regenerated, and the extraction capacity decreased only slightly after being used three times. The proposed method possessed excellent precision, repeatability and stability, and could be used as a simple and efficient separation technique for proteins in real samples.Conflict of interest
The authors have declared no conflict of interest.Acknowledgements
This work was supported by the Natural Science Foundation of China (No. 21575076 and 21621003), the National Key Research and Development Program of China (2016YFA0203101), and the Beijing Municipality Science and Technology Program (D161100002116001).References
- Y. Huang, Y. Wang, Q. Pan, Y. Wang, X. Ding, K. Xu, N. Li and Q. Wen, Anal. Chim. Acta, 2015, 877, 90–99 CrossRef CAS PubMed.
- H. Wang and S. Hanash, Mass Spectrom. Rev., 2005, 24, 413–426 CrossRef CAS PubMed.
- Y. Huang, Y. Wang, Y. Wang, Q. Pan, X. Ding, K. Xu, N. Li and Q. Wen, RSC Adv., 2016, 6, 5718–5728 RSC.
- M. Wierucka and M. Biziuk, TrAC, Trends Anal. Chem., 2014, 59, 50–58 CrossRef CAS.
- W. Wan, Q. Han, X. Zhang, Y. Xie, J. Sun and M. Ding, Chem. Commun., 2015, 51, 3541–3544 RSC.
- M. Safarikova, I. Kibrikova, L. Ptackova, T. Hubka, K. Komarek and I. Safarik, J. Magn. Magn. Mater., 2005, 293, 377–381 CrossRef CAS.
- K. Xu, Y. Wang, Y. Li, Y. Lin, H. Zhang and Y. Zhou, Anal. Chim. Acta, 2016, 946, 64–72 CrossRef CAS PubMed.
- H. Su, Y. Lin, Z. Wang, Y.-L. E. Wong, X. Chen and T.-W. D. Chan, J. Chromatogr. A, 2016, 1466, 21–28 CrossRef CAS PubMed.
- Y. Cai, Z.-H. Yan, N.-Y. Wang, Q.-Y. Cai and S.-Z. Yao, RSC Adv., 2015, 5, 56189–56197 RSC.
- M. Rashvand, M. Vosough and K. Kargosha, RSC Adv., 2016, 6, 75609–75617 RSC.
- X. Zhang, H. Niu, Y. Pan, Y. Shi and Y. Cai, Anal. Chem., 2010, 82, 2363–2371 CrossRef CAS PubMed.
- J. Ma, L. Jiang, G. Wu, Y. Xia, W. Lu, J. Li and L. Chen, J. Chromatogr. A, 2016, 1466, 12–20 CrossRef CAS PubMed.
- Z. Shan, Z. Zhou, H. Chen, Z. Zhang, Y. Zhou, A. Wen, K. D. Oakes and M. R. Servos, J. Chromatogr. B: Anal. Technol. Biomed. Life Sci., 2012, 881, 63–68 CrossRef PubMed.
- L. Wang, M. Wang, H. Yan, Y. Yuan and J. Tian, J. Chromatogr. A, 2014, 1368, 37–43 CrossRef CAS PubMed.
- Y. Lu, W. Chen, Y. Feng and P. He, J. Phys. Chem. B, 2008, 113, 2–5 CrossRef PubMed.
- C. Lee, X. Wei, J. W. Kysar and J. Hone, Science, 2008, 321, 385–388 CrossRef CAS PubMed.
- S. Stankovich, D. A. Dikin, G. H. Dommett, K. M. Kohlhaas, E. J. Zimney, E. A. Stach, R. D. Piner, S. T. Nguyen and R. S. Ruoff, Nature, 2006, 442, 282–286 CrossRef CAS PubMed.
- A. K. Singh and B. I. Yakobson, Nano Lett., 2009, 9, 1540–1543 CrossRef CAS PubMed.
- L. Xu, H. Suo, X. Liang, L. Wang and S. Jiang, RSC Adv., 2015, 5, 41536–41543 RSC.
- H. Ahmad, A. A. Jalil and S. Triwahyono, RSC Adv., 2016, 6, 88110–88116 RSC.
- L. Zhu and H. Xu, J. Sep. Sci., 2014, 37, 2591–2598 CrossRef CAS PubMed.
- Y. Li, L. Qi and H. Ma, Analyst, 2013, 138, 5470–5478 RSC.
- X. Chen, X. Hai and J. Wang, Anal. Chim. Acta, 2016, 922, 1–10 CrossRef CAS PubMed.
- N. Ye and P. Shi, Sep. Purif. Rev., 2015, 44, 183–198 CrossRef CAS.
- Q. Liu, J. B. Shi, L. X. Zeng, T. Wang, Y. Q. Cai and G. B. Jiang, J. Chromatogr. A, 2011, 1218, 197–204 CrossRef CAS PubMed.
- J. Sun, Q. Liang, Q. Han, X. Zhang and M. Ding, Talanta, 2015, 132, 557–563 CrossRef CAS PubMed.
- Q. Min, X. Zhang, H. Zhang, F. Zhou and J.-J. Zhu, Chem. Commun., 2011, 47, 11709–11711 RSC.
- G. Cheng, Y.-L. Liu, Z.-G. Wang, J.-L. Zhang, D.-H. Sun and J.-Z. Ni, J. Mater. Chem., 2012, 22, 21998–22004 RSC.
- X. Ding, Y. Wang, Y. Wang, Q. Pan, J. Chen, Y. Huang and K. Xu, Anal. Chim. Acta, 2015, 861, 36–46 CrossRef CAS PubMed.
- S. Mallakpour, A. Abdolmaleki and S. Borandeh, Appl. Surf. Sci., 2014, 307, 533–542 CrossRef CAS.
- W. S. Hummers and R. E. Offeman, J. Am. Chem. Soc., 1958, 80, 1339 CrossRef CAS.
Footnote |
| † Electronic supplementary information (ESI) available. See DOI: 10.1039/c7ra05114j |
| This journal is © The Royal Society of Chemistry 2017 |

