 Open Access Article
Creative Commons Attribution 3.0 Unported Licence
Synthesis and characterization of a new ion-imprinted polymer for the selective separation of thorium(IV) ions at high acidity
Hele Lianga,
Qingde Chen *a,
Jingyuan Mab,
Yuying Huangb and
Xinghai Shen*a
aBeijing National Laboratory for Molecular Sciences (BNLMS), Fundamental Science on Radiochemistry and Radiation Chemistry Laboratory, Department of Applied Chemistry, College of Chemistry and Molecular Engineering, Peking University, Beijing 100871, P. R. China. E-mail: qdchen@pku.edu.cn; xshen@pku.edu.cn; Tel: +86-10-62755200 Tel: +86-10-62765915
bShanghai Synchrotron Radiation Facility, Shanghai Institute of Applied Physics, Chinese Academy of Sciences, Shanghai 201800, P. R. China
First published on 14th July 2017
Abstract
A new ion-imprinted polymer (IIP) was synthesized by thermal copolymerization of bis(2-methacryloxyethyl) phosphate as functional ligand and ethylene glycol dimethacrylate as cross-linker in the presence of Th4+ as a template ion. The molar ratio of the functional ligand to Th4+ was optimized to be 4 by 31P NMR titration, elemental analysis, and EXAFS, which was verified by comparing the adsorption capacities and selectivities of IIPs with different composition. Thorium(IV) ions were leached out using 0.1 mol L−1 ethylenediaminetetraacetic acid disodium salt and the prepared IIP was characterized by infra-red spectroscopy, thermogravimetric analysis and Brunauer–Emmett–Teller surface area measurement. It was found that the IIP could extract Th4+ from high acidity solution. The maximum adsorption capacity was as high as 33.3 mg g−1 in 1.0 mol L−1 HCl. Even in 6.0 mol L−1 HCl, its adsorption capacity was still considerable. Moreover, the IIP exhibited good selectivity towards Th4+, especially in the presence of competing ions such as La3+, Eu3+, Yb3+, UO22+, and Fe3+.
1. Introduction
Thorium is widely used in various areas, such as optics, radio, aeronautics, and the chemical industry.1 More importantly, thorium is a promising fuel for the next generation of nuclear power plants.2 In general, thorium, uranium, rare-earth elements and iron often coexist in minerals as well as in waste water.3,4 Because thorium has both chemical toxicity and radioactivity,5 it is necessary to detect and remove Th4+ in waste water. Up to now, many methods have been applied, such as liquid–liquid extraction,6 solid phase extraction (SPE),7 ion exchange,8 extraction chromatography,9 membrane separation10 and so on. Among all the methods, SPE is widely used because of flexible working conditions and simple procedures. In the field of SPE, it is most important to synthesize an adsorbent with high selectivity towards the target ion.11Ion-imprinted polymers (IIPs) are a new kind of adsorbent for SPE, and are usually prepared by the copolymerization of a functional ligand and a cross-linker in the presence of template ion.12–14 Because of its memory effect on the template ion, the IIP can extract the target ion with good selectivity. Therefore, IIP is often used to separate and pre-concentrate trace metal ions.15,16 In the preparation of IIP, understanding the formation of complex compounds between metal ions and functional ligands is very helpful. Thus, many researchers studied the interaction between metal ion and functional ligand to guide their syntheses of IIPs.17–20
With respect to the SPE of Th4+, IIPs exhibit good performances. Buyuktiryaki et al.21 prepared a kind of Th4+–IIP beads with N-methacryloyl-(L)-glutamic acid as functional ligand to selectively separate Th4+ from UO22+, La3+, and Ce3+. Lin and coworkers22 synthesized Th4+–IIPs on the surface of silica gel by using 1-phenyl-3-methylthio-4-cyano-5-acrylicacidcarbamoyl-pyrazole as functional ligand, which was used to pre-concentrate Th4+ before the analysis with UV-vis spectro-photometry. In the syntheses of Th4+–IIPs, many functional ligands were used, which is summarized in Table 1. It can be found that most of the monomers own carboxyl or amino groups, leading to the optimum pH value of the IIPs between 3 and 5. When the pH value was lower than 3, the adsorption capacities of these IIPs decreased dramatically. For example, the magnetic Th4+-imprinted chitosan resin prepared by Huang and his coworkers had a large adsorption capacity of 147.1 mg g−1 in a solution of pH = 4, but the adsorption capacity was no more than 10% of the maximum value at the pH value of 1.23 However, in some practical cases, it is necessary to extract Th4+ in high acidity environment.7 Recently, this problem began to attract attention in the field of ion-imprinting technology. Fasihi et al.24 used vinyl sulfonate, a strong ion-exchanger functional ligand, to prepare Th4+–IIP, which could start to extract Th4+ with an extraction efficiency of 41% at pH = 1.6. By far, none of these Th4+–IIPs could be used at pH < 1. Therefore, there still remains a great challenge.
| Functional ligand | pH range | Maximum adsorption capacity/mg g−1 | Reference |
|---|---|---|---|
| N-Methacryloyl-(L)-glutamic acid | 2–4 | 40.44 (pH = 3) | 21 |
| Chitosan-phthalate | 2–4 | 61.3 (pH = 3) | 25 |
| N-(o-Carboxyphenyl)maleamic acid | 2–5 | 35.9 (pH = 3) | 26 |
| 1-Phenyl-3-methylthio-4-cyano-5-acrylicacidcarbamoyl-pyrazole | 1.5–5 | 64.8 (pH = 3.5) | 22 |
| Methacrylic acid | 2–5 | 33.2 (pH = 3) | 27 |
| 3-Methyl-1-phenyl-4-(cis-acylbutenoic acid)-2-pyrazolin-5-one | 2–6 | 56.8 (pH = 4.5) | 28 |
| N,N′-Bis(3-allyl salicylidene)o-phenylenediamine | 3–6 | 42.54 (pH = 4.5) | 17 |
| Thiosemicarbazide, 4-vinyl pyridine | 2–5 | 67.28 (pH = 4) | 29 |
| Vinyl sulfonate | 1.5–3.5 | 9.28 (pH = 3) | 24 |
| Chitosan | 1–6 | 147.1 (pH = 4) | 23 |
Acidic organophosphorus compounds, particularly organophosphorus monacids (such as bis(2-ethylhexyl)-phosphoric acid (HDEHP)10 and 2-ethylhexyl phosphoric acid mono-2-ethylhexyl ester30), are widely used in the extraction of Th4+ and trivalent rare earths. Especially, they can extract Th4+ from 1 mol L−1 H2SO4 solution.31 Our research group has ever used HDEHP to extract Th4+ by reversed micelles with high efficiency.32,33 Dioleylphosphoric acid34,35 and 1,12-dodecanediol-O,O′-diphenyl phosphonic acid35 were used as functional ligand to synthesize Zn2+–IIP, La3+–IIP, Ce3+–IIP, and Dy3+–IIP. Meanwhile, the Dy3+–IIP could be used at pH = 1.34 However, to the best of our knowledge, acidic organo-phosphorus compounds have not been used in the preparation of Th4+–IIP. Moreover, with respect to organophosphorus monacids, their coordination behaviors with Th4+ are not well understood. In the literature, there appeared several complex compounds with different molar ratios of ligand to Th4+, e.g. Th(NO3)(DEHP)3,32 Th(NO3)2(DEHP)2,33 Th[H(DEHP)2]4,36 and Th(NO3)2(DcyHPA)2 (DcyHPA: dicyclohexylphosphinic acid).37 Therefore, it is essential to determine the molar ratio of functional ligand to Th4+ when organophosphorus monacid is applied as functional ligand to synthesize Th4–IIP.
Since organophosphorus monacids have strong affinities towards Th4+, Th4+–IIP was synthesized in this work by using bis(2-methacryloxyethyl) phosphate (BMAOP) as the functional ligand. Also, the molar ratio of functional ligand to Th4+ was optimized in detail.
2. Experimental
2.1 Reagents and instruments
Bis(2-methacryloxyethyl) phosphate (BMAOP, N/A, J&K Scientific, China), ethylene glycol dimethacrylate (EGDMA, 98%, Acros, Belgium) and dimethyl phosphate (DMP, 98%, Acros, Belgium) were used as received. Azobisisobutyronitrile (AIBN, A.R., Beijing Yili Fine Chemical Products Inc., China) was purified by recrystallization. Ultrapure water was used throughout the experiments. All other chemical reagents used in this study were of analytical grade and used without further purification.The concentrations of all the metal ions were determined by inductively coupled plasma-atomic emission spectrometer (ICP-AES, Leeman, USA) with relative standard deviation (RSD) below 5%. Thermo-gravimetric analysis (TGA) was carried out using a TGA-DSC-DTA (Q-600 SDT, Thermal Analysis Co., USA). The Brunauer–Emmett–Teller (BET) surface area was measured using an accelerated surface area & porosimetry system (ASAP 2010, Micrometer, USA). FT-IR spectra were recorded in the frequency range of 400–4000 cm−1 using FT-IR spectrometer (Tensor 27, Bruker, Germany). 31P NMR spectra were obtained with phosphoric acid as external standard by using Bruker-400 MHz NMR (ARX400, Bruker, Switzerland). The elemental analysis was taken by using an Elemental Analyzer (Vario EL, Elementar Analysensysteme GmbH, Germany). A pH meter (Delta 320, Mettler-Toledo, Switzerland) was used to measure pH values.
Sample for Extended X-ray Absorption Fine Structure (EXAFS) measurement was prepared by mixing Th(NO3)4·4H2O, DMP and triethylamine (Et3N) at a molar ratio of 1![[thin space (1/6-em)]](https://www.rsc.org/images/entities/char_2009.gif) :
:![[thin space (1/6-em)]](https://www.rsc.org/images/entities/char_2009.gif) 4
4![[thin space (1/6-em)]](https://www.rsc.org/images/entities/char_2009.gif) :
:![[thin space (1/6-em)]](https://www.rsc.org/images/entities/char_2009.gif) 4 in dimethyl sulphoxide (DMSO) in a 2 mL plastic tube, and then measured directly. XAFS measurement at Th L3-edge in transmission mode was performed at the BL14W1 (ref. 38) in Shanghai Synchrotron Radiation Facility (SSRF). The electron beam energy was 3.5 GeV and the stored current was 260 mA (top-up). A 38-pole wiggler with the maximum magnetic field of 1.2 T inserted in the straight section of the storage ring was used. XAFS data were collected using a fixed-exit double-crystal Si (111) monochromator. The energy was calibrated using Zr foil. The photon flux at the sample position was 6.9 × 10¹¹ photons per second. The raw data analysis was performed using IFEFFIT software package according to the standard data analysis procedures.39 The spectrum was calibrated, averaged, pre-edge background subtracted, and post-edge normalized using Athena program in IFEFFIT software package. The Fourier transformation of the k3-weighted EXAFS oscillations, k3 × χ(k), from k space to R space was performed over a range of 2.3–10.3 Å−1 to obtain a radial distribution function. And data fitting was done by Artemis program in IFEFFIT.
4 in dimethyl sulphoxide (DMSO) in a 2 mL plastic tube, and then measured directly. XAFS measurement at Th L3-edge in transmission mode was performed at the BL14W1 (ref. 38) in Shanghai Synchrotron Radiation Facility (SSRF). The electron beam energy was 3.5 GeV and the stored current was 260 mA (top-up). A 38-pole wiggler with the maximum magnetic field of 1.2 T inserted in the straight section of the storage ring was used. XAFS data were collected using a fixed-exit double-crystal Si (111) monochromator. The energy was calibrated using Zr foil. The photon flux at the sample position was 6.9 × 10¹¹ photons per second. The raw data analysis was performed using IFEFFIT software package according to the standard data analysis procedures.39 The spectrum was calibrated, averaged, pre-edge background subtracted, and post-edge normalized using Athena program in IFEFFIT software package. The Fourier transformation of the k3-weighted EXAFS oscillations, k3 × χ(k), from k space to R space was performed over a range of 2.3–10.3 Å−1 to obtain a radial distribution function. And data fitting was done by Artemis program in IFEFFIT.
2.2 Synthesis of Th4+–imprinted polymer
In a typical preparation process, 0.322 g (1.0 mmol) BMAOP and 0.101 g Et3N (1.0 mmol) were dissolved in 2.5 mL DMSO, and stirred for 0.5 h. Then, 0.138 g Th(NO3)4·4H2O (0.25 mmol) was added and stirred for 2 h. After adding 0.792 g EGDMA (4 mmol) and 10 mg AIBN, the mixture was purged with N2 for 20 min and polymerized in an oil bath at 60 °C for 18 h. The bulk polymer was grounded and stirred in 100 mL 0.1 mol L−1 ethylenediaminetetraacetic acid disodium salt (Na2EDTA) for several times to remove Th4+. Then, the polymer was washed with water and acetone in turn. At last, the dried polymer was sieved to get the particles between 80 and 200 mesh. The non-imprinted polymer (NIP) was prepared under similar conditions except the absence of Th(NO3)4·4H2O and Et3N.2.3 Adsorption experiments
The adsorption capacities of IIP (NIP) were determined by stirring 0.0050 g IIP (NIP) with a 0.0100 L solution of Th(NO3)4 (15–60 mg L−1) and HCl (10−3.8–6 mol L−1) at 25 °C. Then, the mixtures were centrifuged at 4000 rpm for 5 min, and the concentration of Th4+ in the solutions was measured by ICP-AES. The adsorption capacity (Q, mg g−1) and distribution ratio (kd, mL g−1) was calculated according to eqn (1) and (2).| Q = (C0 − Ce)V/W | (1) |
| kd = [(C0 − Ce)V/CeW] × 1000 | (2) |
In the selectivity studies, 0.0100 g of the IIP (NIP) was shaken with a solution containing both Th4+ and the other metal ion, where the concentration of each metal ion was 20 mg L−1. The selectivity coefficient S and the relative selectivity coefficient k′ were calculated according to eqn (3) and (4).
| STh/M = kd(Th)/kd(M) | (3) |
| k′ = SIIP/SNIP | (4) |
3. Results and discussion
3.1 Optimizing the molar ratio of functional ligand to Th4+
Before the syntheses of the Th4+–IIP, the molar ratio of the functional ligand to Th4+ should be determined. The functional ligand BMAOP is not stable at room temperature and easy to polymerize. Thus, DMP was chosen as a stable substitute for BMAOP, because each of them has one phosphoric acid group to coordinate with metal ions.
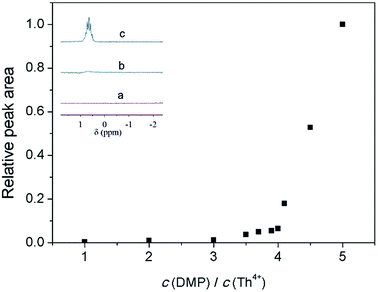
Firstly, 31P NMR titration was used. With the change of the concentration of DMP (deprotonated with the same amount of Et3N), the 31P NMR spectra were measured at the Th(NO3)4 concentration of 0.25 mmol L−1. As can be seen from Fig. 1, the peak of the free ligand around 0.8 ppm starts to appear when the molar ratio of DMP to Th4+ arrives at 3.9 and the intensity of the peak grows fast beyond 4, suggesting the formation of a relatively stable 4![[thin space (1/6-em)]](https://www.rsc.org/images/entities/char_2009.gif) :
:![[thin space (1/6-em)]](https://www.rsc.org/images/entities/char_2009.gif) 1 complex compound between DMP and Th4+.
1 complex compound between DMP and Th4+.
Moreover, the complex compound of DMP with Th4+ was synthesized to confirm the molar ratio of DMP to Th4+. After mixing Th(NO3)4, DMP and Et3N at a molar ratio of 1![[thin space (1/6-em)]](https://www.rsc.org/images/entities/char_2009.gif) :
:![[thin space (1/6-em)]](https://www.rsc.org/images/entities/char_2009.gif) 4
4![[thin space (1/6-em)]](https://www.rsc.org/images/entities/char_2009.gif) :
:![[thin space (1/6-em)]](https://www.rsc.org/images/entities/char_2009.gif) 4 in DMSO, water was added. Then, white precipitates were collected and dried in vacuum. Elemental analysis showed that the composition of the compound is close to that of Th(DMP)4·H2O (elemental analysis (%) calculated for Th(C2H6O4P)4·H2O: C 12.81, H 3.49; found: C 12.91, H 3.34).
4 in DMSO, water was added. Then, white precipitates were collected and dried in vacuum. Elemental analysis showed that the composition of the compound is close to that of Th(DMP)4·H2O (elemental analysis (%) calculated for Th(C2H6O4P)4·H2O: C 12.81, H 3.49; found: C 12.91, H 3.34).
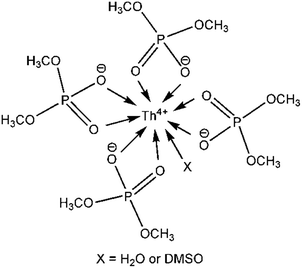
Furthermore, EXAFS was used to determine the coordination number of Th4+ when the molar ration of DMP to Th4+ is 4. The fitting curve of the EXAFS data according to the single scattering theoretical phase and amplitude functions is shown in Fig. 2. The result indicates that a shell of 9.1 ± 0.7 oxygen atoms directly coordinated to Th4+ at approximately 2.39 ± 0.01 Å (Table 2). Since organophosphorus monacids often coordinate with Th4+ as bidentate ligands,37 combining the results of 31P NMR and elemental analysis, it is reasonable to conclude that four bidentate DMPs and one monodentate ligand (water or DMSO) coordinate with Th4+ in the solution (Scheme 1).
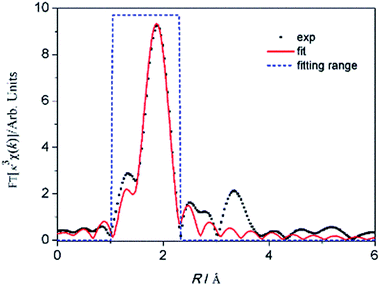 | ||
| Fig. 2 The k3-weighted EXAFS Fourier transform spectrum (dots) and the best fitting (line) of Th4+ in the solution when c(DMP)/c(Th4+) is 4. | ||
| CN | R/Å | σ2/10−3 Å2 | ΔE0/eV | R factor | |
|---|---|---|---|---|---|
| Th–O | 9.1 ± 0.7 | 2.39 ± 0.01 | 5.2 ± 0.3 | 4.4 ± 1.0 | 0.004 |
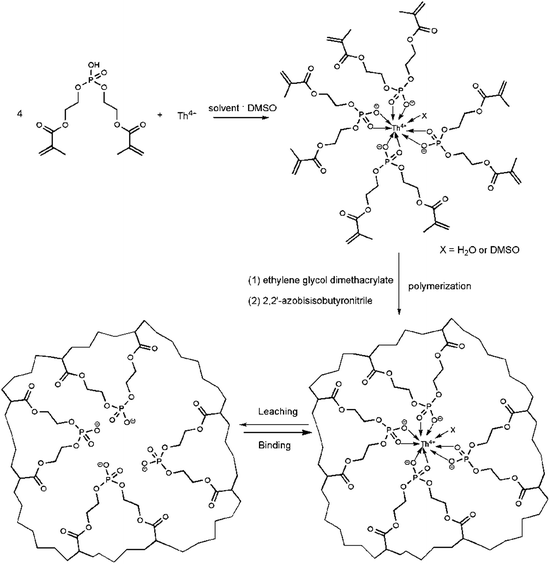
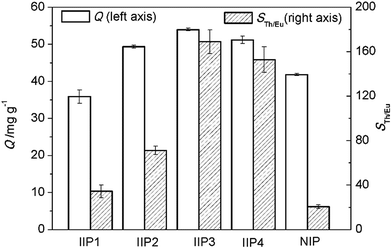
Then, fixing the molar ratio of EGDMA to BMAOP at 4, IIP1–IIP4, with the molar ratios of BMAOP to Th4+ at 3, 3.5, 4 and 5 respectively, were synthesized. Meanwhile, the synthesis process of IIP3 is exhibited in Scheme 2. As can be seen from Fig. 3, the adsorption capacity of IIP3 is the highest. However, NIP shows high adsorption capacity, too, which is slightly higher than that of IIP1. In general, imprinting effect or large surface area always leads to a high adsorption capacity. Herein, the surface areas of IIP1–4 and NIP were determined to be 164, 182, 217, 210, and 196 m2 g−1, respectively. For the larger surface area, the adsorption capacity of NIP is slightly higher than that of IIP1. As the imprinting effect, the adsorption capacity of IIP2 is higher than that of NIP although the surface area of IIP2 is slightly lower than that of NIP. The reasons for the large surface area and high adsorption capacity of NIP will be discussed in detail in Sections 3.2.3 and 3.3.3, respectively. We also digested the IIPs, and found that the residual thorium was less than 3 mg g−1. In other words, the residual thorium in the IIPs has little influence on the adsorption capacities.
Furthermore, the selectivity coefficient (Th4+/Eu3+) of IIP3 are obviously higher than those of IIP1, IIP2, IIP4, and much higher than that of NIP (Fig. 3). This could be ascribed to the fact that one Th4+ ion coordinates with four BMAOP molecules, and excessive or insufficient functional ligands may reduce the specificity of the binding sites. The proper molar ratio of BMAOP to Th4+ should be 4![[thin space (1/6-em)]](https://www.rsc.org/images/entities/char_2009.gif) :
:![[thin space (1/6-em)]](https://www.rsc.org/images/entities/char_2009.gif) 1, consistent with the results of 31P NMR, elemental analysis and EXAFS. Thus, IIP3 was selected in the following characterization and adsorption experiments.
1, consistent with the results of 31P NMR, elemental analysis and EXAFS. Thus, IIP3 was selected in the following characterization and adsorption experiments.
3.2 Characterization
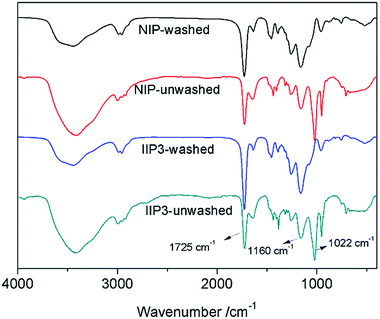
![[double bond, length as m-dash]](https://www.rsc.org/images/entities/char_e001.gif) O group and a peak at 1160 cm−1 assigned to the stretching vibration of P
O group and a peak at 1160 cm−1 assigned to the stretching vibration of P![[double bond, length as m-dash]](https://www.rsc.org/images/entities/char_e001.gif) O group. These peaks demonstrate that BMAOP has been successfully copolymerized with EGDMA, and IIP3 has an identical composition as NIP. After washing, the absorption at 1022 cm−1, the stretching vibration of S
O group. These peaks demonstrate that BMAOP has been successfully copolymerized with EGDMA, and IIP3 has an identical composition as NIP. After washing, the absorption at 1022 cm−1, the stretching vibration of S![[double bond, length as m-dash]](https://www.rsc.org/images/entities/char_e001.gif) O group, diminished, indicating the leaching of the residual DMSO.
O group, diminished, indicating the leaching of the residual DMSO.
3.3 Adsorption properties
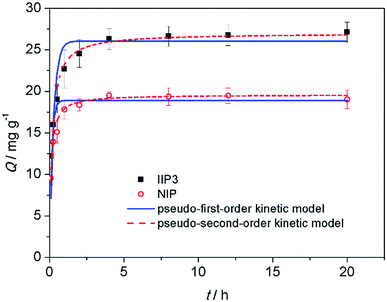 | ||
| Fig. 7 Effect of time on the adsorption of Th4+ on the IIP3 and NIP. (Adsorbent: 0.0050 g, thorium concentration: 20 mg L−1, thorium solution: 0.0100 L, HCl: 1.0 mol L−1). | ||
To explore the mechanism of adsorption kinetics, two different kinetic models were applied to fit the experimental data, i.e., the pseudo-first-order kinetic model (eqn (5)) and the pseudo-second-order kinetic model (eqn (6)).
| Qt = Qe(1 − e−k1t) | (5) |
 | (6) |
| Qe(exp)/mg g−1 | Pseudo-first-order | Pseudo-second-order | |||||
|---|---|---|---|---|---|---|---|
| k1/h−1 | R2 | Qe(cal)/mg g−1 | k2/mg g−1 h−1 | R2 | Qe(cal)/mg g−1 | ||
| IIP3 | 26.8 ± 1 | 3.8 ± 0.5 | 0.87 | 26.0 ± 0.9 | (1.2 ± 0.1) × 105 | 0.96 | 27.0 ± 0.5 |
| NIP | 19.3 ± 0.9 | 7.0 ± 1.0 | 0.89 | 18.9 ± 0.4 | (8.0 ± 0.6) × 104 | 0.98 | 19.6 ± 0.2 |
| Q = QmbCe/(1 + Ce) | (7) |
 | (8) |
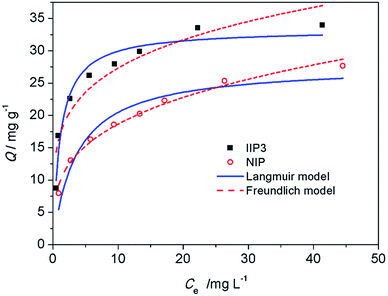 | ||
| Fig. 8 Adsorption isotherms of IIP3 and NIP. (Adsorbent: 0.0050 g, thorium solution: 0.0100 L, HCl: 1.0 mol L−1, time: 12 h). | ||
| Langmuir | Freundlich | |||||
|---|---|---|---|---|---|---|
| R2 | Qm/mg g−1 | b/L mg−1 | R2 | KF | n | |
| IIP3 | 0.95 | 33.3 ± 1.0 | 0.9 ± 0.2 | 0.88 | 17 ± 2 | 4.7 ± 0.7 |
| NIP | 0.93 | 27.8 ± 2.0 | 0.28 ± 0.06 | 0.99 | 9.6 ± 0.4 | 3.5 ± 0.2 |
There are specific binding sites and unspecific binding sites in IIPs, while the binding sites in NIP is unspecific. The surface area of NIP is slightly lower than that of IIP3, suggesting that the accessibility of the binding sites of IIP3 and NIP is similar.
When the concentration of Th4+ is low, the specific binding sites in IIP3 show stronger binding ability than the unspecific binding sites in NIP. For example, at an initial Th4+ concentration of 5.2 mg L−1, the kd values of IIP3 and NIP are 1.7 × 10⁴ and 8.1 × 10³ mL g−1, respectively, indicating that the IIP3 can adsorb Th4+ more effectively. When the Th4+ in the solution is abundant, both the specific binding sites and unspecific binding sites in IIP3, as well as the unspecific binding sites in NIP can combine with Th4+. Thus, with the increase of the equilibrium concentration of Th4+, the difference of adsorption capacities between IIP3 and NIP becomes smaller (Fig. 8).
| Competing ions | kd,Th × 10−3 (mL g−1) | kd,M × 10−3 (mL g−1) | STh/M | k′ | |||
|---|---|---|---|---|---|---|---|
| IIP3 | NIP | IIP3 | NIP | IIP3 | NIP | ||
| a The adsorptions of Fe3+ and Ln3+ on the IIP3 and NIP could not be detected. | |||||||
| UO22+ | 38.7 ± 0.6 | 6.3 ± 0.5 | 0.33 ± 0.006 | 0.15 ± 0.003 | 116 ± 0.3 | 41 ± 2 | 2.9 ± 0.2 |
| Fe3+ | 27.8 ± 0.3 | 5.9 ± 0.1 | — | — | — | — | — |
| La3+ | 53 ± 3 | 7.3 ± 0.3 | — | — | — | — | — |
| Eu3+ | 62 ± 1 | 7.1 ± 0.1 | — | — | — | — | — |
| Yb3+ | 52 ± 3 | 7.2 ± 0.1 | — | — | — | — | — |
4. Conclusions
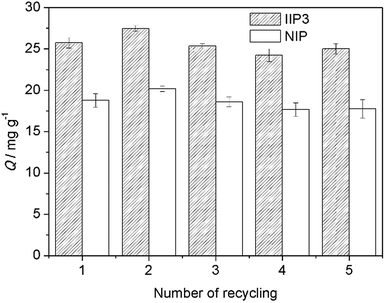
For the first time, a new Th4+–IIP that could be used in high acidity environment was synthesized using BMAOP as functional ligand. The molar ratio of the functional ligand to Th4+ was optimized to be 4 by 31P NMR titration, elemental analysis, and EXAFS, which was verified by comparing the adsorption capacities and selectivities of Th4+–IIPs with different compositions. The best Th4+–IIP3, with the molar ratio of BMAOP to Th4+ at 4, had a maximum adsorption capacity of 33.3 mg g−1 in 1 mol L−1 HCl solution, and its adsorption capacity was still considerable even in 6.0 mol L−1 HCl. The adsorption kinetic of the IIP3 followed the pseudo-second-order kinetic model. And the IIP3 can effectively extract Th4+ from the mixed aqueous solution of Th4+, La3+, Eu3+, Yb3+, UO22+, and Fe3+. Moreover, the IIP3 can be reused for at least five times without obvious loss of adsorption capacity. Therefore, the prepared Th4+–IIP3 could be used in the detection and removal of Th4+ in high acidity waste water. Future studies will be focused on the improvement of the adsorption capacity and the selectivity coefficient (Th4+/UO22+) in high acidity environment for the treatment of the real samples.Acknowledgements
The authors are grateful to Dr Zejun Li for the help in the ICP-AES measurement. This work was supported by Science Challenge Project (No. TZ2016004) and National Natural Science Foundation of China (No. U1507203 and 91226112).Notes and references
- S. C. Zhang, P. Liu and B. J. Zhang, World Nucl. Geosci., 2005, 22, 98–103 Search PubMed.
- Z. Gu, Chin. J. Nucl. Sci. Eng., 2007, 27, 97–105 Search PubMed.
- J. Cheng, Y. Hou and L. Che, Chin. Rare Earths, 2008, 29, 76–77 Search PubMed.
- Z. Zhu, Y. Pranolo and C. Y. Cheng, Miner. Eng., 2015, 77, 185–196 CrossRef CAS.
- I. Shtangeeva, S. Ayrault and J. Jain, J. Environ. Radioact., 2005, 81, 283–293 CrossRef CAS PubMed.
- J. Fu, Q. D. Chen, T. X. Sun and X. H. Shen, Sep. Purif. Technol., 2013, 119, 66–71 CrossRef CAS.
- S. Kesava Raju Ch and M. S. Subramanian, J. Hazard. Mater., 2007, 145, 315–322 CrossRef PubMed.
- T. P. Rao, P. Metilda and J. M. Gladis, Talanta, 2006, 68, 1047–1064 CrossRef CAS PubMed.
- R. Pilviö and M. Bickel, J. Alloys Compd., 1998, 271–273, 49–53 CrossRef.
- D. Nanda, M. S. Oak, M. P. Kumar, B. Maiti and P. K. Dutta, Sep. Sci. Technol., 2001, 36, 2489–2497 CrossRef CAS.
- W. A. Wan Ibrahim, L. I. Abd Ali, A. Sulaiman, M. M. Sanagi and H. Y. Aboul-Enein, Crit. Rev. Anal. Chem., 2014, 44, 233–254 CrossRef CAS PubMed.
- C. Branger, W. Meouche and A. Margaillan, React. Funct. Polym., 2013, 73, 859–875 CrossRef CAS.
- J. Fu, L. Chen, J. Li and Z. Zhang, J. Mater. Chem. A, 2015, 3, 13598–13627 CAS.
- H. L. Liang, Q. D. Chen and X. H. Shen, J. Nucl. Radiochem. Sci., 2016, 38, 129–144 Search PubMed.
- H. He, Q. Gan and C. Feng, RSC Adv., 2017, 7, 15102–15111 RSC.
- Z. Zhang, J. Li, X. Song, J. Ma and L. Chen, RSC Adv., 2014, 4, 46444–46453 RSC.
- F. F. He, H. Q. Wang, Y. Y. Wang, X. F Wang, H. S. Zhang, H. L. Li and J. H. Tang, J. Radioanal. Nucl. Chem., 2012, 295, 167–177 CrossRef.
- A.-S. Chauvin, J.-C. G. Bünzli, F. Bochud, R. Scopelliti and P. Froidevaux, Chem.–Eur. J., 2006, 12, 6852–6864 CrossRef CAS PubMed.
- M. Monier and N. H. Elsayed, J. Colloid Interface Sci., 2014, 423, 113–122 CrossRef CAS PubMed.
- J. Fasihi, S. Ammari Alahyari, M. Shamsipur, H. Sharghi and A. Charkhi, React. Funct. Polym., 2011, 71, 803–808 CrossRef CAS.
- S. Buyuktiryaki, R. Say, A. Ersoz, E. Birlik and A. Denizli, Talanta, 2005, 67, 640–645 CrossRef CAS PubMed.
- C. Lin, H. Wang, Y. Wang and Z. Cheng, Talanta, 2010, 81, 30–36 CrossRef CAS PubMed.
- G. Huang, Z. Chen, L. Wang, T. Lv and J. Shi, J. Radioanal. Nucl. Chem., 2016, 310, 1265–1272 CrossRef CAS.
- J. Fasihi, N. Bavarsad, S. Shariati and K. Ashtari, Int. J. Environ. Anal. Chem., 2016, 96, 789–800 CrossRef CAS.
- E. Birlik, S. Buyuktiryaki, A. Ersoz, A. Denizli and R. Say, Sep. Sci. Technol., 2006, 41, 3109–3121 CrossRef CAS.
- Q. He, X. Chang, Q. Wu, X. Huang, Z. Hu and Y. Zhai, Anal. Chim. Acta, 2007, 605, 192–197 CrossRef CAS PubMed.
- C. R. Lin, H. Q. Wang, Y. Y. Wang, L. Zhou and J. Liang, Int. J. Environ. Anal. Chem., 2011, 91, 1050–1061 CrossRef CAS.
- Z. Cheng, H. Wang, Y. Wang, F. He, H. Zhang and S. Yang, Microchim. Acta, 2011, 173, 423–431 CrossRef CAS.
- S. Mishra and D. K. Singh, Desalin. Water Treat., 2014, 56, 1364–1371 CrossRef.
- G. X. Xu, Rare earths, Metallurgical Industry Press, Beijing, China, 2nd edn, 1995 Search PubMed.
- H. Tong, Y. Wang, W. Liao and D. Li, Sep. Purif. Technol., 2013, 118, 487–491 CrossRef CAS.
- S. Gao, T. X. Sun, Q. D. Chen and X. H. Shen, Radiochim. Acta, 2016, 104, 457–469 CrossRef CAS.
- S. Gao, X. H. Shen, Q. D. Chen and H. C. Gao, Sci. China: Chem., 2012, 55, 1712–1718 CrossRef CAS.
- K. Uezu, T. Kuwabara, M. Yoshida and G. Masahiro, Anal. Sci., 2004, 20, 1593–1597 CrossRef CAS PubMed.
- M. Yoshida, K. Uezu, M. Goto and S. Furusaki, Macromolecules, 1999, 32, 1237–1243 CrossRef CAS.
- F. H. El-Sweify, A. A. Abdel-Fattah and S. M. Ali, J. Chem. Thermodyn., 2008, 40, 798–805 CrossRef CAS.
- E. V. Goud, D. Das, A. Sivaramakrishna, K. Vijayakrishna, V. Sabareesh, G. Gopakumar, C. V. S. Brahmmananda Rao, M. Y. Lone and P. C. Jha, Polyhedron, 2016, 117, 741–748 CrossRef CAS.
- H. Yu, X. Wei, J. Li, S. Gu, S. Zhang, L. Wang, J. Ma, L. Li, Q. Gao, R. Si, F. Sun, Y. Wang, F. Song, H. Xu, X. Yu, Y. Zou, J. Wang, Z. Jiang and Y. Huang, Nucl. Sci. Tech., 2015, 26, 050102 Search PubMed.
- M. Newville, J. Synchrotron Radiat., 2001, 8, 322–324 CrossRef CAS PubMed.
- P. Metilda, J. Mary Gladis and T. Prasada Rao, Anal. Chim. Acta, 2004, 512, 63–73 CrossRef CAS.
- W. Meouche, K. Laatikainen, A. Margaillan, T. Silvonen, H. Siren, T. Sainio, I. Beurroies, R. Denoyel and C. Branger, Eur. Polym. J., 2017, 87, 124–135 CrossRef CAS.
- A. R. Iftikhar, H. N. Bhatti, M. A. Hanif and R. Nadeem, J. Hazard. Mater., 2009, 161, 941–947 CrossRef CAS PubMed.
| This journal is © The Royal Society of Chemistry 2017 |

