 Open Access Article
Difference in solid-state properties and enzymatic degradation of three kinds of poly(butylene succinate)/cellulose blends
Xueyan Hu ,
Tingting Su
 *,
Wenjing Pan
 ,
Ping Li and
Zhanyong Wang
 *
*
College of Chemistry, Chemical Engineering and Environmental Engineering, Liaoning Shihua University, Fushun, 113001, China. E-mail: sutingting1978@126.com; wangzy125@lshu.edu.cn; Fax: +86 24 56861868; Tel: +86 24 56861705
First published on 17th July 2017
Abstract
Biodegradable poly(butylene succinate) (PBS) was blended with cellulose microcrystalline (CMC), cellulose acetate (CA), and cellulose triacetate (CTA), respectively, to improve its properties and reduce its cost. The differences in solid-state properties and enzymatic degradation were investigated using FTIR, DSC, XRD, and SEM analysis. SEM images show that the fillers stick up above the matrix and form some pores in both PBS/CMC and PBS/CA blends because of their poor compatibility. Whereas fine particles of PBS and CTA are uniformly mixed and tightly packed together. The degree of crystallinity decreases for PBS/CTA blends, thereby showing that CTA molecules destroy the crystal uniformity. Young's modulus is increased at average values of 43% after blending. The weight loss ratios of PBS/CMC and PBS/CA blends both reach approximately 85% after 4 h. SEM images show that the spherulitic texture in the surface easily formed cracks and holes and contributed to enzymolysis. In PBS/CTA samples, the weight loss ratio declined to 16% after 4 h. The surfaces are smooth and the enzymolysis occurs only on the surface.
1. Introduction
Different types of biodegradable and biobased polymers have been regarded as potential materials for substituting some traditional plastics from fossil resources in recent years.1–5 Among them, poly(butylene succinate) (PBS) has been widely investigated and used because of its environmentally friendly characteristics. However, its high cost, low rigidity, and low rate of degradation restrict the applications of PBS.4 To mitigate its defects and expand its application, PBS has been modified by physical blending with other materials. Composite materials not only have a certain function but could also create some new properties because of the interaction force between the polymer and other materials.Modifying biodegradable PBS with natural fibers as a reinforcement is an economic and effective method, for which cellulose is a good choice.6,7 They have generated considerable interest due to their biodegradability, low cost, large hydrophilic properties, great reactivity, excellent degradation performance and good mechanical properties. A variety of micron-grade cellulose materials has been used to synthesize fully-biodegradable composites with high performance.8–11 For example, bigger improvements in mechanical properties have been realized by adding compatibilizer,6,9 modifying the matrix with dicumyl peroxide,7 or treating the cellulose with acetylchloride.11
Cellulose is difficult to process. It is not digested easily by most organisms. The poor compatibility and interfacial adhesion between cellulose and polymer matrices are major restraints on the mechanical properties of composites. Therefore, cellulose should be functionalized before blending with other biodegradable materials. Cellulose acetate (CA) and cellulose triacetate (CTA) can be obtained through the esterification of pure cellulose to different extents. Different degrees of substitution could influence the performance of cellulose, such as its crystallinity and solubility. Pure cellulose is insoluble in common solvents and CTA can be dissolved in chloroform.
In the present study, PBS/cellulose microcrystalline (CMC), PBS/CA and PBS/CTA blends at different ratios (95/5, 90/10, 85/15 wt%) have been prepared by melt mixing. The purpose of the study is to investigate the differences between three kinds of PBS/cellulose blends in terms of mechanical properties, thermal properties, and crystallization, using Fourier transform infrared spectroscopy (FTIR), differential scanning calorimetry (DSC), scanning electron microscopy (SEM), and powder X-ray diffraction (XRD) analysis. Three kinds of blends obtained were enzymatically degraded by proteinase K. The difference in the enzymatic degradation of PBA/CMC, PBS/CA and PBS/CTA blends was determined by calculating the weight loss after degradation. The corresponding surface morphologies were observed under SEM.
2. Experimental
2.1. Materials
PBS was purchased from Anqing He Xing Chemical Corp. Ltd. (Anqing, China). The number-average molecular weight of PBS was from 150![[thin space (1/6-em)]](https://www.rsc.org/images/entities/char_2009.gif) 000 to 210
000 to 210![[thin space (1/6-em)]](https://www.rsc.org/images/entities/char_2009.gif) 000 g mol−1 determined by GPC. CMC, CA and CTA were purchased from Acros Organics (New Jersey, USA). The code no. of CMC, CA and CTA are 387242500, 177785000, and 177822500, respectively. The average particle size of CMC is 50 μm. The average molecular weight of CA is 100
000 g mol−1 determined by GPC. CMC, CA and CTA were purchased from Acros Organics (New Jersey, USA). The code no. of CMC, CA and CTA are 387242500, 177785000, and 177822500, respectively. The average particle size of CMC is 50 μm. The average molecular weight of CA is 100![[thin space (1/6-em)]](https://www.rsc.org/images/entities/char_2009.gif) 000 g mol−1. Cutinase was purified from zymotic fluid of recombinant Pichia pastoris containing a gene encoding cutinase from F. solani.12 All chemicals used in this work were of analytical grade.
000 g mol−1. Cutinase was purified from zymotic fluid of recombinant Pichia pastoris containing a gene encoding cutinase from F. solani.12 All chemicals used in this work were of analytical grade.
2.2. Preparation of PBS/cellulose blends
PBS, CMC, CA, and CTA were dried at 50 °C for 8 h in vacuum. PBS and three kinds of cellulose were mixed with ratios of 100/0, 95/5, 90/10, and 85/15 wt% in chloroform at 65 °C for 120 min. The obtained blends were hot-pressed at 160 °C and then cold-pressed at room temperature for 3 min. The samples were dried for 48 h in a fume hood and then vacuum-dried for 24 h at 50 °C to remove chloroform from the blends. The PBS/CMC blends are named PBS/CMC5, PBS/CMC10, and PBS/CMC15, which correspond to weight fractions of 95/5, 90/10 and, 85/15, respectively. PBS/CA and PBS/CTA blends follow the same method of naming.2.3. Characterization
 | (1) |
 | (2) |
3. Results and discussion
3.1. FTIR analysis
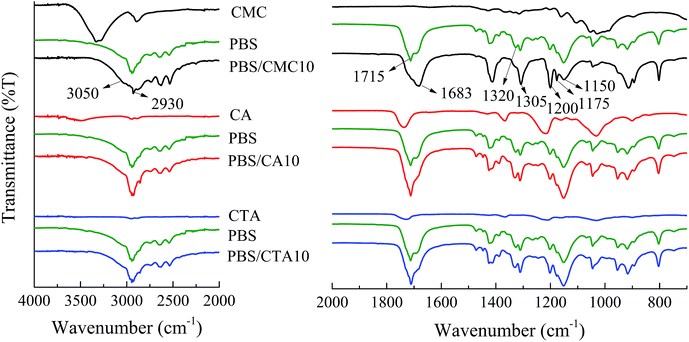
In general, FTIR is a sensitive and powerful tool for identifying the molecular environment of organics. It has been extensively used for investigating the weak interaction between polymer chains and other materials. FTIR spectra of pure PBS and three kinds of blends with a weight ratio of 90/10 are shown in Fig. 1. Although PBS/CMC10 has a similar spectrum to neat PBS, the spectral regions above 2930 cm−1 and 1683 cm−1 highlight the major differences. A broad peak at 3310 cm−1 is related to –OH in the pyranose rings of CMC, because all samples are dried before use.14 Considering that hydroxyl can rarely be removed completely from a cellulose surface, the peak could be found in the spectrum of PBS/CMC10. Even a small shift in absorption is important in determining the type of interaction formed in blended polymers.15 The peak at 3310 cm−1 shifts to a lower wavenumber and is merged with 2930 cm−1. Furthermore, the peak around 1715 cm−1 attributed to the –COO– bond in the ester group of PBS,9 shifts to 1683 cm−1 and is broadened in PBS/CMC10. In general, 1683 cm−1 is a characteristic peak related to the crystalline state. The intensity and position are related to the crystal defect, which is caused by the interaction between hydroxyl and carbonyl groups.16 In addition, the decrease in wavenumber and broadening in shape show that a weak hydrogen bond maybe produced between the hydroxyl group in CMC and the carbonyl group in PBS.17,18 In the region of 1320–1150 cm−1, the bands are attributed to the C–O–C stretching and the CH and CH2 bending modes. Five bands at 1320, 1305, 1200, 1175, and 1150 cm−1 dominate the spectra in neat PBS, whereas the peaks at 1200 and 1175 cm−1 are strengthened and 1320 cm−1 disappears in the spectra of PBS/CMC10. Accordingly, the bands in this region are very sensitive to the structure of the polymer.16,19 The obvious difference also verified the interaction between neat PBS and CMC molecules. However, PBS/CA10 and PBS/CTA10 have nearly the same spectra as neat PBS. It rarely has new peaks appearing or changing in shape, which indicates that no interaction occurs between the PBS matrix and the CA or CTA molecule.3.2. Fracture morphologies
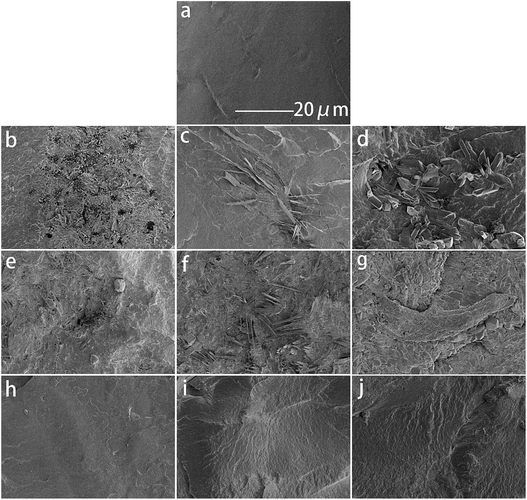
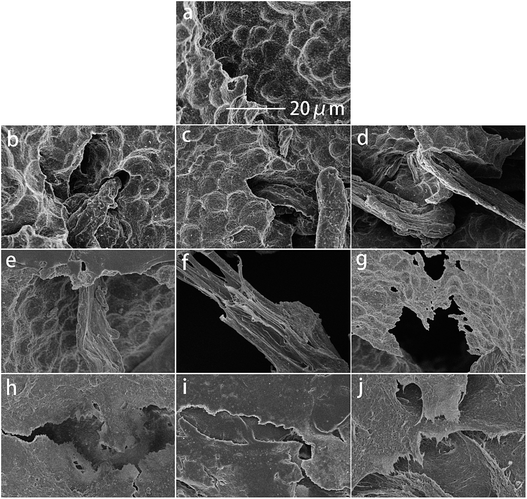
Fig. 2a–j show SEM images of the cryo-fractured surfaces of neat PBS and its blends, respectively. The fractured surface of neat PBS is smoother. Amounts of CMC particles are located on the surface of PBS (Fig. 2b–d), which might be due to the poor compatibility between the hydrophobic PBS matrix and the hydrophilic CMC. The aggregation and growth of the particles are caused by the intermolecular hydrogen bonds of CMC and the PBS matrix. Although numbers of CA blocks were uniformly dispersed in the PBS matrix, their size is smaller without the influence of a hydrogen bond. The filler particles stick up above the PBS matrix and form some pores in both the PBS/CMC and the PBS/CA blends because of their poor compatibility. For PBS/CTA series blends, CTA could disperse preferentially in the PBS matrix. Fine particles are tightly packed throughout the surface.3.3. Crystalline properties
DSC curves of the samples are illustrated in Fig. 3, and the crystallization temperature (Tc), melting temperature (Tm), crystallization enthalpy (ΔHc), melting enthalpy (ΔHm), and degree of crystallinity (Xc) are shown in Table 1. PBS is a typical semi-crystalline polymer. The Xc of PBS/CMC blends has a slight difference from neat PBS. Results are in agreement with the study of Zhang et al.7 These authors found that the crystallization rate and mechanisms of PBS did not change with the cellulose nanocrystal filling. However, the Tc and Xc of the PBS/CA blends are higher than those of neat PBS. In particular, the Tc and Xc of PBS/CA5 reach 62.3 °C and 62.6%, which are much higher than the 59.0 °C and 60.1% for neat PBS. The CA molecule acts as a nucleating agent and PBS would crystallize along the CA molecule with a certain ratio of length and diameter. When more than 10% CA is added to PBS, a smaller increase in Xc occurs. Higher amounts of CA increase the viscosity, which hinders the movement of the molecular chain and restricts the crystallization. As depicted in Fig. 3a, the crystallization temperature of neat PBS (59.0 °C) is approximately 5 °C lower than that of PBS/CMC and 3 °C lower than that of PBS/CA. The greater the cellulose content in the composites, the easier the crystallization of the blends, particularly for the PBS/CMC blends.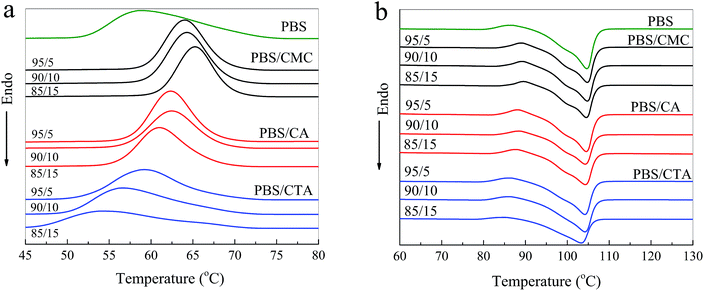 | ||
| Fig. 3 DSC curves of neat PBS and three kinds of PBS/cellulose blends on (a) first cooling run and (b) second heating run. | ||
| Sample | Tc (°C) | ΔHc (J g−1) | Tm (°C) | ΔHm (J g−1) | Xc (%) |
|---|---|---|---|---|---|
| PBS | 59.0 | 68.34 | 104.7 | 66.31 | 60.1 |
| PBS/CMC5 | 64.1 | 61.17 | 104.7 | 61.41 | 58.6 |
| PBS/CMC10 | 64.1 | 59.32 | 104.7 | 59.64 | 60.1 |
| PBS/CMC15 | 65.3 | 57.05 | 104.7 | 56.05 | 59.8 |
| PBS/CA5 | 62.3 | 65.66 | 104.6 | 65.63 | 62.6 |
| PBS/CA10 | 62.3 | 60.01 | 104.5 | 61.05 | 61.5 |
| PBS/CA15 | 60.9 | 57.36 | 104.4 | 57.38 | 61.2 |
| PBS/CTA5 | 58.8 | 66.99 | 104.2 | 60.47 | 57.7 |
| PBS/CTA10 | 56.7 | 60.54 | 103.8 | 57.97 | 58.4 |
| PBS/CTA15 | 54.5 | 46.33 | 102.4 | 44.23 | 47.2 |
However, Xc decreases obviously with an increase in CTA filler for the PBS/CTA blends and Xc decreases by approximately 13% for PBS/CTA15. In addition, the crystallization peak was flatter and blunter in the PBS/CTA samples. Thus, it could be assumed that the crystals in PBS/CTA are not homogeneous compared with those in the PBS/CMC or PBS/CA blends, which indicates that the addition of CTA destroyed the crystal uniformity of PBS. From Table 1, Tc shifts to 58.8, 56.7 and 54.5 °C for the PBS/CTA blends, respectively. A possible reason is that crystallization depends on the concentration and mobility of PBS molecular chains in the blend, which are restricted by the greater number of ester groups in CTA. The decrease in Tc may be due to the physical restrictions of the larger CTA molecule on the growth of PBS crystallites. Therefore, completing the crystallization is difficult for the composites with the addition of higher amounts of CTA filler.
From Fig. 3b, neat PBS shows an endothermic peak at around 104.7 °C and an exothermic peak at 86.0 °C assigned to the crystallization process.20 The variation in Tm of the PBS/CMC and PBS/CA blends is indeed not very obvious. Similar results have been found in the literature.9 By contrast, the Tm of PBS/CTA blends decreased obviously with an increase in CTA. The trends are in good agreement with the crystallization behavior and Xc of the blends (see Fig. 3a and Table 1). The decrease in Tm and ΔHm values in the melting process further suggests that a higher amount of CTA restricts the molecular mobility and hinders the crystallization to some extent.
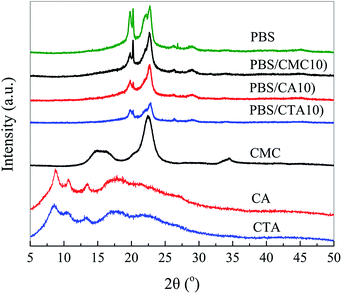
Fig. 4 is an XRD pattern of neat PBS and its blends. Neat PBS is determined to be a monoclinic structure and the diffraction peaks are observed at 19.5°, 21.5° and 22.5°, which correspond to the crystal planes (020), (021), and (110), respectively. All blends show a PBS type crystal phase. XRD patterns of CA and CTA present a broad diffraction peak with several weak crystalline peaks, which indicates that the celluloses are amorphous with very low crystallinity. The addition of CTA could not change the crystalline structure but decreased the crystallinity of PBS due to the decrease in the height of the diffraction peaks. This result is agreement with the conclusions determined by DSC (Table 1).
3.4. Mechanical properties
PBS is a typical tough polymer and has excellent mechanical properties, such as good tensile and impact strength. Blending PBS with other materials always worsens its mechanical behavior. The tensile strength, elongation at break and Young's modulus of neat PBS and its blends are presented in Fig. 5. Neat PBS has a tensile strength of 26.5 MPa, an elongation of 21.5%, and a modulus of 48 MPa. As shown in Fig. 5c, the incorporation of cellulose remarkably improved the Young's modulus of neat PBS. Young's modulus values sharply increase to average values of 50%, 35%, and 43% for PBS/CMC, PBS/CA, and PBS/CTA blends, respectively. This result indicates an enhancement in the rigidity of the blended materials. Liang et al.8 reported a similar result, which increased the tensile modulus to 53% by direct incorporation of 30% kenaf fiber to PBS without any modifications.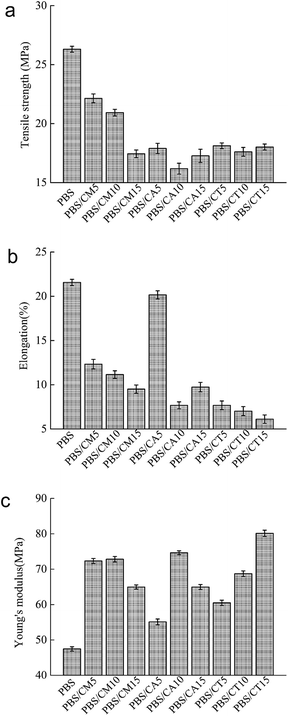 | ||
| Fig. 5 (a) Tensile strength, (b) elongation, and (c) Young's modulus of neat PBS and PBS/cellulose blends. | ||
The negative influence on the mechanical properties is mainly due to the poor compatibility between the polymer matrix and the filler. Adding CMC or CA into neat PBS drastically reduces its tensile strength and elongation at break, due to the presence of stress concentration. Agglomerations of cellulose, which are clearly evident in the SEM micrograph, acted as stress concentrators for crack initiation. Small droplets spread in the continuous PBS matrix for the PBS/CMC15 blend (see Fig. 2d). These CMC droplets behave as large stress concentrators in the blend with poor interfacial adhesion between them and the PBS matrix. Therefore, the PBS/CMC15 blend shows the lowest value in the CMC series blends. Although it is reduced with the increase in cellulose, the elongation of PBS/CA5 is close to that of neat PBS because the higher crystallinity of PBS/CA5 in some directions reduces the interface defects of the crystalline region and the amorphous area and makes the elongation longer. In addition, when well-dispersed CTA was added to neat PBS, the tensile strength and elongation at break were still low. Besides dispersion, adhesion and crystallinity could simultaneously influence the tensile strength and elongation. Thus, the tensile strength and elongation do not reach as high as the expected values due to the poor particle/matrix adhesion and crystallinity of PBS/CTA blends. The total mechanical properties of the PBS/CMC and PBS/CA blends are superior to those of the PBS/CTA blends. To improve the mechanical properties, the dispersion, adhesion and crystallinity must be enhanced simultaneously by adding compatibilizer, modifying the matrix with dicumyl peroxide or treating the cellulose with acetylchloride.
3.5. Enzymatic degradation
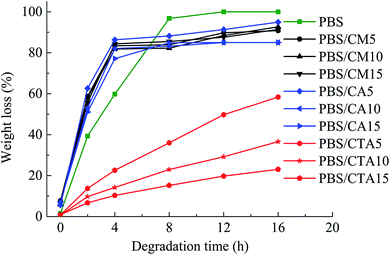
Fig. 6 shows the weight loss of the samples by enzymatic degradation. The CMC and CA series blends have a large weight loss even for a short period of enzymatic hydrolysis, indicating a severe microbial attack. The weight loss ratio is close to 60% after 2 h, which is faster than for neat PBS. A large surface of the PBS/CMC or PBS/CA blends was removed after 4 h and the weight loss ratio reached approximately 85% after 4 h and 95% after 16 h. Although PBS can be degraded completely after 12 h, the ratio is lower than that of PBS/CMC or PBS/CA blends after the first 6 h. However, the addition of CTA to PBS dramatically decreases the weight loss ratio. The ratio of PBS/CTA5 is lowered to 22.6% after 4 h, and to 58.4% after 16 h. As for the PBS/CTA10 and PBS/CTA15 blends, the degradation is further decreased. Although cellulose is slightly degraded by cutinase, the addition of CMC or CA produces holes in the bulk of the blends, as shown in Fig. 2. The interface cohesiveness is poorer and hence the holes are produced because of the poor compatibility between the PBS matrix and CMC or CA. The holes can offer active sites for cutinase to act on the blends and accelerate the degradation. However, the interface cohesiveness is better between CTA and the PBS matrix due to the good dispersion. Therefore, cutinase could with difficultly erode PBS and decrease the weight loss ratio. This result indicates that the rich filler dispersion in the PBS/CTA blends may increase the barrier, consequently leading to a lower biodegradability.Fig. 7 shows SEM images of neat PBS and its blends after enzymatic hydrolysis for 4 h. For CMC and CA series blends, cracks, holes, and even channels are formed with an increase in CMC or CA. The samples were almost completely degraded. However, only small cracks are formed along the surface of the PBS/CTA blends, which indicates a low weight loss (see Fig. 6). The weight loss of the PBS/CTA samples was lower than that of neat PBS, or the PBS/CMC and PBS/CA samples. In general, the amorphous regions are usually more susceptible to enzymes and microorganisms than the crystalline ones for a biodegradable polymer. Although all the samples have similar crystallinity, the difference in the weight loss was considerably larger. The degraded surfaces for the PBS/CTA (Fig. 7h–j) are very different compared with those for neat PBS, or the PBS/CMC and PBS/CA samples (Fig. 7a–g). In the PBS/CTA samples, the degraded surfaces are smooth and the depth of the layered fracture is shallow. While the surface of the degraded PBS, or PBS/CMC and PBS/CA samples is rough. Most of the surfaces show a spherulitic texture after enzymolysis for 4 h. These images indicate that the impinging lines of the spherulites are degraded first, and then the other parts of the spherulites are degraded. In addition, amounts of rod-like fibers were loosely packed in the fracture, which indicated that the cracks easily occurred at the boundary of the PBS matrix and the cellulose molecules. The holes and cracks are deeply inserted into the interior of the spherulites and fibers. The enzymatic molecules penetrate easily into the interior because of the less ordered chain conformation in the segment. The enzymatic degradation occurs preferentially in these disordered regions. Similar results have been reported in the enzymatic biodegradation of PHB21 and hydrolytic degradation of PBS.22 According to the images of the fractured surface, the particles of the PBS/CTA samples were packed densely due to their good dispersion (Fig. 2h–j). Therefore, enzyme molecules could not penetrate inside the bulk and the enzymolysis of the PBS/CTA samples occurred only on the surface (Fig. 7h–j).
4. Conclusions
In this work, three kinds of cellulose were blended with PBS to prepare composites with better solid-state properties and enzymatic degradation. The major properties of PBS-based blends with CMC, CA, and CTA are distinguished due to their different compatibilities. The differences in 2930, 1683, and 1320–1150 cm−1 absorption peaks showed that a weak hydrogen bond could be produced between the PBS matrix and the CMC molecules, which initiated the aggregation and growth of the CMC particles. The similar IR spectra indicate that no interaction occurred between the PBS matrix and CA or CTA. SEM images of the fractured surface show that CMC or CA particles stick up above the PBS matrix and form some pores due to their poor compatibility. However, the fine CTA particles could disperse preferentially in the PBS matrix and are tightly packed throughout the surface of PBS for the PBS/CTA blends. The difference in compatibility changes the solid-state properties and enzymatic degradation of the three kinds of blends. A high crystallization temperature shows that the addition of CMC or CA contributed to the crystallization of PBS. As a nucleating agent, the CA molecule increases the Xc of PBS in the PBS/CA blends. The Xc of the PBS/CTA blends decreases obviously with the increase in CTA filler and even reduces by about 13% for PBS/CTA15. In addition, the lower Tc and Tm values also illustrate that more ester groups in CTA molecules restrict the molecular mobility and hinder the crystallization to some extent. The incorporation of cellulose remarkably improved the Young's modulus of neat PBS, which increases to average values of 50%, 35%, and 43% for the PBS/CMC, PBS/CA and PBS/CTA blends, respectively. However, the tensile strength and elongation at the break are all decreased for different blends due to the poor dispersion and adhesion between cellulose and the PBS matrix. The total mechanical properties of the PBS/CMC and PBS/CA blends are superior to those of PBS/CTA blends.Although all the samples have similar crystallinity, the difference in the weight loss was considerably larger. The weight loss ratio of PBS/CMC or PBS/CA blends reached approximately 85% after enzymolysis for 4 h, which is faster than that of neat PBS. Whereas the average weight loss ratio of PBS/CTA blends decreased to 16% after 4 h. The surface of the degraded PBS, PBS/CMC or PBS/CA samples has a spherulitic texture, which easily formed many cracks, holes, and channels. Furthermore, CMC and CA fibers are loosely packed inside the fracture, and the cracks are deeply inserted into the interior of the blends. The enzymatic molecules penetrate easily into the interior because of the less ordered chain conformation in the segment. By contrast, the particles of PBS/CTA samples were packed densely due to good dispersion. The degraded surface is smooth and the depth of the layered fracture is shallow for the PBS/CTA blends. Only small cracks are formed along the surface. Therefore enzyme molecules could not penetrate into the interior of the bulk and the enzymolysis for PBS/CTA samples occurred only on the surface.
Acknowledgements
This work was supported by National Natural Science Foundation of China (Grant No. 31570097) and Science Project of Liaoning Province Education Office (Grant No. L2016002).References
- A. Bhatia and R. Gupta, Korea Aust. Rheol. J., 2007, 19, 125–131 Search PubMed.
- J. F. Martucci and R. A. Ruseckaite, Polym. Degrad. Stab., 2015, 116, 36–44 CrossRef CAS.
- H. Schmitt, K. Prashantha, J. Soulestin, M. F. Lacrampe and P. Krawczak, Carbohydr. Polym., 2012, 89, 920–927 CrossRef CAS PubMed.
- Y. Z. Wu, W. Xiong, H. Zhou, H. Li, G. Xu and J. Zhao, Polym. Degrad. Stab., 2016, 126, 22–30 CrossRef CAS.
- Q. Zhang, Q. Liu, J. E. Mark and I. Noda, Appl. Clay Sci., 2009, 46, 51–56 CrossRef CAS.
- S. Qian, H. Mao, E. Zarei and K. Sheng, J. Polym. Environ., 2015, 23, 341–347 CrossRef CAS.
- X. Z. Zhang and Y. Zhang, Carbohydr. Polym., 2016, 140, 374–382 CrossRef CAS PubMed.
- Z. Liang, P. Pan, B. Zhu, T. Dong and Y. Inoue, J. Appl. Polym. Sci., 2010, 115(6), 3559–3567 CrossRef CAS.
- L. N. Ludueña, E. Fortunati, J. I. Morán, V. A. Alvarez, V. P. Cyras, D. Puglia, L. B. Manfredi and M. Pracella, J. Appl. Polym. Sci., 2016, 133(15), 1–9 CrossRef.
- Y. Srithep, T. Ellingham, J. Peng, R. Sabo, C. Clemons, L. S. Turng and S. Pill, Polym. Degrad. Stab., 2013, 98, 1439–1449 CrossRef CAS.
- M. Zhou, M. Fan, Y. Zhao, T. Jin and Q. Fu, Carbohydr. Polym., 2016, 140, 383–392 CrossRef CAS PubMed.
- X. Hu, Z. Gao, Z. Wang, T. Su, L. Yang and P. Li, Polym. Degrad. Stab., 2016, 134, 211–219 CrossRef CAS.
- D. W. Van Krevelen, Properties of Polymers, Netherlands, Amsterdam, 1990 Search PubMed.
- N. Lin and A. Dufresne, Biomacromolecules, 2013, 14, 871–880 CrossRef CAS PubMed.
- M. Rennukka and A. Amirul, Polym. Bull., 2013, 70, 1937–1957 CrossRef CAS.
- H. Sato, J. Dybal, R. Murakami, I. Noda and Y. Ozaki, J. Mol. Struct., 2005, 744–747, 35–46 CrossRef CAS.
- J. S. Lim, I. Noda and S. S. Im, Eur. Polym. J., 2008, 44, 1428–1440 CrossRef CAS.
- W. Zhu, X. Wang, X. Chen and K. Xu, J. Appl. Polym. Sci., 2009, 114, 3923–3931 CrossRef CAS.
- H. Sato, R. Murakami, A. Padermshoke, F. Hirose, K. Senda, I. Noda and Y. Ozaki, Macromolecules, 2004, 37, 7203–7213 CrossRef CAS.
- P. J. Pan, L. Zhao and Y. Inoue, Macromol. Mater. Eng., 2013, 298, 919–927 CrossRef CAS.
- G. Tomasi, M. Scandola, B. H. Briese and D. Jendrossek, Macromolecules, 1996, 29, 507–513 CrossRef CAS.
- K. Cho, J. Lee and K. Kwon, J. Appl. Polym. Sci., 2001, 79, 1025–1033 CrossRef CAS.
| This journal is © The Royal Society of Chemistry 2017 |

