DOI:
10.1039/C7RA04752E
(Paper)
RSC Adv., 2017,
7, 35490-35495
Investigations on the existence of piezoelectric property of a bio-polymer – chitosan and its application in vibration sensors
Received
27th April 2017
, Accepted 1st July 2017
First published on 17th July 2017
Abstract
A variety of physical and chemical properties of bio-polymers like chitosan have been investigated although their inherent behavior, such as piezoelectricity, has not been investigated to date. In this study, an attempt has been made to investigate the presence of non-centrosymmetry in chitosan through X-ray diffraction (XRD) analysis and second harmonic generation (SHG) experiment. Existence of piezoelectricity is established by determining d33 coefficient for various pressures. With the help of the above mentioned results, a new application of the bio-polymer chitosan as a piezoelectric element in vibration sensors has been analyzed. To fabricate vibration sensor elements, chitosan was dissolved in various organic acids and its suitability for these applications was studied. Through isolation resistance measurement, the fabricated sensor is found to exhibit very high isolation, which is suitable even in hazardous environments. All the abovementioned investigations reveal the suitability of using chitosan in vibration sensors.
Introduction
The family of polymers, such as chitin and chitosan, possesses a variety of physical and chemical properties. In nature, chitin is found in the exoskeletons of arthropods and insects, shells of molluscs, pens and beaks of cephalopods, and cell-wall fungi such as Mucoraceae. Commercially, chitin and its derivatives, such as chitosan, are isolated from shells of crab, shrimp, prawn etc. via conventional steps such as demineralization, deproteinization, decolouration and deacetylation.1 Chitosan is the second most generous natural polysaccharide after cellulose on earth. These kind of resources are estimated to be available in ∼100 billion tons in nature.2 Contrary to chitin, both amino and hydroxyl groups of chitosan can be selectively modified for versatile applications. Chitosan exhibits several properties such as biocompatibility, biodegradability, non-toxicity, and easily film formation ability that are advantageous for industrial and biomedical applications such as water treatment,3 dye removal,4 tissue engineering,5 wound healing and dressing,6,7 and drug delivery.8 Silva et al. have reported that the addition of chitosan to collagen polymer9 exhibits a considerable increment in the piezoelectric strain constant (d14). Recently, ferroelectric materials such as ZnO and BaTiO3 exhibiting piezoelectric property were embedded in chitosan polymer and used for the detection of mechanical excitation, where the piezoelectric nature of ZnO and BaTiO3 was focused on and the electret was tested for mechanical sensing applications.10,11 In the present study, an attempt has been made to investigate the existence of non-centrosymmetry in chitosan through second harmonic generation (SHG) and that of piezoelectric property by measuring the piezoelectric strain coefficient (d33). After the analysis of SHG and d33 data, isolation measurements of the chitosan samples are conducted by 80 Hz mechanical excitation. Sensitivity and selectivity of chitosan dissolved in various organic acids were studied and have been reported.
Experimental techniques
Chitosan used in the preparation of sensor elements was of analytical grade and procured from Pelican Biotech and Chemical Labs, India, and organic acids (such as formic, acetic, adipic, and succinic acids) were procured from CDH, India, without further purification for the investigations. The degree of deacetylation (DDA) of chitosan was 91.2%. The flakes of chitosan were fine grained with formic acid in an agate mortar that was air dried for few hours, and pellets of thickness 1.3 mm were prepared using the manual hydraulic pressure unit for the piezoelectric strain coefficient (d33) measurement. Since film-casting method is a very simple and cost-effective technique for making freestanding films of chitosan, casting technique has been adopted for the preparation of samples. Thin films of chitosan were prepared by dissolving chitosan in formic, acetic, adipic, and succinic acids in separate flasks with an optimum concentration of 1.5% and stirred using a mechanical stirrer. The percentage of acid used for dissolving chitosan was optimized at 0.1, 0.25, 0.5, 0.75, 1.0, 1.25, and 1.5%. As free-standing films of chitosan are necessary for vibration sensing measurement, the transparent solution was accurately weighed and cast on glass Petri dishes of equal area. The samples were air dried and undisturbed for 72 hours. Samples that were cast below the concentration of 1.5% were highly reedy, sticking to the substrate, and unable to peel off. Hence, finally, thin films of 30 μm were peeled off from the substrate, and the solvent concentration 1.5% was chosen for vibration sensing analysis. However, thin films prepared by dissolving chitosan in formic acid are flexible and user friendly, whereas those prepared in acetic, adipic, and succinic acids are brittle and less stable and hence cannot be utilized as an element for the vibration sensing. Thus, chitosan dissolved in formic acid is highly focused in this study. Further, vibration sensing nature of these films is compared with that of the films obtained by dissolving chitosan in other organic acids such as acetic, adipic, and succinic acid.
Results and discussion
Structural analysis of chitosan
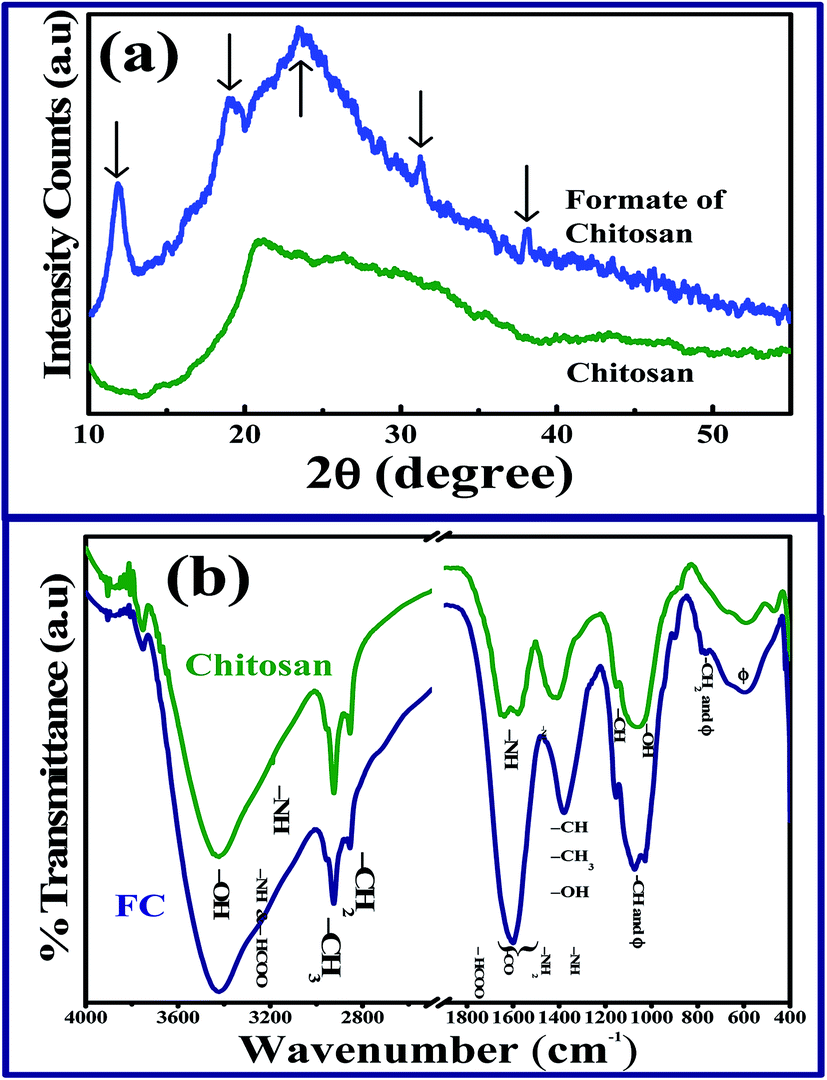
X-ray diffraction analysis. XRD profiles of chitosan and formate of chitosan (FC) are shown in Fig. 1a. The XRD spectrum of FC exhibits five major peaks at 11.9°, 19°, 23.4°,31.2°, and 38° in the amorphous background of chitosan, which agrees with the study conducted by Ogawa et al.12 and reveals the hydrated nature and eight-fold helical conformation of chitosan, whereas the unreacted chitosan fragment has an extended two-fold helix. The reflection peaks are due to ionic crosslinking of chitosan, confirming the increase in the crystallinity of the sample. The crystallinity of chitosan decreases with the increase in DDA,13 which exhibits a broad hump around 23.4°, confirming the semicrystalline nature of the sample. The sharp peak for FC at 11.9° and the weak peak at 19° confirm the hydrated nature of the sample. The broad absorption is elevated to 20.8° for the pure chitosan sample, which endorses the amorphous nature of the chitosan matrix.14 Hence, on comparing the XRD profile of chitosan and FC, the influence of the formic acid anion on the chitosan matrix was established. Considering the structural properties of chitosan, there are only two possible space groups15 available: P212121 and P21212. Biological macromolecules, such as chitosan, consist of building blocks such as glucosamine, and in general, these building block structures are asymmetrical and their mirror reflections do not exist in nature. Hence, space groups with mirror reflection or inversion centres are not allowed for crystals of these molecules. From the data of occurrence of the space group for the protein crystal, probability of occurrence of P212121 (ref. 16) is larger than that of P21212. Therefore, the most favourable space group of chitosan is chosen as P212121. Among the orthorhombic subgroups, cubic space groups of classes 23 and 432, which contain P212121, are non-centrosymmetric,17 where the origin is chosen in a way that it is surrounded by three pairs of 21 axes. This principle maintains the aforementioned orthorhombic subgroups. In this study, for the first time, an attempt has been made to investigate the piezoelectric property of chitosan by considering its orthorhombic structure with P212121 space group, thus confirming the existence of non-centrosymmetry, and chitosan is tested for its application in vibration sensors.
 |
| | Fig. 1 (a) XRD profile and (b) FTIR spectra of chitosan and formate of chitosan. | |
Infrared active modes of chitosan. Room-temperature Fourier transform infrared spectra (FTIR) were obtained in the range of 4000–400 cm−1 using Perkin Elmer LS 55 spectrometer with 2 cm−1 resolution. To avoid the presence of residual water content in the sample, all the samples were dried and used for the measurements. The spectra were obtained using KBr pellets prepared at a pressure of 740 MPa. In the IR spectra of chitosan, the broad absorption band at 3422 cm−1 corresponds to the stretching mode of the free hydroxyl group (–OH) since the structure of pure chitosan is stabilized by inter- and intramolecular hydrogen bonds. When glucosamine units in chitosan are protonated by formic acid, the hydrogen bond involving the amide group (–NH2) is shifted by 14 cm−1, as shown in Fig. 1b. Hence, the physical attachment of formate to the amide group of chitosan is confirmed. The IR active modes of chitosan are provided in Table 1.
Table 1 IR active modes of chitosan and formate of chitosan and their respective vibrations in cm−1a
| S. No. |
Wavenumber13,18–20 (![[small lambda, Greek, macron]](https://www.rsc.org/images/entities/i_char_e0cc.gif) ) ) |
Chitosan |
Formate of chitosan |
| Observed |
Assignment |
Observed |
Assignment |
| ν – stretching, δ – in-plane bending and ρ – rocking vibrations; ϕ – pyranoid ring. |
| 1 |
3428 |
3422 |
ν(OH) |
3422 |
ν(OH) |
| 2 |
3196 |
3340 |
ν(NH) |
3354 |
ν(NH) + ν(HCOO) |
| 3 |
2919 |
2924 |
ν(CH3) |
2926 |
ν(CH3) |
| 4 |
2875 |
2872 |
ν(CH2) |
2874 |
ν(CH2) |
| 5 |
|
2854 |
|
2854 |
|
| 6 |
1658 |
1654 |
ν(CO) |
1600 |
ν(CO) + δ(NH) + δ(NH2) + ν(HCOO) |
| 7 |
1627 |
1638 |
δ(NH) chitin |
| 8 |
1565 |
1578 |
δ(NH2) |
| 9 |
1422 |
1424 |
δ(CH) + δ(OH) |
1380 |
δ(CH) + δ(OH) + δ(CH3) |
| 10 |
1417 |
1410 |
δ(CH3) + δ(CH) chitin |
| 11 |
1156 |
1150 |
δ(CH) + δ(OH) |
1154 |
δ(CH) + δ(OH) |
| 12 |
1075 |
1070 |
|
1076 |
|
| 13 |
1033 |
1026 |
ν(ϕ) + δ(CH) |
1034 |
ν(ϕ) + δ(CH) |
| 14 |
896 |
906 |
ν(ϕ) + ρ(CH2) |
902 |
ν(ϕ) + ρ(CH2) |
| 15 |
830 |
|
854 |
|
| 16 |
595 |
594 |
δ(ϕ) |
592 |
δ(ϕ) |
| 17 |
465 |
474 |
δ(COC) chitin |
|
|
Scanning electron microscopy analysis. On dissolving chitosan in formic, acetic, adipic, and succinic acids, different morphological changes were observed via scanning electron microscopy (SEM). Chitosan dissolved in formic acid exhibits a smooth surface unlike that dissolved in acetic, adipic, and succinic acids. Further, thickness of the film is measured and depicted in Fig. 2.
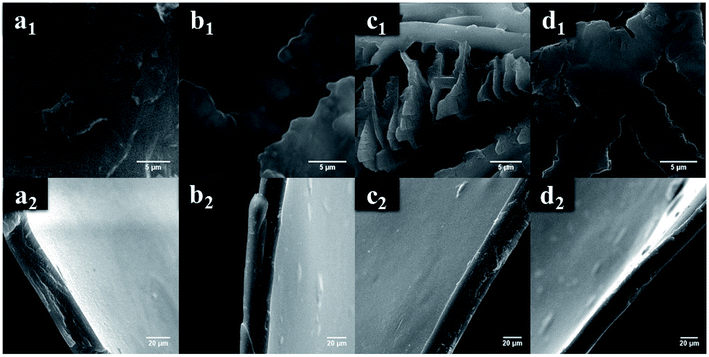 |
| | Fig. 2 Scanning electron images with top and cross sectional views of chitosan dissolved in (a) formic (b) acetic (c) succinic and (d) adipic acids. | |
Second harmonic generation (SHG) of chitosan. Typical confirmation of the existence of non-centrosymmetry of the system was further tested via generation of second harmonic signals. Hence, chitosan flakes were verified for SHG with excitation of 1064 nm using a Nd:YAG laser. The laser power used was typically less than 100 mW to avoid local heating of the sample. The generated second harmonic signals were compared with those of potassium diphosphate (KDP) crystal as a reference. Intensity of SHG signals generated for chitosan and formate of chitosan were 90% and 86% with respect to the KDP crystal, respectively. Although there is a small reduction in the SHG signal of chitosan dissolved in formic acid, the non-centrosymmetry is not altered. Hence, the existence of non-centrosymmetry in chitosan is well established, which will provide a new way for the fabrication of devices such as piezoelectric pressure sensors. SHG signals of chitosan and formate of chitosan are depicted in Fig. 3a with the comparison of the Nd:YAG source and KDP reference. Normalized SHG intensities and SHG intensity at 532 nm for chitosan dissolved in formic, acetic, succinic, and adipic acids are shown in Fig. 3b and c, respectively. Fig. 3b and c show that the intensity of the SHG signal is more pronounced 532 nm for chitosan dissolved in formic acid than that for chitosan dissolved in other organic acids, indicating the manifestation of the non-centrosymmetric nature.
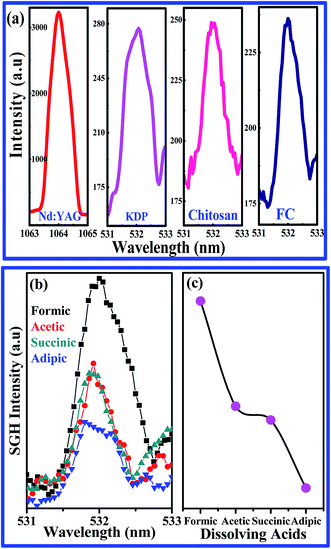 |
| | Fig. 3 (a) SHG signals of Nd:YAG source, KDP, chitosan and formate of chitosan (b) normalized SHG intensities and (c) SHG intensity at 532 nm of chitosan dissolved with formic, acetic, succinic and adipic acids. | |
Piezoelectric coefficient (d33) of chitosan. Piezoelectric strain coefficient of formate of chitosan is measured for various pressures as a function of sintering temperature. Since the measured d33 values are oscillatory, the most stable values are averaged and are presented in Fig. 4. From the measurement of the d33 coefficient, it is observed that up to 330 K, the sample is stable and has a maximum d33 coefficient of 18.4 pC N−1 for a load of 5 tons. Further increase in temperature leads to decrease in the d33 coefficient, which may due to the disappearance of non-centrosymmetry of chitosan. The measured d33 coefficients with the experimental errors are given in Table 2.
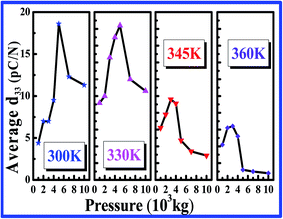 |
| | Fig. 4 d33 coefficient of formate of chitosan for various pressures and sintering temperatures. | |
Table 2 d33 coefficient of pellets of chitosan of 1.3 mm thickness for various temperatures and applied pressures
| Pressure (103 kg per 42.25 mm2) |
d33 coefficient (pC N−1) |
| Temperature (K) |
| 300 |
330 |
345 |
360 |
| 1 |
4.4 ± 0.4 |
9.2 ± 0.2 |
6.2 ± 0.2 |
4.2 ± 0.2 |
| 2 |
7.0 ± 0.3 |
10.0 ± 0.2 |
7.8 ± 0.1 |
6.2 ± 0.2 |
| 3 |
7.0 ± 0.3 |
14.6 ± 0.1 |
9.6 ± 0.1 |
6.4 ± 0.1 |
| 4 |
9.5 ± 0.2 |
17.0 ± 0.1 |
9.1 ± 0.1 |
5.2 ± 0.2 |
| 5 |
18.6 ± 0.1 |
18.4 ± 0.1 |
4.7 ± 0.2 |
1.2 ± 0.8 |
| 7 |
12.3 ± 0.1 |
12.0 ± 0.1 |
3.4 ± 0.3 |
1.0 ± 0.9 |
| 10 |
11.3 ± 0.2 |
10.6 ± 0.1 |
2.9 ± 0.2 |
0.8 ± 1.1 |
Application: chitosan as a vibration sensor
The existence of non-centrosymmetry and hence the piezoelectricity in the chitosan are confirmed through the abovementioned experiments: SHG and d33 measurements. Although it exhibited non-centro symmetry and hence the piezoelectric property, it was tested for suitability in applications such as in vibration sensors. The chitosan samples were also tested for the isolation measurement and mechanical excitation by an 80 Hz shaker, as given in Fig. 5a.
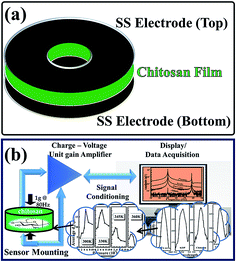 |
| | Fig. 5 (a) Chitosan film with stainless steel (SS) electrode plate. (b) Schematic of mechanical excitation measurement and data acquisition. | |
Electrical response of chitosan: isolation resistance. If the prepared sensor material is used in a precarious setting, it is very essential to establish an isolation between the sensor and the test material ground. The maximum isolation required for safety measurement is only ∼100 Vdc. Therefore, if the samples are capable of more than the required isolation, then they can be used as a sensor material for mechanical sensing. The chitosan films (formate, acetate, succinate, and adipate) were electrically characterized using the isolation meter at 50, 100, 250, 500, and 1000 Vdc. The isolation resistance is given in Table 3. It is observed that our samples have very high isolation resistance (∼0.4 to more than 1 GΩ) as compared to those obtained in our earlier studies,10,11 which confirms the suitability of formate of chitosan for the fabrication of mechanical sensor elements.
Table 3 Isolation resistance of thin films of formate, acetate, succinate and adipate of chitosan
| S. No. |
Sample legend |
Isolation measurement |
| 50 Vdc |
100 Vdc |
250 Vdc |
500 Vdc |
1000 Vdc |
| 1 |
Formic |
>1 GΩ |
>1 GΩ |
401 MΩ |
516 MΩ |
500 MΩ |
| 2 |
Acetic |
>1 GΩ |
>1 GΩ |
>1 GΩ |
>1 GΩ |
>1 GΩ |
| 3 |
Succinic |
>1 GΩ |
>1 GΩ |
>1 GΩ |
>1 GΩ |
>1 GΩ |
| 4 |
Adipic |
>1 GΩ |
>1 GΩ |
>1 GΩ |
>1 GΩ |
>1 GΩ |
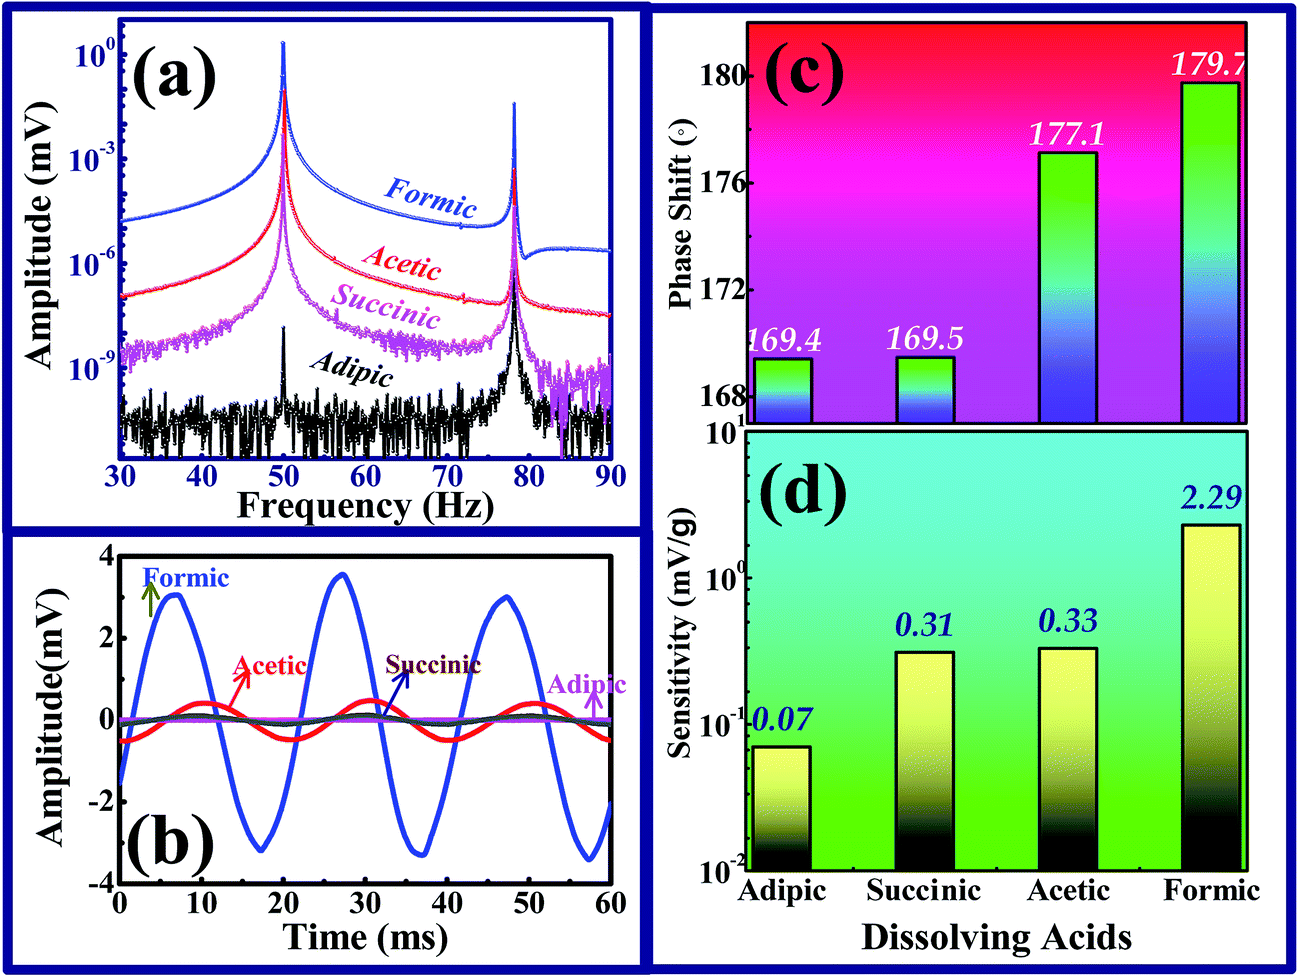
Mechanical response of chitosan: detection of 80 Hz mechanical oscillations. Thin films of chitosan are mounted between the isolation stud and the stainless steel electrode by spot welding technique. The whole setup now acts as a mechanical sensor when it is excited. When mechanical excitation is applied on the electrode disks, it leads to compression and decompression of the chitosan films, which generates charge output based on the magnitude of mechanical excitation. An electrical connection is made to the microdot cable of RG188 standard, and it is attached to the signal conditioner of PCB 481 series for high frequency data acquisition. The top and bottom electrodes are attached with a lead wire for the measurement of charge. This total assembly and the top and bottom disks are isolated from each other by PTFE isolation tape. Hence, the erroneous output from the sensor system is eliminated. The schematic of the measurement of mechanical excitation and data acquisition is depicted in Fig. 5b, and with this arrangement, the fabricated sensor films are excited mechanically by the generation of 80 Hz mechanical oscillations at 1 gravitational acceleration (g) level. Hence, the charge developed in the fabricated chitosan film corresponds to 1g, which is almost equivalent to the sensitivity of the sensor element. To confirm the applicability and the realization of chitosan as a sensor, thin films of chitosan are mounted parallel with the commercially available Endevco-make sensor. When the mechanical excitation of 80 Hz at 1g level is applied, the output of the sensor is fed through a Kiestler-make charge-voltage amplifier with unit gain to the signal conditioner. The acquired output is analyzed by the fast Fourier transform (FFT) algorithm to study the frequency components present in the spectrum. Due to the presence of charge leakage in electronic components and other elements such as power line, the output signal experiences noise at 50 Hz. Hence, the output spectrum consists of both 50 Hz and 80 Hz components. FFT spectra of chitosan-based sensors for various acids are shown in Fig. 6a. While fabricating the sensor, it is very essential to eliminate noise from the output, and the power line leakage at 50 Hz may be removed by making a filter circuit, as reported by Wang et al.21 If the filter circuit is used for the removal of noise from the output spectrum, it may lead to the loss of sensitivity of the sensor and also letdown in detecting mechanical excitation. As an alternative to the abovementioned filter circuit, the sensor could be designed with a hermetical shield, as reported in literature.10,11,22
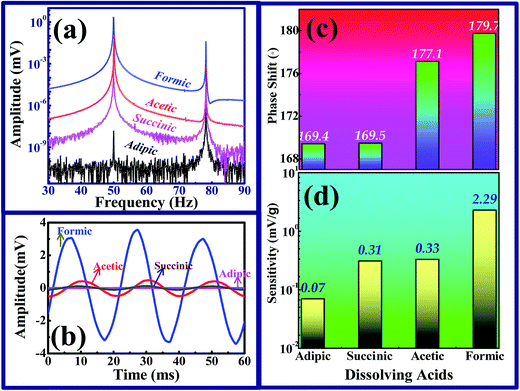 |
| | Fig. 6 (a) FFT spectra, (b) output amplitude, (c) phase shift and (d) sensitivity of chitosan based sensor. | |
Sensitivity of chitosan dissolved in organic acids. The output signals obtained from the mechanically excited thin films of chitosan dissolved in organic acids and the commercial sensor are out of phase in amplitude. The output of the chitosan based sensor is shown in Fig. 6b and the phase shifts are compared with those of the commercial sensor output, which is depicted in Fig. 6c. While studying the effect of dissolution of chitosan on these acids, the sensitivity of formate of chitosan is quite high. Hence, formic acid is endorsed to be the most appropriate acid for sensor fabrication. The sensitivity of various dissolving acids of chitosan is depicted in Fig. 6d.
Conclusion
In the present study, an attempt was made to investigate the existence of non-centrosymmetry of a biopolymer, namely chitosan, through XRD analysis and second harmonic generation experiments. From the SHG experiment, the frequency splitting was observed at 532 nm with the 1064 nm Nd:YAG source, which confirmed the non-centrosymmetry nature of the chitosan samples due to which the chitosan exhibited piezoelectric property. Temperature-dependent d33 coefficients for various pressures confirmed the existence of piezoelectricity. Based on the abovementioned results, chitosan was dissolved in various organic acids such as formic, acetic, succinic, and adipic, and the suitability of chitosan film for vibration sensors was studied. Compared with other acids, films prepared by dissolving chitosan in formic acid provided good sensitivity for the sensor. From the isolation resistance measurement, the fabricated sensor films were established to have a very high isolation (∼0.4 to more than 1 GΩ) suitable for precarious condition, whereas the explosive environment need isolation only up to 100 MΩ. However, the excitation vibration is 80, Hz at 1g, and the output signals are developed with a noise at 50 Hz due to power line leakage. However, the fabrication of the sensor causes a leakage that may be removed by hermitic shielding. All the abovementioned investigations reveal the suitability of chitosan films in vibration sensors.
Acknowledgements
Authors K. Jayakumar and E. Praveen thank Indian Space Research Organization – India for the financial support under the RESPOND program.
References
- M. Rinaudo, Prog. Polym. Sci., 2006, 31, 603–632 CrossRef CAS.
- M. Ioelovich, Res. Rev.: J. Chem., 2014, 3, 7–14 Search PubMed.
- I. G. Lalov, I. I. Guerginov, M. A. Krysteva and K. Fartsov, Water Res., 2000, 34, 1503–1506 CrossRef CAS.
- M. Vakili, M. Rafatullah, B. Salamatinia, A. Z. Abdullah, M. H. Ibrahim, K. B. Tan, Z. Gholami and P. Amouzgar, Carbohydr. Polym., 2014, 113, 115–130 CrossRef CAS PubMed.
- Y. Zhang and M. Zhang, J. Biomed. Mater. Res., 2001, 55, 304–312 CrossRef CAS PubMed.
- D. Archana, J. Dutta and P. K. Dutta, Int. J. Biol. Macromol., 2013, 57, 193–203 CrossRef CAS PubMed.
- R. Jayakumar, M. Prabaharan, P. T. Sudheesh Kumar, S. V. Nair and H. Tamura, Biotechnol. Adv., 2011, 29, 322–337 CrossRef CAS PubMed.
- S. Torrado, P. Prada, P. M. De La Torre and S. Torrado, Biomaterials, 2004, 25, 917–923 CrossRef CAS PubMed.
- A. S. Sombra, C. C. Silva, C. G. A. Lima, A. G. Pinheiro, J. C. Goes and S. D. Figueiro, Phys. Chem. Chem. Phys., 2001, 3, 4154–4157 RSC.
- S. Murugan, D. Karthikesan, S. Sellathurai, E. Praveen and K. Jayakumar, Fifth International Symposium on Electronic System Design (ISED) Surathkal, 2014, pp. 199–202 Search PubMed.
- E. Praveen, S. Murugan and K. Jayakumar, AIP Conf. Proc., 2015, 1665(050032), 1–3 Search PubMed.
- K. Ogawa and S. Inukai, Carbohydr. Res., 1987, 160, 425–433 CrossRef CAS.
- A. Pawlak and M. Mucha, Thermochim. Acta, 2003, 396, 153–166 CrossRef CAS.
- K. Ogawa, S. Hirano, T. Miyanishi, T. Yui and T. Watanabe, Macromolecules, 1984, 17, 973–975 CrossRef CAS.
- N. Cartier, A. Domard and H. Chanzy, Int. J. Biol. Macromol., 1990, 12, 289–294 CrossRef CAS PubMed.
- E. Arnold, D. M. Himmel and M. G. Rossmann, Basic Crystallography, in International Tables for Crystallography Volume F: Crystallography of biological macromolecules, ed. J. Drenth, Kluwer Academic Publishers, Netherland, 2006, ch. 2.1, pp. 45–63 Search PubMed.
- T. H. Hahn, Contents and arrangement of the tables, in International Tables for Crystallography, Volume A: Space Group Symmetry, ed. T.H. Hahn and A. Looijenga-Vos, 2006, ch. 2.2, pp. 17–41 Search PubMed.
- Z. Osman and A. Arof, Electrochim. Acta, 2003, 48, 993–999 CrossRef CAS.
- A. Zając, J. Hanuza, M. Wandas and L. Dymińska, Spectrochim. Acta, Part A, 2015, 134, 114–120 CrossRef PubMed.
- A. Sionkowska, Biomaterials, 2004, 25, 795–801 CrossRef CAS PubMed.
- Y. S. Wang, Y. X. Gai and S. M. Li, 2011 Int. Conf. Control. Autom. Syst. Eng. CASE 2011, 2011, pp. 2–5 Search PubMed.
- S. Murugan, M. V. N. Prasad and K. Jayakumar, AIP Conf. Proc., 2016, 1731(050003), 1–3 Search PubMed.
|
| This journal is © The Royal Society of Chemistry 2017 |
Click here to see how this site uses Cookies. View our privacy policy here. 
 Open Access Article
 This Open Access Article is licensed under a
  *a
*a