
 Open Access Article
 This Open Access Article is licensed under a
 Creative Commons Attribution 3.0 Unported Licence
High-performance of self-powered UV photodetector with long-term stability based on ZnO nanorods and an iodine-free quasi solid-state electrolyte
Xiaoli Peng,
Yiyu Zeng,
Xinhua Pan *,
Weihao Wang,
Yonghui Zhou,
Fengzhi Wang,
Qiaoqi Lu and
Zhizhen Ye*
*,
Weihao Wang,
Yonghui Zhou,
Fengzhi Wang,
Qiaoqi Lu and
Zhizhen Ye*
State Key Laboratory of Silicon Materials, Cyrus Tang Center for Sensor Materials and Applications, School of Materials Science and Engineering, Zhejiang University, Hangzhou 310027, People's Republic of China. E-mail: panxinhua@zju.edu.cn; yezz@zju.edu.cn; Fax: +86 571 87952124; Tel: + 86 571 87952187
First published on 6th June 2017
Abstract
Vertical zinc oxide nanorods (ZnO NRs) were grown on a fluorine-doped tin oxide coated glass substrate using a simple hydrothermal method. A novel iodine-free quasi solid-state electrolyte containing 1-methyl-3-propylimidazolium iodide, potassium iodide (KI) and poly(ethylene oxide) (PEO) was prepared. KI acted as a charge transfer auxiliary agent and PEO was used to solidify the liquid electrolyte. A self-powered photoelectrochemical cell type ultraviolet (UV) photodetector was fabricated, using ZnO NRs as the active photoanode and the quasi solid-state electrolyte as the electrolyte. The dependence of the photocurrent on the iodine-free quasi solid-state electrolyte containing different amounts of KI and PEO was investigated in detail. An optimal photocurrent can be obtained when the amount of KI and PEO was up to 0.03 g and 0.2 g, respectively, and the photodetector shows high responsivity (2.33 A W−1) and high sensitivity (533). The performance of the self-powered UV photodetector showed no obvious decay four months later, which shows great stability.
1 Introduction
Ultraviolet (UV) photodetectors are used in many fields such as environmental monitoring, biomedicine, space research, optical communication and so on1–3 However, lots of them need a certain applied potential in order to obtain reasonable detectivity, which makes the overall circuitry heavy and uneconomical in the present energy situation. As a result, a self-powered photodetector, which can be used in many harsh environments without external power, has gained great attention. In terms of interface, self-powered photodetectors can be divided into three types: p–n junction type, Schottky junction type and photoelectrochemical cell (PECC) type.4–9 The PECC type photodetectors have a low cost, simple manufacturing process, fast time response, and high spectral selectivity compared with other types.10–12 This type of photodetector includes three main parts: oxide as the active photoanode, a counter electrode and an electrolyte. It is known that the electrolyte has a great influence on the performance of the device.13 Traditional organic liquid electrolyte usually contains I−/I3− as the redox couple. Unfortunately, this liquid electrolyte leak outs easily and then evaporates, which results in low long-term stability and difficulty in sealing.14 Therefore, many quasi solidification electrolytes have been investigated extensively, because they can simultaneously hinder the cohesive property of a solid and the diffusive property of a liquid. Also, the iodine (I2) in the electrolyte is prone to corrode the electrode and evaporate, which will affect the efficiency of the device and be harmful to the environment. Thus, iodine-free ionic liquid electrolytes have received great attention because of their unique properties, such as being environmentally friendly, having high ionic conductivity, good chemical and thermal stability, low volatility and the ability to dissolve various solutes.15–17 A proper metal salt is usually added into the iodine-free ionic liquid electrolytes to improve the photoelectric performance and to coordinate with the polymeric ionic liquid electrolyte to improve the solubility of solvent.As for the active photoanode materials, in recent years, zinc oxide (ZnO) has attracted much more attention for its great potential in high performance UV photodetectors, because of its several attractive physical properties.18,19 In particular, ZnO is a wide, direct bandgap (∼3.37 eV) n-type semiconductor with large exciton binding energy (∼60 meV), high carrier mobility, and high resistance irradiation and it is environmentally friendly, which makes it suitable to be used as a UV photodetector without extra filters.20 Up to now, because of the increasing mature synthesis methods of ZnO, various nanostructured morphologies such as nanorods (NRs), nanobelts, nanocombs, nanosprings, and so on, are easy to obtain.21–25 One-dimensional ZnO NRs are particularly appealing, because their large surface area and high aspect ratio enable efficient carrier transport and high diffusion length for the ZnO/electrolyte PECC type photodetector. ZnO-based UV photodetectors have been studied intensively in recent years, and lots of them are based on solid-state junctions involving a Schottky barrier, p–n junction, p–i–n junction and metal–semiconductor–metal.26–28 However, these photodetectors need rigid epitaxial processes and single crystal substrates to satisfy the high photosensitivity and high photoresponse speed requirements, which result in a high production cost. Also, these photodetectors often need an external bias to serve as the driving force to maintain the working of the device, which is a burden for today's energy situation. The PECC type UV photodetector based on ZnO NRs/electrolyte is self-powered and it can operate sustainably without an additional battery, and this photodetector exhibits a practical UV detecting performance avoiding the complicated epitaxial process.
In this research, the ZnO NRs were synthesized using a simple hydrothermal method.29,30 Then, an iodine-free quasi solid-state electrolyte containing potassium iodide (KI), poly(ethylene oxide) (PEO) and 1-methyl-3-propylimidazolium iodide (PMII), was prepared and then assembled with ZnO NRs to fabricate a high efficiency self-powered PECC type UV photodetector. This photodetector has a large photocurrent, fast photoresponse speed, high responsivity, high sensitivity and great stability. The dependence of the photoelectric performances on the iodine-free electrolytes containing different KI contents and PEO contents were further investigated in detail.
2 Experimental section
2.1 Synthesis of ZnO NRs
All the chemicals in this research were of analytical grade and used directly without any further purification. The synthesis of ZnO NRs on fluorine-doped tin oxide (FTO) substrates was prepared using a simple hydrothermal method. The seed solution was first prepared by dissolving 0.75 M zinc acetate (Sigma-Aldrich) in 0.75 M mixed solution of ethanolamine and 2-methoxyethanol (Sigma-Aldrich). The solution was then stirred at 60 °C for 2 h to yield a homogeneous solution and the stirring was continued at room temperature for 12 h to obtain the final product which was used as the coating solution. Then the coating solution was spun on a clean substrate followed by heating it for 5 min at 200 °C. This process was repeated twice and then the substrate was annealed for 1 h at 400 °C. Afterwards, the coated substrate with the coating side upside down was immersed in a growth solution containing 20 mM zinc nitrate and 20 mM hexamethylenetetramine (C6H12N4) loaded in a Teflon lined stainless-steel autoclave at 90 °C for 4 h. After the reaction was complete, the ZnO NRs grown were thoroughly rinsed with ethanol and deionized water carefully followed by a drying step in an oven at 60 °C overnight.2.2 Preparation of quasi solid-state electrolytes
The iodine-free quasi solid-state electrolyte was prepared by dissolving 50 mg of PMII in 2.5 mL acetonitrile, and stirred for about 30 min. To investigate the optimum content of KI and PEO needed in the electrolyte, two groups of electrolyte were prepared. KI was added into the solution with content of 0, 0.02 g, 0.03 g or 0.04 g under stirring, and afterwards 0.2 g of PEO was added and stirred overnight to obtain the desired homogeneous electrolyte. The corresponding electrolyte is designated as A1–A4 (see Table 1). Using the same method, the amount of KI (0.03 g) was kept constant, the content of PEO was changed, suing amounts varying from 0 to 0.4 g to obtain the other group of electrolytes and which were designated as B1–B5 (see Table 2). The electrolyte solutions were kept under stirring for about 1 h before each measurement to ensure that the electrolyte homogeneous.| Samples | KI (g) | PEO (g) | τg (s) | τd (s) | Remarks |
|---|---|---|---|---|---|
| A1 | 0 | 0.2 | 0.37 | 4.27 | Without KI |
| A2 | 0.02 | 0.2 | 0.10 | 0.33 | KI completely dissolved |
| A3 | 0.03 | 0.2 | 0.09 | 0.31 | KI completely dissolved |
| A4 | 0.04 | 0.2 | 0.49 | 3.72 | A little KI remains |
| Samples | PEO (g) | KI (g) | τg (s) | τd (s) |
|---|---|---|---|---|
| B1 | 0 | 0.03 | 0.12 | 0.30 |
| B2 | 0.1 | 0.03 | 0.08 | 0.16 |
| B3 | 0.2 | 0.03 | 0.06 | 0.26 |
| B4 | 0.3 | 0.03 | 0.07 | 0.33 |
| B5 | 0.4 | 0.03 | 0.07 | 0.55 |
2.3 Device fabrication and characterization
A portion (30 μL) of PMII-based quasi solid-state electrolyte was coated on to the ZnO NRs. A 20 nm thick platinum (Pt) film was then deposited on the FTO coated glass substrate using electron beam evaporation, and this was then used as the counter electrode. A sealant material was used to bind the two electrodes together. The effective area of the photodetector was about 1 cm2, and all the measuring procedures were under the same testing conditions. The morphology and structure of the samples were characterized using field emission scanning electron microscopy (FE-SEM, Hitachi S-4800). The current–voltage (I–V) characteristics were measured using a parameter analyzer (Agilent E5270B) under ambient conditions. The temporal response of the UV detector was measured by illuminating the devices with an ultraviolet A – light emitting diode (UVA-LED). The ultraviolet-visible (UV-vis) absorption spectra were recorded with using a spectrophotometer (Shimadzu UV-3600).3 Results and discussion
Fig. 1(a) shows the image of the as-prepared ZnO seed layer on a glass substrate with a thickness of ∼310 nm. The ZnO seed particles were uniform and dense, which is helpful in obtaining the uniform ZnO NR arrays. The typical top view SEM image of ZnO NRs and the cross-sectional view of ZnO NR arrays are shown in Fig. 1(b) and (c), respectively. The ZnO NRs exhibit vertical orientation and uniform distribution with an average length of ∼2.23 μm and a diameter of ∼60 to 130 nm. It can be seen that gaps are well distributed between the NRs, which facilitate the penetration of the electrolyte. The UV-vis absorbance spectrum of ZnO NR is shown in Fig. 1(d), which clearly shows that it has an intensive absorption below the wavelength of 400 nm. Also, the bandgap of ZnO NR can be determined to be about 3.21 eV from the plot of (αhυ)2 versus hυ (α and hυ are the absorption coefficient and photon energy, respectively), as shown in the inset of Fig. 1(d). | ||
| Fig. 1 (a) SEM image of as-prepared ZnO seed layer on glass substrate, (b) the top view SEM image of ZnO NRs, (c) the cross-sectional view of ZnO NR arrays, (d) UV-vis absorbance spectrum of ZnO NR, and the inset is the corresponding band gap values derived from extrapolating the graph of (αhυ)2 versus (hυ − Eg). | ||
It has been demonstrated that the conduction of PEO is limited by its high crystallinity in the applications of solid-state dye sensitized solar cells.31 Therefore, KI was used to prevent the crystallization of PEO and increase the ion conductivity in the quasi solid-state electrolyte. To further investigate the effect of KI on photoelectric characteristics of the device, the PEO content (0.2 g) was kept constant and the KI content was changed from 0 to 0.04 g (Table 1). From Table 1, it can be seen that KI can be completely dissolved when 0.02 g (A2) or 0.03 g (A3) KI is added into the electrolyte. However, when increasing the KI content up to 0.04 g (A4), there is a little residual KI crystal in the electrolyte.
Fig. 2(a) shows the photocurrent response of a UV detector assembled with ionic liquid electrolytes (A1–A4), which was measured at 0 V bias under an intermittent irradiation of 365 nm UV light. Five repeat cycles of switching the 60 μW cm−2 UV light on (10 s) and off (10 s) were recorded. The photocurrent response at each cycle was repeatable, rapid and had no obvious decay. As shown in Fig. 2(a), the value of the photocurrent increased as the KI content was increased from 0 to 0.03 g, but falls dramatically when the KI content reaches 0.04 g. Clearly, sample A3 has the optimum photocurrent of about ∼0.18 mA, which is much higher than that without KI in the electrolyte ∼2.60 μA. It has been proven that the conductivity of PEO-based electrolytes is governed by the transfer of I− ions. When adding KI into the quasi solid-state electrolyte, the I− content increases at once, which promotes the transfer of the charge carriers in the matrix. Moreover, K+ is prone to coordinate with the oxygen atoms in the PEO chains, and thus speeds up the dissociation of KI, and also decreases the crystallinity of PEO. Furthermore, there is an amorphous matrix when K+ fully coordinates with PEO, which would facilitate the mobility of charge carrier and interfacial contact between ZnO NRs and electrolytes. The factors above contribute to the increase of free charge carrier amount and promote the transfer of charge carrier in the electrolyte, and thus, lead to the increase of photocurrent with the increasing KI content from 0 to 0.03 g. However, further increasing the KI content up to 0.04 g, causes the photocurrent to drop rapidly. There are two main reasons for this. Firstly, the coordination interaction between KI and PEO has already been saturated, and thus the concentration of the charge carrier barely increases with the increase of KI content. Secondly, excessive KI cannot be fully dissolved in the electrolyte, which hinders the transport of I−. Note that a sharp current peak emerges when the UV source turns on in each cycle. This phenomenon has also been observed in previous reports, and the sharp peaks may have originated from the synergy of the photovoltaic effect and the pyroelectric effect under UV illumination.32,33 The rise time and the decay time are listed in Table 1. The response time is a key parameter of the photodetector for practical applications. All the samples have fast rise time (less than 0.5 s), and the samples A2 and A3 also have rapid decay times. Sample A3, in particular, has a fast response time (rise time: 0.09 s, decay time: 0.31 s), which is shorter than the values published previously, and indicates a rapid photo response behavior at 0 V.34,35
 | ||
| Fig. 2 (a) Photocurrent response of the UV detector assembled with ionic liquid electrolytes containing 0.2 g PEO and different KI contents, (b) I–V characteristic curves of the UV detector (sample A3) under dark conditions and illuminated with UV light, and the inset shows the I–V characteristic curves in darkness. The power of the UV light used in all the experiments is 60 μW cm−2 (λ = 365 nm). | ||
Fig. 2(b) shows typical I–V characteristic curves of a UV detector (sample A3) under dark conditions and illumination with UV light, and the inset shows the magnified I–V characteristic curves in darkness. The I–V curves of the device both in darkness and illumination display a typical Schottky barrier behavior, reflecting that the heterojunction structure has been successfully obtained. At 0 V, there is an obvious difference between dark current and photocurrent, suggesting its self-powered mode of operation. More precisely, the photocurrent is 1.4 × 10⁻⁴ A, which is much larger than the dark current of 2.62 × 10⁻⁷ A. High responsivity and sensitivity are two important parameters of the UV photodetector. In this research, the responsivity  and sensitivity
  were 2.33 A W−1 and 533, respectively, which were considerably higher than the corresponding values recently reported by other groups.36,37
As is already known, the solvent in the liquid electrolyte volatilize easily and thus, it is hard to seal it in the photodetector, which hinders its practical use in the UV photodetector. In this research, PEO is used to solidify the liquid electrolyte to obtain the quasi solid-state electrolyte, avoiding the disadvantage with sealing it in the photodetector. In order to further investigate the impact of PEO in the device, the content of PEO was changed from 0 to 0.4 g (B1–B5) while the KI 0.03 g content was kept constant (Table 2). Fig. 3(a) depicts the photocurrent response of the UV detector assembled with electrolytes B1 to B5. The photocurrent response at each cycle was repeatable, rapid and had no obvious decay. The response time is listed in Table 2, and all the samples show a rapid photo response characteristic. The photocurrent increases with the increasing of PEO content at first, and then drops when more PEO is added to the electrolyte. Sample B3 has optimum photocurrent ∼0.42 mA and response time (rise time: 0.06 s, decay time: 0.26 s). In comparison with other photodetectors, the photocurrent of sample B1 is very small. The electrolyte without PEO is liquid, which is apt to leak out. Furthermore, the crystallization of KI is very quick and difficult to control, and the aggregation of the KI particles has an adverse effect on it permeating the ZnO NRs, which damages the interfacial contact between ZnO NRs and the electrolyte. The oxygen atoms in the PEO chains can coordinate with K+, and thus cause the matrix to become amorphous, which would certainly promote the transfer of the charge carrier and the interfacial contact between the ZnO NRs and the electrolyte. Also, Fenton et al. found that the coordination compounds formed by the coordination of PEO and alkali metal ions have ionic conductivity.38 Thus, the photocurrent will improve when adding PEO into the electrolyte. When the PEO content is increased above 0.2 g, the coordination interaction between KI and PEO has already been saturated, and the viscosity rises with the increase of PEO, which leads to the decrease of the photocurrent. Fig. 3(b) shows a typical I–V characteristic curves of a UV detector (sample B3) under dark conditions and with illumination by UV light, and the inset shows the magnified I–V characteristic curves in darkness. Both curves show Schottky barrier behavior. At 0 V, the photocurrent and dark current are 2.34 × 10⁻⁴ A and 5.09 × 10⁻⁷ A, respectively, which demonstrates its self-powered character. Correspondingly, the responsivity and sensitivity are 3.90 A W−1 and 459, respectively, reflecting the efficient detection performance of the device.
 | ||
| Fig. 3 (a) Photocurrent response of UV detector assembled with ionic liquid electrolytes containing 0.03 g KI and different PEO contents, (b) I–V characteristic curves of the UV detector (sample B3) under dark conditions and illuminated with UV light, and the inset shows the I–V characteristic curves in darkness. | ||
The quasi solid-state electrolyte is easier to seal and it is more difficult for the contents to leak out than with the liquid electrolyte. In other words, the quasi solid-state electrolyte is more stable. To illustrate the time stability of the electrolyte, the sample A3 was kept in the air and the photo response of the sample was measured four months later, as shown in Fig. 4. In each cycle, the photo response shows no obvious decay. The rise and decay time are ∼0.09 and ∼0.53 s, respectively. Compared with sample A3 (rise time: 0.09 s, decay time: 0.31 s) measured four months before, there is no distinct difference, suggesting that the device has good stability over time. The peak photo response is ∼16 μA, which was smaller than the value measured four months previously. Part of the solvent had inevitably volatilized, which resulted in the decrease of the charge carrier in the electrolyte.
 | ||
| Fig. 4 Photocurrent response of UV detector (sample A3) after four months. | ||
The potential mechanism of the UV photodetector is shown in Fig. 5. The Ef of ZnO is higher than the redox potential of the electrolyte. When the ZnO NRs contact with the electrolyte in the dark, electrons diffuse from the side of the ZnO NRs to the electrolyte and holes diffuse in the opposite direction. As a result, the depletion region is built, which causes the drift of carriers until a new equilibrium is reached. As a result, a built-in electric field orienting from the ZnO NRs side to the electrolyte is formed. When the UV light illuminates the device, the photons with energy larger than the ZnO band gap excite an electron from the valence band to conduction band, leaving behind a hole. Subsequently, the generated electron–hole pairs are forced to separate by the built-in electric field. However, the holes migrate to the ZnO NRs/electrolyte interface and get captured by the I− in the electrolyte (h+ + I− → I3−). Also, the electrons travel along the ZnO NRs to the FTO, and then transfer to the Pt layer of the counter electrode through the external circuit. The I3− is reduced to I− at the counter electrode by the electrons (I3− + e− → I−). Here the Pt serves as both a catalyst for the redox reaction and as a conduction road for the electrons. In this process, the circuit can keep running without any external bias under the premise that there is suitable UV light. Also, the device can work smoothly without I2, avoiding the corrosiveness and sublimation of I2. Furthermore, the intimate interactions between K+ or PMI+ and the oxygen atoms of the PEO units cause more free mobile I− ions, which promote the redox reaction, and thus accelerate the transportation of the carriers.
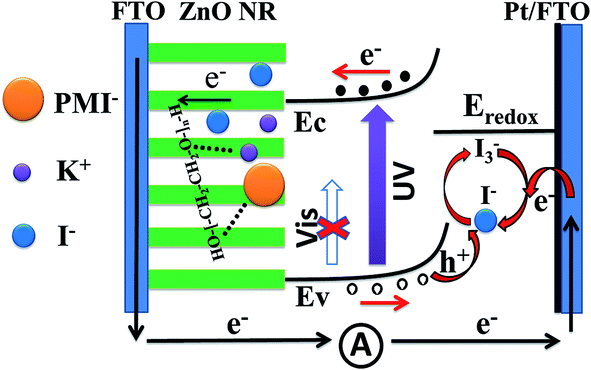 | ||
| Fig. 5 Energetics of the operation of the UV photodetector. | ||
4 Conclusion
In summary, a photoelectrochemical cell was successfully fabricated in the form of a self-powered UV photodetector with ZnO NRs as the active photoanode which were prepared using a simple hydrothermal method and assembled with a novel iodine-free quasi solid-state electrolyte. The dependence of the photocurrent on the amounts of KI and PEO used were investigated in detail. The optimum photocurrent was 4 × 10⁻⁴ A for the sample containing 0.03 g KI and 0.2 g PEO, and the corresponding high responsivity was 2.33 A W−1 which was one to two orders of magnitude higher than a similar type of device. The rise and decay times were 0.09 s and 0.31 s, respectively, which was shorter than those in recently reported data. Adding KI to the electrolyte can not only help to import more iodide ions but can also prevent the crystallization of PEO to form an amorphous matrix. Addition of the PEO to the electrolyte solidified the liquid electrolyte avoiding leakage and evaporation of the solvent. All the factors mentioned previously result in the increase of the photocurrent. The response time of the device has no evident decay, which shows great stability of the UV photodetector at room temperature. This study provides opportunities to further investigate the high performance self-powered UV photodetector assembled with iodine-free quasi solid-state electrolytes.Acknowledgements
This work was supported by the National Natural Science Foundation of China under Grant No. 51302244 and 91333203, and the Zhejiang Provincial Natural Science Foundation of China under Grant No. LY17E020005.References
- T. Y. Zhai, X. S. Fang, M. Y. Liao, X. J. Xu, H. B. Zeng, B. D. Yoshio and D. Golberg, Sensors, 2009, 9, 6504–6529 CrossRef CAS PubMed.
- L. Peng, L. F. Hu and X. S. Fang, Adv. Mater., 2013, 25, 5321–5328 CrossRef CAS PubMed.
- K. Liu, M. Sakurai and M. Aono, Sensors, 2010, 10, 8604–8634 CrossRef CAS PubMed.
- S. M. Hatch, J. Briscoe and S. Dunn, Adv. Mater., 2013, 25, 867–871 CrossRef CAS PubMed.
- P. Lin, X. Chen, X. Q. Yan, Z. Zhang, H. Yuan, P. F. Li, Y. G. Zhao and Y. Zhang, Nano Res., 2014, 7, 860–868 CrossRef CAS.
- Y. W. Shen, X. Q. Yan, H. N. Si, P. Lin, Y. C. Liu, Y. H. Sun and Y. Zhang, ACS Appl. Mater. Interfaces, 2016, 8, 6137–6143 CAS.
- Z. Zhang, Q. L. Liao, Y. H. Yu, X. D. Wang and Y. Zhang, Nano Energy, 2014, 9, 237–244 CrossRef CAS.
- Z. Gao, W. Jin, Y. Zhou, Y. Dai, B. Yu, C. Liu, W. Xu, Y. Li, H. Peng, Z. Liu and L. Dai, Nanoscale, 2013, 5, 5576–5581 RSC.
- X. D. Li, C. T. Gao, H. G. Duan, B. G. Lu, X. J. Pan and E. Q. Xie, Nano Energy, 2012, 1, 640–645 CrossRef CAS.
- O. Game, U. Singh, T. Kumari, A. Banpurkar and S. Ogale, Nanoscale, 2014, 6, 503–513 RSC.
- X. D. Li, C. T. Gao, H. G. Duan, B. G. Lu, Y. Q. Wang, L. L. Chen, Z. X. Zhang, X. J. Pan and E. Q. Xie, Small, 2013, 9, 2005–2011 CrossRef CAS PubMed.
- X. D. Li, C. T. Gao, H. G. Duan, B. G. Lu, X. J. Pan and E. Q. Xie, Nano Energy, 2012, 1, 640–645 CrossRef CAS.
- Y. Lin, C. Li, C. Lee, Y. Leu, Y. Ezhumalai, R. Vittal, M. Chen, J. Lin and K. Ho, ACS Appl. Mater. Interfaces, 2016, 8, 15267–15278 CAS.
- W. Cho, Y. R. Kim, D. Song, H. W. Choi and Y. S. Kang, J. Mater. Chem. A, 2014, 2, 17746–17750 CAS.
- C. Lee, L. Lin, P. Chen, R. Vittal and K. Ho, J. Mater. Chem., 2010, 20, 3619 RSC.
- S. Zhang, J. Sun, X. Zhang, J. Xin, Q. Miao and J. Wang, Chem. Soc. Rev., 2014, 43, 7838–7869 RSC.
- H. X. Wang, H. Li, B. F. Xue, Z. X. Wang, Q. B. Meng and L. Q. Chen, J. Am. Chem. Soc., 2005, 127, 6394–6401 CrossRef CAS PubMed.
- U. Özgür, Y. I. Alivov, C. Liu, A. Teke, M. A. Reshchikov, S. Doğan, V. Avrutin, S. J. Cho and H. Morkoç, J. Appl. Phys., 2005, 98, 41301 CrossRef.
- C. C. Hsiao and S. Y. Yu, Sensors, 2012, 12, 17007–17022 CrossRef CAS PubMed.
- A. B. Djurišić and Y. H. Leung, Small, 2006, 2, 944–961 CrossRef PubMed.
- P. X. Gao, Y. Ding and Z. L. Wang, Nano Lett., 2003, 3, 1315–1320 CrossRef CAS.
- X. D. Wang, C. J. Summers and Z. L. Wang, Nano Lett., 2004, 4, 423–426 CrossRef CAS PubMed.
- X. Y. Zhang, J. Y. Dai, H. C. Ong, N. Wang, H. L. W. Chan and C. L. Choy, Chem. Phys. Lett., 2004, 393, 17–21 CrossRef CAS.
- C. S. Lao, P. X. Gao, R. S. Yang, Y. Zhang, Y. Dai and Z. L. Wang, Chem. Phys. Lett., 2006, 417, 358–362 CrossRef CAS.
- P. X. Gao and Z. L. Wang, Small, 2005, 1, 945–949 CrossRef CAS PubMed.
- H. Endo, M. Sugibuchi, K. Takahashi, S. Goto, S. Sugimura, K. Hane and Y. Kashiwaba, Appl. Phys. Lett., 2007, 90, 121906 CrossRef.
- N. N. Jandow, F. K. Yam, S. M. Thahab, H. A. Hassan and K. Ibrahim, Curr. Appl. Phys., 2010, 10, 1452–1455 CrossRef.
- K. Wang, Y. Vygranenko and A. Nathan, Thin Solid Films, 2008, 516, 1640–1643 CrossRef CAS.
- W. Dai, X. H. Pan, C. Chen, S. S. Chen, W. Chen, H. H. Zhang and Z. Z. Ye, RSC Adv., 2014, 4, 31969 RSC.
- Y. Y. Zeng, X. H. Pan, W. Dai, Y. C. Chen and Z. Z. Ye, RSC Adv., 2015, 5, 66738–66741 RSC.
- J. H. Kim, M. S. Kang, Y. J. Kim, J. Won, N. G. Park and Y. S. Kang, Chem. Commun., 2004, 14, 1662–1663 RSC.
- Z. N. Wang, R. Yu, C. Pan, Z. Li, J. Yang, F. Yi and Z. L. Wang, Nat. Commun., 2015, 6, 8401 CrossRef CAS PubMed.
- Y. Shen, X. Yan, H. Si, P. Lin, Y. Liu, Y. Sun and Y. Zhang, ACS Appl. Mater. Interfaces, 2016, 8, 6137–6143 CAS.
- W. J. Lee and M. H. Hon, Appl. Phys. Lett., 2011, 99, 251102 CrossRef.
- Y. G. Han, G. Wu, H. G. Li, M. Wang and H. Z. Chen, Nanotechnology, 2010, 21, 185708 CrossRef PubMed.
- Q. Li, L. Wei, Y. Xie, K. Zhang, L. Liu, D. Zhu, J. Jiao, Y. Chen, S. Yan, G. Liu and L. Mei, Nanoscale Res. Lett., 2013, 8, 415 CrossRef PubMed.
- Y. Y. Zeng, X. Pan, W. Dai, Y. C. Chen and Z. Z. Ye, RSC Adv., 2015, 5, 66738–66741 RSC.
- D. E. Fenton, J. M. Parker and P. V. Wright, Polymer, 1973, 14, 589–592 CrossRef CAS.
| This journal is © The Royal Society of Chemistry 2017 |