 Open Access Article
Creative Commons Attribution 3.0 Unported Licence
Amphotericin B-loaded mannose modified poly(D,L-lactide-co-glycolide) polymeric nanoparticles for the treatment of visceral leishmaniasis: in vitro and in vivo approaches
Santanu Ghosh ,
Suman Das,
Asit Kumar De,
Nabanita Kar and
Tanmoy Bera*
Laboratory of Nanomedicine, Division of Pharmaceutical Biotechnology, Department of Pharmaceutical Technology, Jadavpur University, 188 Raja S.C. Mallick Road, Kolkata-700 032, West Bengal, India. E-mail: proftanmoybera@gmail.com; Tel: +91 9831470041
First published on 7th June 2017
Abstract
It is evident from many previous research works that the mannose receptors on the surface of macrophages play an important role in the process of phagocytosis and they are over-expressed in some intracellular parasitic diseases like leishmaniasis. Toxicity and drug resistance were the major drawbacks in the treatment of visceral leishmaniasis in the past. To overcome these setbacks we have developed amphotericin B-loaded mannose modified PLGA nanoparticles. O-Stearoyl mannose was synthesized and used to prepare mannose modified PLGA nanoparticles. FTIR and DSC analyses were carried out to determine the drug–excipient compatibility and particle size, and SEM and TEM studies were carried out to determine the physicochemical characteristics of the formulated nanoparticles. An in vitro cumulative drug release study for the formulated nanoparticles was carried out, showing the release of amphotericin B in a controlled manner for a prolonged period of time. From the ex vivo cellular uptake study it was observed that the rate of intracellular internalization was significantly higher for the mannose-modified nanoparticles than for the unmodified ones. Selectivity indexes were calculated to determine the antileishmanial efficiency in the in vitro cellular amastigote model, and were almost 4 fold higher for the mannose modified formulation than for the free amphotericin B. A mice model was used for an in vivo study, showing a 98.19% ± 0.33% suppression of the amastigote burden in the spleen. So, it could be concluded that amphotericin B-loaded mannose modified PLGA nanoparticles are more efficacious in the treatment of visceral leishmaniasis in both in vitro and in vivo models than unmodified nanoformulations.
1. Introduction
Leishmaniasis, a disease associated with poverty,1 is known to be a vector borne disease. The female phlebotomine sandfly is the vector, which transmits the promastigote phase of the obligate parasite to the biological systems of humans, resulting in one of the three existing forms of leishmaniasis: cutaneous, mucocutaneous or visceral. Among them visceral leishmaniasis (VL) is the most fatal condition of the pathogenesis, with some characteristic symptoms known to be irregular fever, weight loss, hepatomegaly, splenomegaly and anaemia. The endemicity of the disease, especially VL, in countries like India, Bangladesh, Ethiopia, Sudan, Brazil, etc. proves that poverty is strongly associated with the advancement of the disease. However, nowadays it is not restricted to those endemic countries but has extended its claws to non-endemic European countries as well. International travelling, migration from the affected countries and HIV co-infections have triggered this.2–4For the development of new drug substances or therapeutic strategies against leishmaniasis, it is important to know the life cycle of the obligate parasite in humans. Following the bite of an infected female sandfly, flagellated promastigotes are transmitted into the biological fluid of humans. Macrophages are recruited at the site of infection and phagosomal vacuoles are formed during the process of phagocytosis. This is followed by the association of the lysosomes situated inside the macrophages, and phagolysosomal vacuoles are developed. Inside the phagolysosomal vacuoles it is a very hostile environment for any pathogens to merely survive, however, leishmania is among a few that can survive as well as multiply in this antagonistic environment. Therefore, macrophages act as a safe house for the promastigotes where they transform into amastigotes and multiply. When the amastigote burden increases inside the macrophages, it bursts and releases the amastigotes to infect other macrophages. Although macrophages are known to be the most important component of the process of phagocytosis, neutrophils also play an important role. Infection initiated by the bite of a sand fly influences the neutrophils to be recruited to the site of infection.5,6 According to Laufs et al.7 and van Zandbergen et al.,8 as the life period of the neutrophils is very short, they just perform as ‘Trojan horses’, which means the parasites use the neutrophils for avoiding the cell activation phenomenon to enter into the macrophages. During the interaction with the parasite, receptors such as mannose receptors, CR1 and CR3 complement receptors and fibronectin receptors on the surface of macrophages play an important role.9 Among the other receptors, many scientists have revealed the importance of mannose receptors for macrophage-targeted drug delivery.10–12
Although in the last few decades many remarkable research works regarding the development of a newer delivery system have been carried out, intra-macrophage drug delivery is still very challenging. Parameters like the size and shape of the polymeric nanoparticles always play a key role in the processes of biodistribution, cellular uptake and target specificity of drugs used for their intended purpose. Nanodisks, nanorods, plateloids, ellipsoids, nanoneedles, and filamentous or worm-like micelles are different shapes of nanoformulations currently in the limelight.13 In a recent review article, Truong et al. demonstrated the advantages of filomicelles over the conventional spherical polymeric nanoparticle in the field of anticancer drug delivery.13,14 According to Bera et al., in the case of macrophage-associated drug delivery, spherical particles in the size range of around 200 nm could effectively be phagocytosed by the macrophages.15 However, as present drug delivery systems are not selective for intracellular drug delivery, the chemotherapeutics result in unwanted toxicities at their dosing regimen. Therefore, a significant effort is necessary to develop a delivery system which can increase the efficiency of the chemotherapeutics as well as decrease their undesirable toxicities.
VL infections result in over-expressed mannose receptors (MMRs; CD206) and other receptors such as scavenger receptors and stearylamine receptors,16,17 which can bind to pathogen-associated molecular patterns (PAMPs). Among the mannose receptors, MMR is a transmembrane glycoprotein composed of a type-II fibronectin domain, an N-terminal cysteine-rich domain and eight lectin-like C-type carbohydrate recognition domains.18 A wide variety of infectious pathogens contain mannose, fucose and N-acetylglucosamine as PAMPs on their cell surface, which can bind with the extracellular carbohydrate recognition domains of the macrophages.19 Thus, over-expressed mannose receptors, especially MMRs, could be targeted by developing a mannose associated drug delivery system where mannose acts as the PAMP. In addition, this mannose associated drug delivery to the macrophages could generally occur by receptor-mediated endocytosis, using the mannose receptor in the case of VL.20
Many research works have been carried out where polyethylene glycol was used as a spacer between the ligand, mannose and the drug encapsulated polymer for this kind of drug delivery system, but it is expected that the flexible long chains of polyethylene glycol could shield the mannose, making them unable to interact with the mannose receptor.21 Therefore we attached a stearoyl moiety to the mannose to synthesize O-stearoyl mannose, which might circumvent this problem.
At the present time, the treatment of endemic VL is restricted to a few chemotherapeutic agents like paromomycin, miltefosine, amphotericin B, etc. Toxicity is a major concern for all of them, however drug resistance makes it more complicated. Nephrotoxicity and ototoxicity are associated with paromomycin therapy, and teratogenicity is the major problem for orally active miltefosine.22 Slow intravenous administration of amphotericin B is needed to overcome its toxicity. However, amphotericin B is still the gold standard for the treatment of VL.
So, in this experimental work we have prepared amphotericin B-loaded O-stearoyl mannose-associated poly(D,L-lactide-co-glycolide) nanoparticles, which may have a significantly increased rate of uptake by the macrophages, could provide controlled release of amphotericin B for an extended period of time and could efficiently treat VL by decreasing the parasite burden significantly inside the spleen.
2. Materials and methods
2.1. Materials
Poly(D,L-lactide-co-glycolide) [PLGA acid terminated RG 502 H, Mw 7000–17![[thin space (1/6-em)]](https://www.rsc.org/images/entities/char_2009.gif) 000], amphotericin B (AmB), paromomycin (PMM), medium 199, fetal bovine serum and RPMI 1640 were purchased from Sigma-Aldrich, India. Fluorescein isothiocyanate 98% (FITC), was procured from Himedia Laboratories. Polyvinyl alcohol (PVA, Mw approx. 125
000], amphotericin B (AmB), paromomycin (PMM), medium 199, fetal bovine serum and RPMI 1640 were purchased from Sigma-Aldrich, India. Fluorescein isothiocyanate 98% (FITC), was procured from Himedia Laboratories. Polyvinyl alcohol (PVA, Mw approx. 125![[thin space (1/6-em)]](https://www.rsc.org/images/entities/char_2009.gif) 000) was purchased from SDFCL, India. Tween 80 was purchased from Merck, India. Sodium stibogluconate (SSG) was a gift from Albert David Ltd. (Kolkata, India). Dichloromethane (DCM) and dimethyl sulfoxide (DMSO) were procured from Merck, India. All other chemicals used were of analytical grade.
000) was purchased from SDFCL, India. Tween 80 was purchased from Merck, India. Sodium stibogluconate (SSG) was a gift from Albert David Ltd. (Kolkata, India). Dichloromethane (DCM) and dimethyl sulfoxide (DMSO) were procured from Merck, India. All other chemicals used were of analytical grade.
2.2. Ethics statement for animal experiments
To carry out the animal experiments in this work, BALB/c mice (weighing 20–25 g) of either sex were used. All of the animal experiments were performed in compliance with the relevant laws of the Committee for the Purpose of Control and Supervision of Experiments on Animals (CPCSEA), Govt. of India, India and the University Grants Commission (UGC), New Delhi, India. The Animal Ethics Committee Jadavpur University (AEC/PHARM/1403/2014) approved the experimental protocols. The procedures were followed in accordance with the committee’s guidelines. Polypropylene cages were used to house the animals and they were fed a standard diet and water ad libitum. The mice were exposed to a normal day and night cycle.2.3. Synthesis of O-stearoyl mannose (OSM)
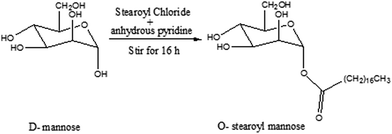
O-Stearoyl mannose was synthesized by Zhu et al.21 with few modifications (Fig. 1). 3.33 mmol D-mannose was dissolved in 15 ml of anhydrous dichloromethane (DCM) in a flat bottomed flask. To the resultant solution, 2.1 ml of anhydrous pyridine and 1.5 ml of anhydrous DCM containing 0.545 mmol stearoyl chloride was subsequently added and this was stirred for 16 h. The reaction mixture was then dispersed into 10 ml of brine solution in a separating funnel. After separation the DCM layer was collected and anhydrous disodium sulfate was added to it and kept overnight in a closed system. After that the DCM solution was filtered out and evaporated in a water bath, and characterization of the synthesized product was carried out by Fourier transform infrared spectroscopy (FTIR) and 1H nuclear magnetic resonance (1H NMR) study.2.4. Preparation of nanoparticles
According to Table 1, three different types (different drug![[thin space (1/6-em)]](https://www.rsc.org/images/entities/char_2009.gif) :
:![[thin space (1/6-em)]](https://www.rsc.org/images/entities/char_2009.gif) polymer ratio) of AmB-loaded PLGA nanoparticles were prepared by a double emulsion-solvent evaporation method.23 Briefly, weighed amounts of PLGA and AmB (Table 1) were dissolved in 2 ml of DCM. 0.5 ml of 2.5% aqueous PVA solution was added drop-wise into it during homogenization by a high speed homogenizer (Homogenizer-IKa T10 basic ultra turrax) at an optimized speed of 22
polymer ratio) of AmB-loaded PLGA nanoparticles were prepared by a double emulsion-solvent evaporation method.23 Briefly, weighed amounts of PLGA and AmB (Table 1) were dissolved in 2 ml of DCM. 0.5 ml of 2.5% aqueous PVA solution was added drop-wise into it during homogenization by a high speed homogenizer (Homogenizer-IKa T10 basic ultra turrax) at an optimized speed of 22![[thin space (1/6-em)]](https://www.rsc.org/images/entities/char_2009.gif) 000 rpm, forming a w/o type emulsion. Then this primary emulsion was added gradually to 75 ml of 1.5% w/v aqueous PVA solution with continuous homogenization (Homogenizer-IKa T10 basic ultra turrax) at 22
000 rpm, forming a w/o type emulsion. Then this primary emulsion was added gradually to 75 ml of 1.5% w/v aqueous PVA solution with continuous homogenization (Homogenizer-IKa T10 basic ultra turrax) at 22![[thin space (1/6-em)]](https://www.rsc.org/images/entities/char_2009.gif) 000 rpm for 5 min to produce a w/o/w type emulsion. The formed secondary emulsion was stirred on a magnetic stirrer (2MLH, Remi) overnight to remove the DCM.
000 rpm for 5 min to produce a w/o/w type emulsion. The formed secondary emulsion was stirred on a magnetic stirrer (2MLH, Remi) overnight to remove the DCM.
| Formulations | AmB![[thin space (1/6-em)]](https://www.rsc.org/images/entities/char_2009.gif) : :![[thin space (1/6-em)]](https://www.rsc.org/images/entities/char_2009.gif) PLGA PLGA![[thin space (1/6-em)]](https://www.rsc.org/images/entities/char_2009.gif) : :![[thin space (1/6-em)]](https://www.rsc.org/images/entities/char_2009.gif) OSM OSM |
% yield (mean ± SD, n = 3) | % loading (mean ± SD, n = 3) | Avg. particle size (nm) (mean ± SD, n = 3) | Zeta potential (mV) (mean ± SD, n = 3) | PDI |
|---|---|---|---|---|---|---|
| AN1 | 1![[thin space (1/6-em)]](https://www.rsc.org/images/entities/char_2009.gif) : :![[thin space (1/6-em)]](https://www.rsc.org/images/entities/char_2009.gif) 10 10![[thin space (1/6-em)]](https://www.rsc.org/images/entities/char_2009.gif) : :![[thin space (1/6-em)]](https://www.rsc.org/images/entities/char_2009.gif) 0 0 |
70.9 ± 3.6 | 6.7 ± 0.5 | 182.8 ± 4.2 | −11.8 ± 2.1 | 0.355 |
| AN2 | 1![[thin space (1/6-em)]](https://www.rsc.org/images/entities/char_2009.gif) : :![[thin space (1/6-em)]](https://www.rsc.org/images/entities/char_2009.gif) 5 5![[thin space (1/6-em)]](https://www.rsc.org/images/entities/char_2009.gif) : :![[thin space (1/6-em)]](https://www.rsc.org/images/entities/char_2009.gif) 0 0 |
56.4 ± 2.7 | 9.0 ± 0.5 | 261.2 ± 5.7 | −12.3 ± 1.8 | 0.510 |
| AN3 | 3![[thin space (1/6-em)]](https://www.rsc.org/images/entities/char_2009.gif) : :![[thin space (1/6-em)]](https://www.rsc.org/images/entities/char_2009.gif) 10 10![[thin space (1/6-em)]](https://www.rsc.org/images/entities/char_2009.gif) : :![[thin space (1/6-em)]](https://www.rsc.org/images/entities/char_2009.gif) 0 0 |
60.8 ± 4.1 | 11.5 ± 0.7 | 280.9 ± 3.6 | −14.7 ± 2.7 | 0.686 |
| ASMN | 1![[thin space (1/6-em)]](https://www.rsc.org/images/entities/char_2009.gif) : :![[thin space (1/6-em)]](https://www.rsc.org/images/entities/char_2009.gif) 5 5![[thin space (1/6-em)]](https://www.rsc.org/images/entities/char_2009.gif) : :![[thin space (1/6-em)]](https://www.rsc.org/images/entities/char_2009.gif) 1.5 1.5 |
64.7 ± 3.4 | 10.2 ± 0.8 | 340.5 ± 6.2 | −24.9 ± 1.6 | 0.438 |
Nanoparticles were collected by a cold centrifuge (Sigma 3K30, Germany) at high speed. First larger particles were removed by centrifugation at 5000 rpm for 5 min. The supernatant was collected and recentrifuged at 16![[thin space (1/6-em)]](https://www.rsc.org/images/entities/char_2009.gif) 000 rpm for 40 min. The separated solid nanoparticles were washed thrice with Milli-Q water (Millipore Corp., Billerica, MA, USA) to remove the excess PVA and the unloaded free AmB and were kept at −80 °C in a freezer.
000 rpm for 40 min. The separated solid nanoparticles were washed thrice with Milli-Q water (Millipore Corp., Billerica, MA, USA) to remove the excess PVA and the unloaded free AmB and were kept at −80 °C in a freezer.
Then the nanoparticles were lyophilized for 7–8 h (Lyophilizer: Instrumentation India, Kolkata, India) followed by storage at 4 °C for further use.
During the preparation of AmB-loaded PLGA–OSM nanoparticles (ASMN), a weighed amount of OSM (Table 1) was dissolved in DCM along with PLGA and AmB.24 Blank nanoparticles were prepared using the same technique except the drugs were not added and in the case of FITC-loaded PLGA–PVA nanoparticles preparation, FITC was used instead of AmB using a similar method of nanoparticle preparation.
2.5. Characterization of nanoparticles
![[thin space (1/6-em)]](https://www.rsc.org/images/entities/char_2009.gif) :
:![[thin space (1/6-em)]](https://www.rsc.org/images/entities/char_2009.gif) 100 before analysis. FTIR was done by FTIR, Model: Nicolet iS10, Thermo Fisher Scientific, USA.
100 before analysis. FTIR was done by FTIR, Model: Nicolet iS10, Thermo Fisher Scientific, USA.![[thin space (1/6-em)]](https://www.rsc.org/images/entities/char_2009.gif) :
:![[thin space (1/6-em)]](https://www.rsc.org/images/entities/char_2009.gif) acetonitrile (55
acetonitrile (55![[thin space (1/6-em)]](https://www.rsc.org/images/entities/char_2009.gif) :
:![[thin space (1/6-em)]](https://www.rsc.org/images/entities/char_2009.gif) 45) was used as the mobile phase and the flow rate was 1.0 ml min−1. The area of AmB was measured at the λmax of 407 nm. The percentage of drug loading and the entrapment efficiency were calculated using the following equations:
45) was used as the mobile phase and the flow rate was 1.0 ml min−1. The area of AmB was measured at the λmax of 407 nm. The percentage of drug loading and the entrapment efficiency were calculated using the following equations:| Theoretical drug loading (%) = amount of drug taken to prepare the nanoparticles × 100%/amount of PLGA + amount of drug |
| Actual drug loading (%) = amount of drug present in the obtained nanoparticles × 100%/amount of obtained nanoparticles |
| Drug entrapment efficiency (%) = actual drug loading × 100%/theoretical drug loading |
2.6. Isolation of mice peritoneal macrophages and a trypan blue exclusion assay of macrophage viability
BALB/c mice (20–25 g) were injected with 1.5 ml of sterile thioglycolate medium intraperitoneally to induce non-infectious inflammation. These mice were sacrificed by cervical dislocation after 5 days and peritoneal exudates were harvested by intra-peritoneal lavage. 5 ml of ice-cold RPMI-1640 medium was injected into the peritoneal cavity of the sacrificed mice. The abdominal area was massaged gently for 4–5 min, followed by the withdrawal of the injected fluid by the same syringe. The cell-containing medium was then centrifuged at 4500 rpm for 15 min to collect the cells. Excluding the contaminated erythrocytes, the total number of isolated cells was counted with a hemocytometer. Non-specific esterase staining26 confirmed that approximately 60–80% of the isolated cells were macrophages.A trypan blue exclusion assay was carried out to determine the isolated macrophages’ viability. Briefly, 0.2 ml of isolated cells were aseptically transferred into a 1.5 ml Eppendorf tube and incubated for 3 min at room temperature with an equal volume of 0.4% (w/v) trypan blue solution prepared in 0.81% sodium chloride and 0.06% (w/v) dibasic potassium phosphate. A hemocytometer was used to take the cell count under a light microscope. Viable and non-viable cells were counted separately and the mean counts for three independent cell counts were pooled for analysis. Macrophage cells showed 93% viability. It was observed that when the macrophage cells were incubated at 45 °C for 10 min, a viability of only 12% was noticed.
2.7. Macrophage uptake study
Ex vivo cellular uptake of FITC-loaded nanoparticles (FITC-loaded PLGA nanoparticles and FITC-loaded PLGA–OSM nanoparticles) was carried out. Macrophages (200 μl) were seeded into each culture well containing 800 μl of RPMI-1640 medium in such a manner that each of the wells contained 4 × 10⁵ macrophages. Sterile glass cover slips were placed into each well and macrophages were allowed to adhere onto it in a 5% CO2 incubator at 37 °C for 72 h. FITC-loaded nanoparticles of both types were suspended separately in sterile water for injection, and 50 μl of those were added to respective wells and allowed to incubate for 10 min under the previous conditions. After that the medium was removed and the cover slips were washed twice with PBS 7.4. The cover slips were removed and placed on glass slides, followed by fixation. They were then observed under a confocal microscope (Olympus Fluoview FV1000, Model: IX81, Singapore) at 60× magnification and photographs were taken using FV10, version 4.1 software.2.8. Parasite culture
Leishmania donovani AG83 (MHOM/IN/83/AG83), a VL isolate, was gifted by the Indian Institute of Chemical Biology, Council of Scientific and Industrial Research, Kolkata, India. Briefly, L. donovani AG83 promastigotes were cultured in 2 mM L-glutamine, 20 mM HEPES, 100 μg ml−1 streptomycin, 100 U ml−1 penicillin and 10% heat inactivated fetal bovine serum supplemented medium 199 at 25 °C. From L. donovani promastigotes the axenic amastigotes were derived by culturing them in MMA/20 (medium for axenic amastigote) at pH 5.5. Sub-passages were done every five days to maintain the culture of the axenic amastigotes and they were kept at 37 °C in a 5% CO2 incubator.272.9. Development of drug resistant amastigote strains
The technique to develop a drug resistant L. donovani strain has already been established.15 Briefly, the AG83 wild-type promastigote cells were cultured in medium 199 with supplements in the presence of a drug concentration corresponding to their IC50 value against the particular strain. The drug concentrations were increased after three subcultures. The drugs concentrations were increased in such a way that the total cell population decreased by around 20% for each of the batches. When 10% of the initial count of a cell population survived, those particular strains were cultured on medium 199 agar plates in the presence of the same drug concentration. A single colony was selected for further culturing in liquid medium 199.28,29 The drug pressure was aloof and the stability was checked at the first, second and fourth months.2.10. In vitro growth inhibition study
An in vitro growth inhibition study against axenic amastigotes of different strains (AG83 wild type, SSG-R, PMM-R and GE1) was carried out by a cell count technique using a hemocytometer. The 50% inhibitory concentration (IC50) of selected drugs was determined by seeding 1 × 10⁵ amastigotes per well in a 96 culture well plate. Drugs were added at their predetermined concentrations. The counts of amastigotes in the drug treated wells were compared with the untreated control. It was presumed that the count of cells in the untreated control represented 100% growth. The cell counts were taken using the hemocytometer under a light microscope after 72 h of incubation in a 5% CO2 incubator at 37 °C. The IC50 values were calculated using the following equation:30| % of inhibition = (count of control − count of treated/count of control) × 100% |
2.11. Drug susceptibility assay of intracellular amastigotes
RPMI-1640 medium (500 μl) containing macrophage cells (4 × 10⁵ cells per ml) was added to each well and incubated in a 5% CO2 incubator at 37 °C for 2 h. After 2 h, 500 μl of warm RPMI-1640 medium supplemented with 20 mM L-glutamine, 16 mM NaHCO3, penicillin (50 U ml−1) and streptomycin (50 mg ml−1), and 10% FCS were added to replace the old media. 0.5 ml of medium (4 × 10⁶ amastigotes per ml) was further added into it. Then the culture plate was kept at 37 °C in the 5% CO2 incubator for 4 h for internalization of the amastigotes into the macrophages. After the period for internalization, fresh RPMI-1640 medium, with or without drug or drug encapsulated nanoparticles at the appropriate concentrations, was added in triplicate wells replacing the old media and kept in the 5% CO2 incubator for 72 h at 37 °C. After that the medium was removed carefully to recover the cover slips. Then the cover slips were fixed, air dried and stained with Giemsa. Under the microscope, the amastigotes in 100 macrophage cells were counted for each cover slip. Three independent experiments in triplicate were carried out. The results were calculated by calculating the ratio between the infection proportions of untreated and treated macrophage cultures.2.12. Assay for toxicity assessment
2.13. Determination of in vivo antileishmanial activity
To develop chronic experimental VL in a mice model, BALB/c mice (20–25 g) of either sex were injected with 200 μl of sterile PBS containing 2 × 10⁷ L. donovani amastigotes of AG83 wild-type strains through the tail vein. The potency of the infection 30 days post infection was confirmed by spleen biopsies of randomly selected mice from each group. After that the treatment was initiated by intraperitoneal injections of 200 μl of AmB and AmB-loaded nanoformulations at the dose regimen of 1 mg per kg per day, for 5 consecutive days. One group of mice was kept as an infected control. On day 7 of the last dose, spleen impression smears were obtained and stained with Giemsa to count the number of amastigotes per 500 spleen cells. The parasite burden was determined by measuring the LDU (Leishman–Donovan Unit), which could be calculated by multiplying the number of counted amastigotes per 500 nuclei with the spleen weight in mg.32 The percentage of parasite suppression was calculated by the following formula:| % parasite suppression = (CC − CT/CC) × 100%, |
2.14. Statistical analysis
Experimental data were expressed as mean ± standard deviation. To determine the statistical significance, one way analysis of variance was used. When P < 0.01 it was considered as significant whereas when P > 0.05 then it was considered to be statistically insignificant3. Results
3.1. Spectral characterization of synthesized O-stearoyl mannose
When the FTIR spectra of D-mannose and O-stearoyl mannose were compared (Fig. 2A) it was observed that in the case of D-mannose the intermolecular broad O–H stretching was observed at 3200–3400 cm−1, but was almost absent in the case of OSM. The peaks in the region of 1260–1350 cm−1 denoted the O–H deformation spectra which were unchanged for both of them, whereas the shape of the O–H deformation spectra at 1000–1100 cm−1 were completely changed for OSM. It was also observed that the![[double bond splayed left]](https://www.rsc.org/images/entities/char_e009.gif) CH2 symmetric stretching at 2843–2863 cm−1 was almost the same for both but merely increased in intensity for OSM. For both of them sharp, asymmetric
CH2 symmetric stretching at 2843–2863 cm−1 was almost the same for both but merely increased in intensity for OSM. For both of them sharp, asymmetric ![[double bond splayed left]](https://www.rsc.org/images/entities/char_e009.gif) CH2 stretching was found at 2916–2936 cm−1.
CH2 stretching was found at 2916–2936 cm−1.
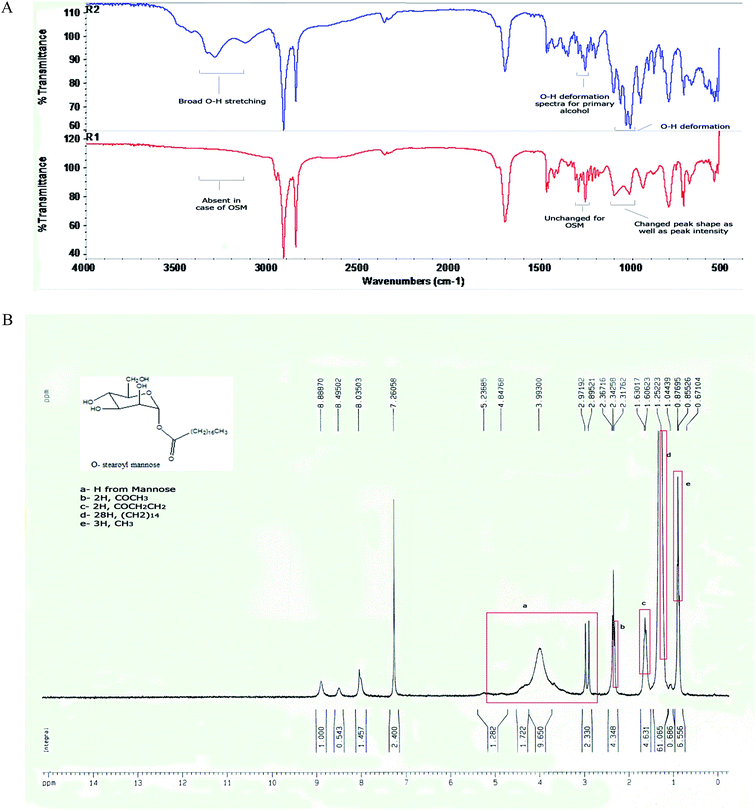 | ||
| Fig. 2 (A) FTIR spectra of (R2) D-mannose and (R1) O-stearoyl mannose. (B) The 1H NMR spectra of O-stearoyl mannose. | ||
Fig. 2B depicted the following result:
1H NMR (300 MHz, CDCl3): 5.23685–2.97192 ppm (H from mannose), 2.31762 ppm (t, 2H, COCH3), 1.60623 ppm (m, 2H, COCH2CH2), 1.25223 ppm (m, 28H, (CH2)14), 0.87695 ppm (t, 3H, CH3).
3.2. FTIR study
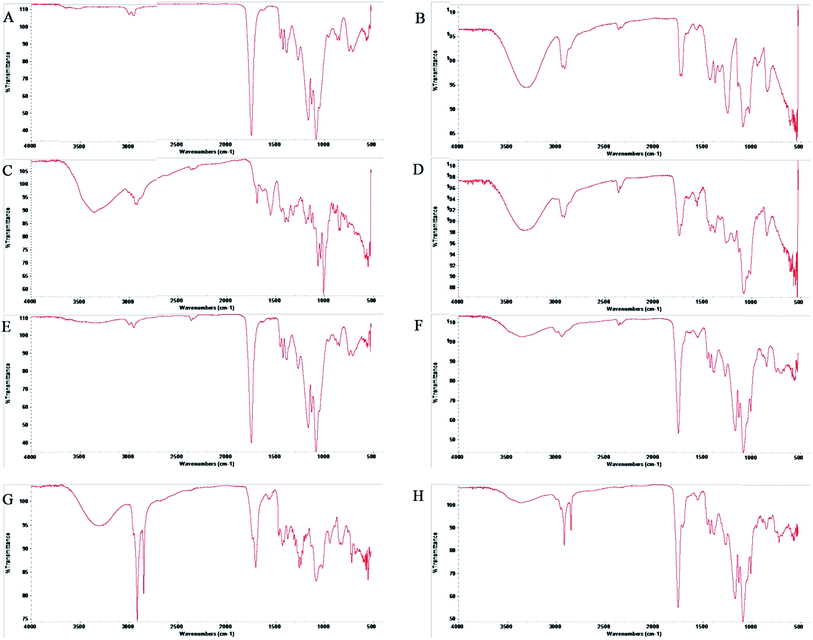
The drug–excipient interactions, if any, could be efficiently determined by FTIR spectroscopic analysis. In Fig. 3C, the FTIR spectra for AmB showed asymmetric stretching at 2936–2916 cm−1 for long alkane chains. Non-conjugated C![[double bond, length as m-dash]](https://www.rsc.org/images/entities/char_e001.gif) C stretching was observed at about 1680 cm−1. A peak near 1100 cm−1 was shown for C–O stretching of the cyclic six-membered aromatic ring structure present in AmB. A broad peak appeared at 3416–3382 cm−1 for N–H stretching of the primary aromatic amine. In the FTIR spectra of PVA (Fig. 3B), C–O stretching vibration and O–H deformation peaks were found at 1440–1395 cm−1 and 1320–1211 cm−1 respectively. C–H stretching vibrations for the -CH3 group were observed near 2950 cm−1 whereas a broad peak in between 3300 cm−1 to 3400 cm−1 was for O–H stretching vibrations. All important peaks were present in the physical mixture of PLGA + PVA + AmB (Fig. 3D) with a few minor shifts. In the case of the blank nanoparticles no peaks for AmB were present.
C stretching was observed at about 1680 cm−1. A peak near 1100 cm−1 was shown for C–O stretching of the cyclic six-membered aromatic ring structure present in AmB. A broad peak appeared at 3416–3382 cm−1 for N–H stretching of the primary aromatic amine. In the FTIR spectra of PVA (Fig. 3B), C–O stretching vibration and O–H deformation peaks were found at 1440–1395 cm−1 and 1320–1211 cm−1 respectively. C–H stretching vibrations for the -CH3 group were observed near 2950 cm−1 whereas a broad peak in between 3300 cm−1 to 3400 cm−1 was for O–H stretching vibrations. All important peaks were present in the physical mixture of PLGA + PVA + AmB (Fig. 3D) with a few minor shifts. In the case of the blank nanoparticles no peaks for AmB were present. ![[double bond splayed left]](https://www.rsc.org/images/entities/char_e009.gif) CH2 symmetric stretching vibrations at 2850 cm−1 and sharp asymmetric
CH2 symmetric stretching vibrations at 2850 cm−1 and sharp asymmetric ![[double bond splayed left]](https://www.rsc.org/images/entities/char_e009.gif) CH2 stretching at 2920 cm−1 were the major identifiable peaks of OSM which were present in both the spectra of the physical mixture of PLGA + PVA + AmB + OSM (Fig. 3G) and the AmB-loaded PLGA–OSM nanoparticles, with minor shifting due to the presence of van der Waal’s attractions, formation of hydrogen bonding or any dipole–dipole interaction.33
CH2 stretching at 2920 cm−1 were the major identifiable peaks of OSM which were present in both the spectra of the physical mixture of PLGA + PVA + AmB + OSM (Fig. 3G) and the AmB-loaded PLGA–OSM nanoparticles, with minor shifting due to the presence of van der Waal’s attractions, formation of hydrogen bonding or any dipole–dipole interaction.33
3.3. DSC and TGA study
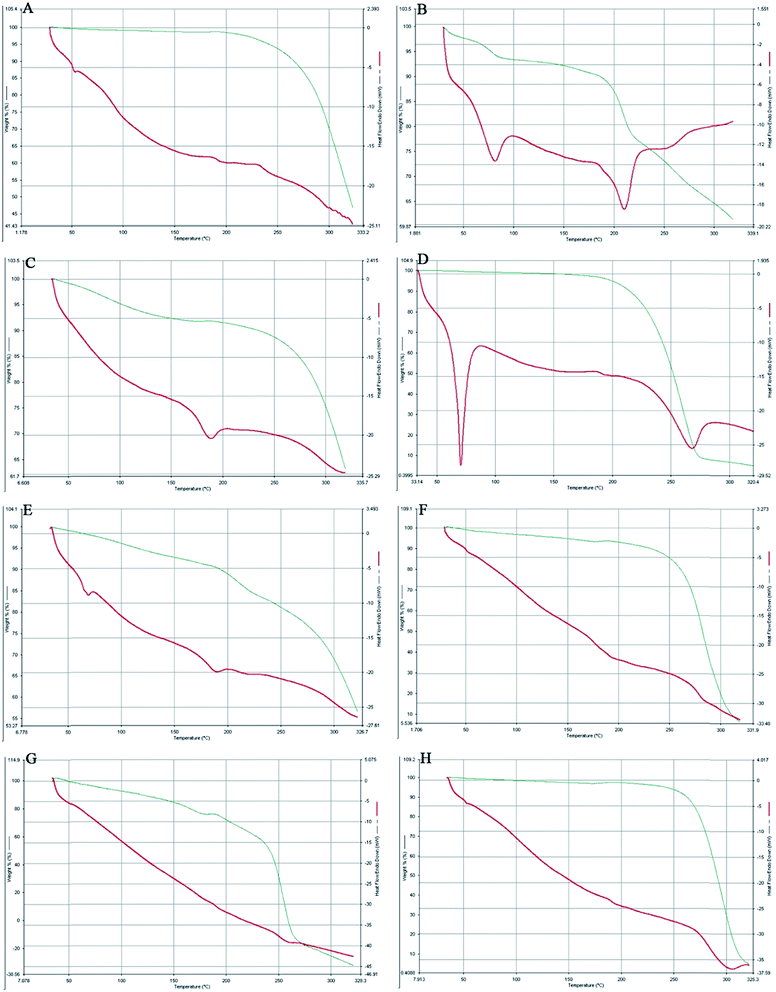
The comparative study of the DSC thermograms of Fig. 4 consisted of PLGA, AmB, a physical mixture of PLGA + AmB + PVA, OSM, a physical mixture of PLGA + AmB + PVA + OSM, AmB-loaded PLGA nanoparticles, AmB-loaded PLGA–OSM nanoparticles and blank nanoparticles. It can be observed in Fig. 4B that AmB had two endothermic peaks at 80.08 °C and 210.14 °C and that the physical mixture of PLGA + AmB + PVA showed a single endothermic peak at 185.03 °C (Fig. 4C). OSM (Fig. 4D) showed endothermic peaks at 70.59 °C and 267.13 °C, whereas the physical mixture with drug and other excipients showed endothermic peaks at 66.08 °C and 187.83 °C. Fig. 4F and G represent the endothermic peak at 181.14 °C for AmB-loaded PLGA nanoparticles, and 177.25 °C and 257.64 °C for AmB-loaded PLGA–OSM nanoparticles, whereas the blank nanoparticles showed an endothermic peak at about 300.09 °C.3.4. Particle size, zeta potential and PDI
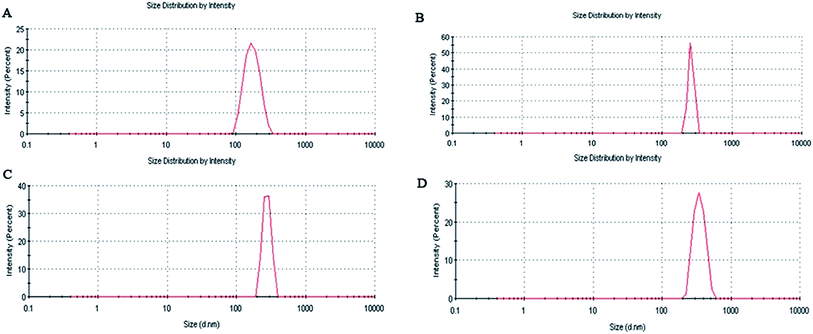
From Table 1 and Fig. 5 it is observed that the average particle size of the formulated nanoparticles is 182.8 ± 4.2 nm, 261.2 ± 5.7 nm, 280.9 ± 3.6 nm and 340.5 ± 6.2 nm, with PDI values of 0.355, 0.510, 0.686 and 0.438 for AN1, AN2, AN3 and ASMN, respectively. It was also found from Table 1 that all of the nanoformulations consist of a negative zeta potential i.e. −11.8 ± 2.1 mV for AN1, −12.3 ± 1.8 mV for AN2, −14.7 ± 2.7 mV for AN3 and −24.9 ± 1.6 mV for ASMN nanoparticles.3.5. SEM and TEM studies
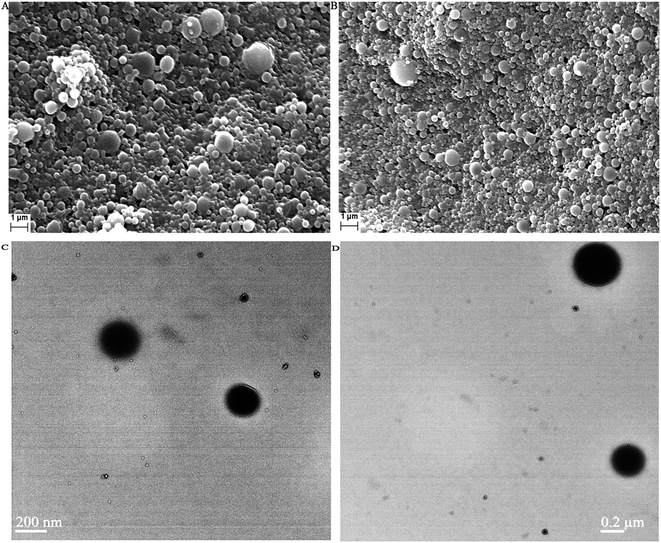
Fig. 6 shows the SEM and TEM images of AmB-loaded PLGA nanoparticles and AmB-loaded PLGA–OSM nanoparticles. Those studies were done to evaluate the morphological characteristics.3.6. Drug loading study
To determine the AmB loading in different types of formulations, firstly a standard curve of AmB was prepared by a liquid chromatographic technique. When the acquired areas were plotted against the respective concentrations a straight line was generated with an equation of y = 50.45x − 7.654 (R2 = 0.999). Using this equation the drug loading of different types of nanoformulations were calculated. From Table 1 it was found that for AN1, AN2 and AN3 the percentages of AmB loading were 6.7 ± 0.5%, 9.0 ± 0.5% and 11.5 ± 0.7%, respectively, and for ASMN it was found to be 10.2 ± 0.8%.3.7. AmB release study: in vitro
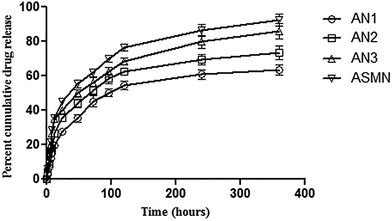
An in vitro cumulative drug release study was carried out for 360 h and from Fig. 7 it was found that 63.48% ± 1.08% of AmB was released from the formulation AN1, 73.45% ± 1.54% from AN2, 86.19% ± 1.86% from AN3 and from the formulation ASMN it was 92.56% ± 2.05%.Table 2 displays the different release kinetic models to depict the drug release mechanism. It was observed that the all of the formulations (AN1, AN2, AN3 and ASMN) fit best in the Korsmeyer–Peppas model with the release exponent of 0.523, 0.491, 0.442 and 0.442, respectively.
| Formulation | Correlation coefficient (R2) | Release exponent (n) | ||||
|---|---|---|---|---|---|---|
| Zero order | First order | Higuchi | Hixon–Crowell | Korsmeyer–Peppas | ||
| AN1 | 0.683 | 0.781 | 0.912 | 0.749 | 0.744 | 0.523 |
| AN2 | 0.666 | 0.792 | 0.898 | 0.750 | 0.660 | 0.491 |
| AN3 | 0.664 | 0.855 | 0.889 | 0.791 | 0.629 | 0.442 |
| ASMN | 0.533 | 0.833 | 0.758 | 0.726 | 0.523 | 0.442 |
3.8. Stability studies
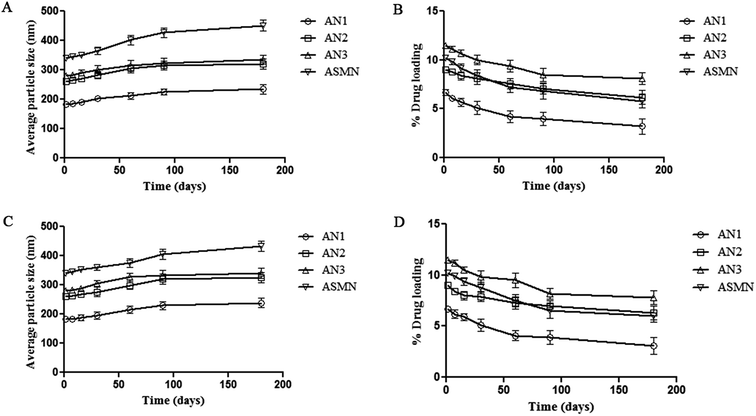
Storage stability studies of the experimental formulations were carried out at 4 °C and room temperature, for 6 months. At each predetermined time point (1, 7, 15, 30, 60, 90 and 180 days) particle size and drug loading were evaluated. From Fig. 8 it was found that the increases in the average particle size of all four of the formulations were insignificant. Similarly the percentages of drug loading of the formulations were not decreased significantly within the stipulated period of time.3.9. Macrophage uptake study: ex vivo
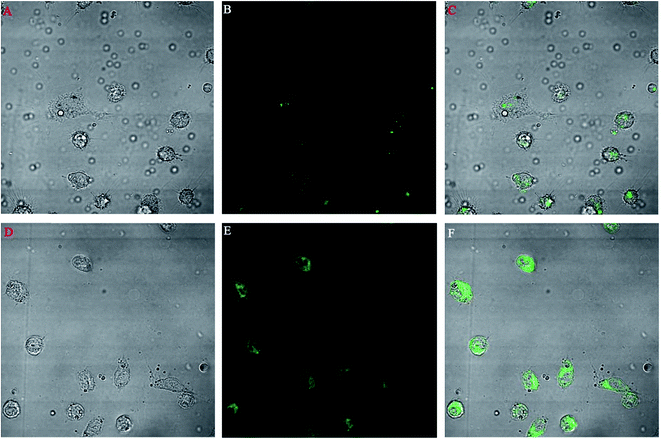
A macrophage uptake study was performed on isolated mice macrophages. Fig. 9 shows the comparative uptake study of two different types of FITC nanoparticles incubated for 10 min with macrophages. Fig. 9A–C show the bright, fluorescent and merged field images of the uptake of FITC-loaded PLGA nanoparticles whereas Fig. 9D–F show the bright, fluorescent and merged field images of the uptake of FITC-loaded PLGA–OSM nanoparticles.3.10. In vitro antileishmanial activity
The drug sensitivities of AmB, the AmB-loaded PLGA nanoformulation (AN3) and the AmB-loaded PLGA–OSM nanoformulation (ASMN) were evaluated against Leishmania donovani AG83 wild type, drug resistant and GE1 field isolated axenic amastigotes, as well as cellular amastigotes. Table 3 shows the IC50 (50% inhibitory concentration) values against axenic amastigotes which reveal that the IC50 values were 0.21 ± 0.08 μM, 0.13 ± 0.0.9 μM and 0.11 ± 0.06 μM for AmB, AN and ASMN, respectively, against wild type AG83 strains; 0.24 ± 0.06 μM, 0.15 ± 0.08 μM and 0.13 ± 0.09 μM for AmB, AN and ASMN, respectively, against SSG-R strains; 0.27 ± 0.0.9 μM, 0.17 ± 0.07 μM and 0.15 ± 0.05 μM for AmB, AN and ASMN, respectively, against PMM-R strains; and 0.22 ± 0.07 μM, 0.15 ± 0.09 μM and 0.14 ± 0.06 μM for AmB, AN and ASMN, respectively, against GE1 field isolated axenic amastigotes.| Drug/formulation | IC50 (mean ± SD, n = 3) μM | |||
|---|---|---|---|---|
| Axenic amastigotes evaluation model | ||||
| Wild type | SSG-R | PMM-R | GE1 field isolate | |
| a Assay methods are described in the Materials and methods section.b P > 0.05, no significant difference compared with AmB in the case of all the strains. | ||||
| AmB | 0.21 ± 0.08 | 0.24 ± 0.06 | 0.27 ± 0.0.9 | 0.22 ± 0.07 |
| AmB-loaded PLGA nanoformulation (AN) | 0.13 ± 0.09b | 0.15 ± 0.08b | 0.17 ± 0.07b | 0.15 ± 0.09b |
| AmB-loaded PLGA–OSM nanoformulation (ASMN) | 0.11 ± 0.06b | 0.13 ± 0.09b | 0.15 ± 0.05b | 0.14 ± 0.06b |
Table 4 displays the drug sensitivity against Leishmania donovani AG83 wild type, drug resistant and GE1 field isolated cellular amastigotes. It can be observed that against wild type cellular amastigotes the IC50 values were 0.15 ± 0.07 μM, 0.09 ± 0.08 μM and 0.07 ± 0.04 μM for AmB, AN and ASMN, respectively; for SSG-R these were 0.18 ± 0.05 μM, 0.12 ± 0.09 μM and 0.09 ± 0.05 μM, for PMM-R 0.20 ± 0.07 μM, 0.14 ± 0.06 μM, 0.11 ± 0.07 μM and for GE1 field isolated cellular amastigotes these were 0.16 ± 0.08 μM, 0.10 ± 0.06 μM and 0.07 ± 0.05 μM for AmB, AN and ASMN, respectively.
| Drug/formulation | IC50 (mean ± SD, n = 3) μM | CC50 (μM) (macrophage cells) (mean ± SD, n = 3) | |||||||
|---|---|---|---|---|---|---|---|---|---|
| Cellular amastigotes evaluation model | |||||||||
| Wild type | SIb | SSG-R | SIb | PMM-R | SIb | GE1 field isolate | SIb | ||
| a Assay methods are described in the Materials and methods section.b SI (selectivity index) = CC50/IC50.c P < 0.01 significant difference compared with AmB.d P > 0.05 not significant compared with AmB.e P < 0.01 significant difference compared with AmB.f P > 0.05 not significant compared with AmB.g P < 0.01 significant difference compared with AmB.h P < 0.01 significant difference compared with AmB. | |||||||||
| AmB | 0.15 ± 0.07 | 80.00 | 0.18 ± 0.05 | 66.67 | 0.20 ± 0.07 | 60.00 | 0.16 ± 0.08 | 75 | 12 ± 1.75 |
| AmB-loaded PLGA nanoformulation (AN) | 0.09 ± 0.08c | 255.56 | 0.12 ± 0.09d | 191.67 | 0.14 ± 0.06f | 164.29 | 0.10 ± 0.06g | 230.00 | 23 ± 2.02h |
| AmB-loaded PLGA–OSM nanoformulation (ASMN) | 0.07 ± 0.04c | 314.29 | 0.09 ± 0.05e | 244.44 | 0.11 ± 0.07f | 200.00 | 0.07 ± 0.05 g | 314.29 | 22 ± 2.25h |
Table 4 also shows the calculated values of the selectivity index (SI) against different strains. These were 80.00, 255.56 and 314.29 for AmB, AN and ASMN, respectively, for wild type strains; 66.67, 191.67 and 244.44 for AmB, AN and ASMN, respectively, for SSG-R strains; 60.00, 164.29 and 200.00 for AmB, AN and ASMN, respectively, for PMM-R strains and 75.00, 230.00 and 314.29 for GE1 field isolated strains for AmB, AN and ASMN, respectively.
3.11. Biochemical markers associated toxicity assessment
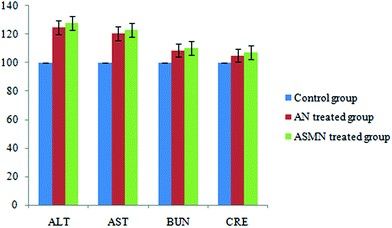
Fig. 11 shows the comparative toxicity study of the formulated nanoparticles i.e. AN and ASMN. It is observed from Fig. 11 that the intravenous administration of both of the formulations elevated the levels of hepatic enzymes, whereas a slight elevation in the levels of the blood urea nitrogen and creatinine is observed for both of the formulations.3.12. Antileishmanial study: in vivo
Table 5 indicates the antileishmanial efficiency of the formulated AmB-loaded nanoparticles over AmB alone. The percentage of suppression of the parasite burden in the spleen of BALB/c mice was used to evaluate the antileishmanial potential of the formulated nanoparticles and it was found to be 91.31 ± 1.10% for the AmB-treated mice group, 96.92 ± 0.45% for the AmB-loaded PLGA nanoparticles (AN) treated group of mice and 98.19 ± 0.33% for AmB-loaded PLGA–OSM nanoparticles (ASMN) treated mice group.| Control group | AmB treated group | AN treated group | ASMN treated group | |
|---|---|---|---|---|
| a Assay methods are described in the Materials and methods section.b LDU (Leishman–Donovan Unit) = no. of amastigotes per 500 nuclei × tissue weight (mg).c P < 0.01 significant compared to AmB.d P < 0.01 significant compared to AmB. | ||||
| Spleen weight (mg) | 141.18 ± 13.42 | 119.56 ± 11.27 | 104.08 ± 11.17 | 98.04 ± 7.83 |
| Amastigotes/500 nuclei ± SD | 2498.40 ± 451.54 | 215.60 ± 35.65 | 75.80 ± 8.61 | 44.80 ± 8.29 |
| LDUb × 104 ± SD | 35.57 ± 9.19 | 2.60 ± 0.62 | 0.79 ± 0.12c | 0.44 ± 0.11c |
| % of parasite suppression ± SD | — | 91.31 ± 1.10 | 96.92 ± 0.45d | 98.19 ± 0.33d |
4. Discussion
The successful synthesis of OSM from D-mannose was evident from the comparative analysis of the FTIR spectra of D-mannose and OSM (Fig. 2A); and 1H nuclear magnetic resonance study of OSM (Fig. 2B). It was found from Fig. 2A that intermolecular O–H stretching at 3200–3400 cm−1 was absent in the OSM spectrum, which could indicate that the stearoyl moiety was attached to all of the OH groups present in the mannose. On the other hand, it was observed from the comparative spectral analysis that O–H deformation peaks at 1260–1350 cm−1 were unchanged for mannose and OSM. The peaks’ appearance in this range is an indication of the presence of primary alcohols i.e. –CH2OH. As this was unchanged, it could suggest that the stearoyl moiety wasn’t attached to this particular position. On the other hand a change in the shape and the intensity of the peaks at 1000–1100 cm−1 was observed. Peaks at that range indicated the presence of a secondary alcohol in mannose which was altered in the case of OSM. The alteration in the shape and intensity of the peaks at that particular position signifies the attachment of a stearoyl moiety at those OH groups. However, according to Plusquellec et al.,34 the OH group attached to the α-anomeric carbon was the most preferable position for the attachment of the stearoyl moiety. Along with the FTIR data, the 1H NMR spectra further confirmed the synthesis of OSM.In this study we have prepared different types of AmB-loaded nanoparticles, i.e. AN1, AN2, AN3 and ASMN. The major difference among the AN1, AN2 and AN3 formulations was the drug and polymer ratios for their preparations, whereas ASMN was an OSM surface decorated AmB-loaded PLGA nanoformulation. Before further physicochemical characterization of those formulated nanoparticles, a drug–excipient compatibility study was carried out to identify whether they were compatible with each other both before and after the formulations. According to the many formulation scientists throughout the world, FTIR is the best analytical approach to evaluate the drug–excipient interactions in the formulations and by performing FTIR it was observed that they were compatible with each other and that they didn’t take part in any chemical interactions when physically mixed together or during the formulation. Due to the formation of hydrogen bonding, dipole–dipole interaction or van der Waals force there was some minor shifting of formulation which might be an indication of the physical interaction between them.35 As drug concentration was the only variable in the AN1, AN2 and AN3 formulations, we had chosen AN3 for the preformulation study (as well as the other studies) because it had the highest amount of AmB encapsulated in it. In the FTIR spectra of both of the formulations (Fig. 3F and H) the major peaks for AmB were absent, which indicated the proper encapsulation of it into the polymeric scaffold of PLGA and there was no free drug on the surface of the formulations. From the FTIR analysis it was also assumed that OSM was present on the surface of the ASMN formulation as the major identifiable peaks were present in both the spectra of the physical mixture of the drug and the excipients (Fig. 3F) and the formulation (Fig. 3H).
DSC-TGA analysis was further employed to confirm the drug–excipient compatibility. It was observed from the study that the drug AmB consisted of two endothermic peaks. The characteristic endothermic peak at 80.08 °C was for dehydration or loss of water which was supported by the TGA analysis, and decomposition was started at 195.05 °C followed by melting at 210.14 °C. The synthesized OSM shows a sharp endothermic peak at 70.59 °C, which could be the result of initial melting of the stearic acid part in OSM, followed by decomposition starting at 230.28 °C and melting at 267.13 °C. The presence of endothermic peaks at 181.14 °C and 177.25 °C, respectively, in the case of AmB-loaded PLGA nanoparticles and AmB-loaded PLGA–OSM nanoparticles depicted the presence of AmB in the polymeric core of the formulation, whereas in the case of AmB-loaded PLGA–OSM nanoparticles, the presence of an endothermic peak at 257.64 °C indicates the presence of OSM in the formulation.
Particle size had an enormous role in the biodistribution of the pharmaceuticals which in turn influenced the biological activity of the same.36 From Table 1 and Fig. 5 it could be found that all of the formulated nanoparticles were in the nanosize range. The formulations of AN1, AN2 and AN3 possessed an almost similar average particle size, whereas the mannose-modified AmB-loaded PLGA nanoparticles (ASMN) had a slightly higher average particle diameter, which might be due to the O-stearoyl mannose associated modification. PDI values indicated the heterogeneity of the particles in a dispersion. From the PDI values of the formulations it could be signified that a narrow nanosize distribution of particles was present in all of the formulations. The zeta potential indicated the load of the surface charge of the particles. The negative values of the zeta potential within around 25 mV ensured the physical stability of all of the nanoformulation systems. The balance between the repulsive and attractive force determined the stability of the system. Whenever the force of attraction was getting high, the particles became aggregated which could be prevent by high repulsive force. It was noticed that nanoparticles with a zeta potential of approximately ±30 mV gained stability in suspension.37,38
To evaluate the morphological pattern of the formulated nanoparticles of both types, SEM and TEM studies were carried out and these showed that the particles of the formulation of both types i.e. AmB-loaded PLGA nanoparticles and AmB-loaded PLGA–OSM nanoparticles were spherical in shape with smooth surfaces. From the SEM study it was also observed that the nanoparticles were slightly polydispersed as also depicted by their PDI values.
When the AmB loadings onto the formulated AN1, AN2, AN3 and ASMN nanoparticles were evaluated it was found that among AN1, AN2 and AN3, AN3 possessed the highest AmB loading of 11.5 ± 0.7%. It was also observed that the drug loading was increased with the increasing amount of AmB during formulation. In the case of ASMN it was 10.2 ± 0.8% which was almost similar to the loading of AN3.
The evaluation of the in vitro release study of a formulation is important as the biological fate of the formulation depends on it. When the AmB in vitro cumulative release study was evaluated, it was observed that the formulation ASMN released the highest amount of AmB (92.56% ± 2.05%) during the prolonged time period. Among the formulations AN1, AN2 and AN3; AN3 released highest amount of encapsulated AMB (86.19% ± 1.86%). In Fig. 7 the drug release patterns of AmB from different formulations are presented. From there it could be assumed that the initial release of AmB happened due to the presence of the drug nearer to the polymeric surface, whereas the slower release of AmB was due to the diffusion of the drug from the polymeric core of the formulations. From Table 2, the drug release kinetics of the four different experimental formulations on different release kinetics models could be observed and it was found that all of the formulations of AmB-loaded nanoparticles, AN1, AN2, AN3 and ASMN, followed the Korsmeyer–Peppas release kinetics model as evident from their values of correlation coefficient (R2) and it was also found that the values of release exponent (n) of all the formulations were between 0.43 and 0.85, indicating the anomalous diffusion or non-Fickian diffusion of the AmB from the hydrophobic polymeric core of the formulated nanoparticles.39
Stability on storage is a very important parameter for pharmaceuticals. To evaluate the storage stability, experimental formulations of four different types were kept at 4 °C and room temperature for 6 months. At each predetermined time point sample aliquots were collected to evaluate the particle size and drug loading. Insignificant changes were observed in both cases for all of the types of formulations, which indicated that the formulated nanoparticles were stable in these particular storage conditions.
The promastigote stage of leishmania parasites are phagocytosed by macrophages, and within the phagolysosomal vacuoles they convert to the amastigote stage and multiply to show pathogenicity in the host. Thus it is important to target the macrophages to increase the antileishmanial efficacy of the antileishmanial drugs. We prepared PLGA–OSM nanoparticles which were mannose-modified PLGA nanoparticles to target the macrophages. In this regard, ex vivo macrophage uptake studies of FITC-loaded PLGA nanoparticles and FITC-loaded PLGA–OSM nanoparticles were carried out. From Fig. 9D–F it could be observed that FITC-loaded PLGA–OSM nanoparticles were better taken up by the macrophages than the surface unmodified FITC-loaded PLGA nanoparticles, which indicated that the surface modification by mannose in formulated nanoparticles influenced the increase in the uptake by the macrophages.
In the present scenario of antileishmanial chemotherapy, AmB is a gold standard and used to treat leishmaniasis (especially the visceral one) throughout the world. The liposomal formulation of AmB is currently being used, but in the search for a more specific AmB delivery system with minimal toxicity or adverse effects, we have developed a mannose modified PLGA encapsulated AmB nanoformulation. To evaluate the antileishmanial potency of the formulated nanoparticles, an in vitro drug sensitivity assay was carried out against L. donovani AG83 wild type, SSG resistant, PMM resistant and GE1 field isolated strains. 50% inhibitory concentrations (IC50) were determined against both axenic and cellular amastigotes and tabulated in Tables 3 and 4, respectively. The CC50 values were determined for free AmB, AN and ASMN against isolated mice peritoneal macrophages and also tabulated in Table 4. A drug substance with intended biological activity should possess enough balance between efficacy for its intended purpose and its safety, which could be expressed as its selectivity index (SI). The AmB had an adequate safety and efficacy ratio which could be found from its SI values tabulated in Table 4. Evaluating the SI values of both types of formulations against different amastigote strains (Fig. 10), it was noticed that the mannose-modified formulation of AmB (ASMN) having a greater safety and efficacy balance means that it has higher SI values against wild type, drug resistant and GE1 field isolated amastigotes than only AmB-loaded PLGA nanoparticles.
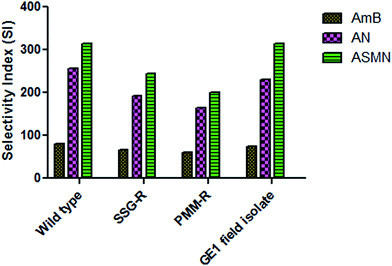 | ||
| Fig. 10 A comparative study of the SI of AmB, AN and ASMN against AG83 wild type, SSG-R, PMM-R and GE1 strains. | ||
The results of the in vivo toxicity assessment (Fig. 11) showed that the level of the hepatic enzymes, i.e. AST and ALT, were increased for both types of formulations but not so that they resulted in hepatotoxicity. It was also observed that the BUN and creatinine levels were not significantly elevated, which in turn reflected that the formulations of both types were not nephrotoxic at that particular dose regimen.
The in vivo antileishmanial potency of the free AmB and both types of nanoformulations were evaluated on a chronic VL infected mice model according to Mullen et al.40 It was observed from Table 5 that the mannose modified AmB-loaded PLGA–OSM nanoparticles exerted superior activity over free AmB as well as over AmB-loaded nanoparticles. This was might be due to the mannose modification of the nanoformulation, which could easily be taken up by the macrophages, as is already evident from the ex vivo macrophage uptake study.
5. Conclusion
This experimental work was a fruitful approach to fabricate an amphotericin B-loaded mannose decorated PLGA nanoparticulate associated drug delivery system for the treatment of the most endemic form of leishmaniasis, VL, also known as kala-azar in India. From this work it could be concluded that the mannose decorated formulation of PLGA is more efficacious than the unmodified drug-loaded PLGA nanoparticles against wild type, field isolated, as well as drug resistant amastigotes of L. donovani in vitro and in the case of the in vivo antileishmanial evaluation, the effectiveness of the mannose modified PLGA nanoparticles exerted superior efficacy. This delivery system reflects its ability for suitable homing of the drugs used in the treatment of macrophage associated diseases like visceral leishmaniasis.Conflict of interest
The authors have no conflict of interest.Acknowledgements
This experimental work was supported by the Indian Council of Medical Research (ICMR), India. The first author, Santanu Ghosh, is a senior research fellow of ICMR (BMS/FW/Nano/2014-26340/Feb.15/11/Govt.). We also acknowledge Dr Shyamol Roy, Scientist, Indian Institute of Chemical Biology, Kolkata, India for his valuable and generous support to obtain the Leishmania donovani AG83 (wild) strain.References
- World Health Organization (2014), Global Health Observatory Data – Leishmaniasis, available at: http://www.who.int/gho/neglected_diseases/leishmaniasis/en/GlobalHealthObservatory, accessed on April 21, 2015.
- V. Field, P. Gautret, P. Schlagenhauf, G. D. Burchard, E. Caumes, M. Jensenius, F. Castelli, E. Gkrania-Klotsas, L. Weld, R. Lopez-Velez and P. de Vries, BMC Infect. Dis., 2010, 10, 330 CrossRef PubMed.
- I. Okwor and J. E. Uzonna, Immunol. Res., 2013, 56, 163–171 CrossRef CAS PubMed.
- J. Alvar, I. D. Vélez, C. Bern, M. Herrero, P. Desjeux, J. Cano, J. Jannin and M. den Boer, PLoS One, 2012, 7, e35671 CAS.
- N. C. Peters, J. G. Egen, N. Secundino, A. Debrabant, N. Kimblin, S. Kamhawi, P. Lawyer, M. P. Fay, R. N. Germain and D. Sacks, Science, 2008, 321, 970–974 CrossRef CAS PubMed.
- N. C. Peters and D. L. Sacks, Cell. Microbiol., 2009, 11, 1290–1296 CrossRef CAS PubMed.
- H. Laufs, K. Müller, J. Fleischer, N. Reiling, N. Jahnke, J. C. Jensenius, W. Solbach and T. Laskay, Infect. Immun., 2002, 70, 826–835 CrossRef CAS PubMed.
- G. van Zandbergen, M. Klinger, A. Mueller, S. Dannenberg, A. Gebert, W. Solbach and T. Laskay, J. Immunol., 2004, 173, 6521–6525 CrossRef CAS.
- M. M. Kane and D. M. Mosser, Curr. Opin. Hematol., 2000, 7, 26–31 CrossRef CAS PubMed.
- M. K. Basu and S. Lala, Curr. Mol. Med., 2004, 4, 681–689 CrossRef CAS PubMed.
- F. Ahsan, I. P. Rivas, M. A. Khan and A. I. Suárez, J. Controlled Release, 2002, 79, 29–40 CrossRef CAS PubMed.
- R. Sett, K. Sarkar and P. K. Das, J. Infect. Dis., 1993, 168, 994–999 CrossRef CAS PubMed.
- N. P. Truong, M. R. Whittaker, C. W. Mak and T. P. Davis, Expert Opin. Drug Delivery, 2015, 12, 129–142 CrossRef CAS PubMed.
- N. P. Truong, J. F. Quinn, M. R. Whittaker and T. P. Davis, Poly. Chem., 2016, 7, 4295–4312 RSC.
- S. Mondal, P. Roy, S. Das, A. Halder, A. Mukherjee and T. Bera, PLoS One, 2013, 8, e81492 Search PubMed.
- S. Asthana, A. K. Jaiswal, P. K. Gupta, A. Dube and M. K. Chourasia, Eur. J. Pharm. Biopharm., 2015, 89, 62–73 CrossRef CAS PubMed.
- P. H. Stahl and S. Gordon, J. Cell Biol., 1982, 93, 49–56 CrossRef CAS PubMed.
- S. Asthana, P. K. Gupta, A. K. Jaiswal, A. Dube and M. K. Chourasia, Pharm. Res., 2015, 32, 2663–2677 CAS.
- M. E. Taylor and K. Drickamer, J. Biol. Chem., 1993, 268, 399–404 CAS.
- A. Mukhopadhyay and S. K. Basu. Biotechnology in India I, 2003, vol. 84, pp. 183–209 Search PubMed.
- S. Zhu, M. Niu, H. O’Mary and Z. Cui, Mol. Pharm., 2013, 10, 3525–3530 CrossRef CAS PubMed.
- L. H. Freitas-Junior, E. Chatelain, H. A. Kim and J. L. Siqueira-Neto, Int. J. Parasitol.: Drugs Drug Resist., 2012, 2, 11–19 CrossRef CAS PubMed.
- B. Mukherjee, K. Santra, G. Pattnaik and S. Ghosh, Int. J. Nanomed., 2008, 3, 487–496 CrossRef CAS.
- M. Niu, Y. W. Naguib, A. M. Aldayel, Y. C. Shi, S. D. Hursting, M. A. Hersh and Z. Cui, Mol. Pharm., 2014, 11, 4425–4436 CrossRef CAS PubMed.
- J. Lamarra, S. Rivero and A. Pinotti, Design of chitosan-based nanoparticles functionalized with gallic acid, Mater. Sci. Eng., C, 2016, 67, 717–726 CrossRef CAS PubMed.
- A. W. Stadnyk, A. D. Befus and J. Gauldie, Characterization of nonspecific esterase activity in macrophages and intestinal epithelium of the rat, J. Histochem. Cytochem., 1990, 38, 1–6 CrossRef CAS PubMed.
- P. Roy, S. Das, T. Bera, S. Mondal and A. Mukherjee, Andrographolide nanoparticles in leishmaniasis: characterization and in vitro evaluations, Int. J. Nanomed., 2010, 5, 1113–1121 CAS.
- K. Kar, K. Mukerji, K. Naskar, A. Bhattacharya and D. K. Ghosh, J. Protozool., 1990, 37, 277–279 CrossRef CAS PubMed.
- D. M. Iovannisci and B. Ullman, J. Parasitol., 1983, 69, 633–636 CrossRef CAS PubMed.
- M. Nahar and N. K. Jain, Pharm. Res., 2009, 26, 2588 CrossRef CAS PubMed.
- A. A. Seymour, J. H. Sheldon, P. L. Smith, M. Asaad and W. L. Rogers, J. Pharmacol. Exp. Ther., 1994, 269, 263–270 CAS.
- K. D. Manandhar, T. P. Yadav, V. K. Prajapati, S. Kumar, M. Rai, A. Dube, O. N. Srivastava and S. Sundar, J. Antimicrob. Chemother., 2008, 62(2), 376–380 CrossRef PubMed.
- S. Basu, B. Mukherjee, S. Roy Chowdhury, P. Paul, R. Choudhury, A. Kumar, L. Mondal, M. H. Chowdhury and R. Maji, Int. J. Nanomed., 2012, 7, 6049–6061 CAS.
- D. Plusquellec, F. Roulleau, F. Bertho, M. Lefeuvre and E. Brown, Tetrahedron, 1986, 42, 2457–2467 CrossRef CAS.
- P. J. Das, P. Paul, B. Mukherjee, B. Mazumder, L. Mondal, R. Baishya, M. C. Debnath and K. S. Dey, Mol. Pharm., 2015, 12, 2651–2664 CrossRef CAS PubMed.
- C. He, Y. Hu, L. Yin, C. Tang and C. Yin, Biomaterials, 2010, 31, 3657–3666 CrossRef CAS PubMed.
- V. J. Mohanraj and Y. Chen, Trop. J. Pharm. Res., 2006, 5, 561–573 Search PubMed.
- R. Fernandez-Urrusuno, P. Calvo, C. Remuñán-López, J. L. Vila-Jato and M. J. Alonso, Pharm. Res., 1999, 16, 1576–1581 CrossRef CAS.
- R. Maji, N. S. Dey, B. S. Satapathy, B. Mukherjee and S. Mondal, Int. J. Nanomed., 2014, 9, 3107 Search PubMed.
- A. B. Mullen, A. J. Baillie and K. C. Carter, Antimicrob. Agents Chemother., 1998, 42, 2722–2725 CAS.
| This journal is © The Royal Society of Chemistry 2017 |

