
 Open Access Article
 This Open Access Article is licensed under a
 Creative Commons Attribution 3.0 Unported Licence
Aggregation induced red shift emission of phosphorus doped carbon dots†
Ying Li‡
a,
Hechun Lin‡a,
Chunhua Luoa,
Yunqiu Wanga,
Chunli Jianga,
Ruijuan Qia,
Rong Huanga,
Jadranka Travas-sejdic*cd and
Hui Peng *abc
*abc
aKey Laboratory of Polarized Materials and Devices, Ministry of Education, East China Normal University, Shanghai, 200241, China. E-mail: hpeng@ee.ecnu.edu.cn
bCollaborative Innovation Center of Extreme Optics, Shanxi University, Taiyuan, Shanxi 030006, People's Republic of China
cPolymer Electronic Research Centre, The University of Auckland, Private Bag 92019, Auckland, New Zealand. E-mail: j.travas-sejdic@auckland.ac.nz
dMacDiarmid Institute for Advanced Materials and Nanotechnology, New Zealand
First published on 23rd June 2017
Abstract
Phosphorous doped carbon dots (P-CDs) are prepared by a one-step hydrothermal method. The phenomenon of aggregation induced red shift emission (AIRSE) is observed in the obtained P-CDs. The emission wavelength of a P-CD solution can be tuned in the range from 455 nm to 595 nm by changing the solution concentration.
Carbon dots (CDs), a new member of the carbon materials family, have attracted great attention due to their unique optical properties and green synthetic methods. Compared to inorganic quantum dots, which may contain toxic heavy metals, CDs are significantly more environmentally friendly and biologically compatible.1,2 To date, various synthesis methods to prepare CDs have been reported, including laser ablation,3 acid oxidation,4 electrochemical oxidation,5,6 microwave7–9 and hydrothermal preparations,10–12 by using variety of precursors. However, the optical properties of CDs prepared by different methods vary, especially in terms of dependence of the emission wavelength on the excitation wavelength.13 Due to their excellent features, CDs are widely applied in chemical and biological sensing, imaging and photocatalysis.13
Aggregation-induced emission (AIE) or aggregation-induced emission enhancement (AIEE) effects, as opposed to the phenomenon of aggregation-caused quenching, were first reported by Tang et al.,14 and are normally observed in fluorescent organic molecules.15 Such effects result from the restriction of intramolecular rotations, intramolecular vibrations or intramolecular motions due to aggregation.15 Because AIE or AIEE molecules are sensitive to the surrounding environmental changes, such as pH and solvent, they are widely used in biological and chemical sensing.15 The research in this field has been recently expanded into exploring the AIE or AIEE effects on the emission enhancement of nanoparticles.16–18 Gao et al. first reported that adenosine-5′-triphosphate induced aggregation of the CDs prepared from C60, which resulted in the enhanced photoluminescence.18 Recently, Liu et al. also illustrated AIEE properties of the CDs hydrothermally prepared from tannic acid, induced by the addition of organic solvents with small permittivity, such as tetrahydrofuran.17 However, in both cases, the aggregation caused a very little shift in the emission wavelength of CDs.
In this contribution, we report a phenomenon of aggregation induced red shift emission (AIRSE) of phosphorus doped CDs (P-CDs). Under the same excitation wavelength, the emission of P-CDs solution red shifted from blue to orange yellow with the increase of concentration, as schematically illustrated by Scheme 1. The P-CDs were prepared by hydrothermal treatment of triethyl phosphonoacetate in the presence of phosphoric acid (the detailed synthesis procedure is given in the ESI†). The morphology of P-CDs was first characterized by transmission electron microscopy (TEM) and atomic force microscopy (AFM). The typical TEM image is shown in Fig. 1a. The obtained CDs have a quasi-spherical shape with an average diameter of 3.5 nm (Fig. 1b). High resolution TEM images suggest that the P-CDs are crystalline, as clearly seen in the inset of Fig. 1a. The lattice parameter is ca. 0.23 nm. The AFM images (Fig. 1c and d) reveal that the heights of P-CDs are around 6 nm, further confirming the quasi-spherical shape of the P-CDs. The elemental analysis revealed the composition of the prepared P-CDs to be: C 57.41 wt%, H 4.19 wt%, P 18.73 wt%, and O (calculated) 19.67 wt%.
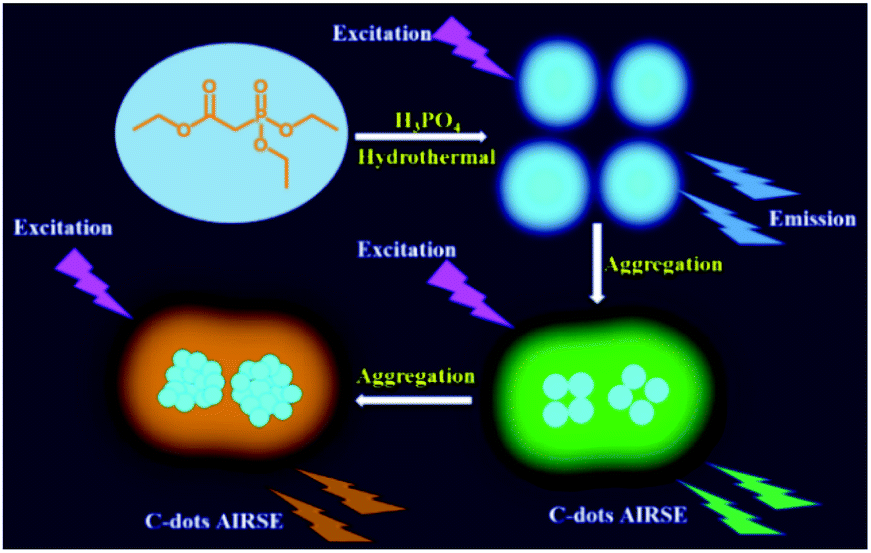 | ||
| Scheme 1 Schematic of the synthesis of P-CDs and the AIRSE effect caused by the increase of concentration. | ||
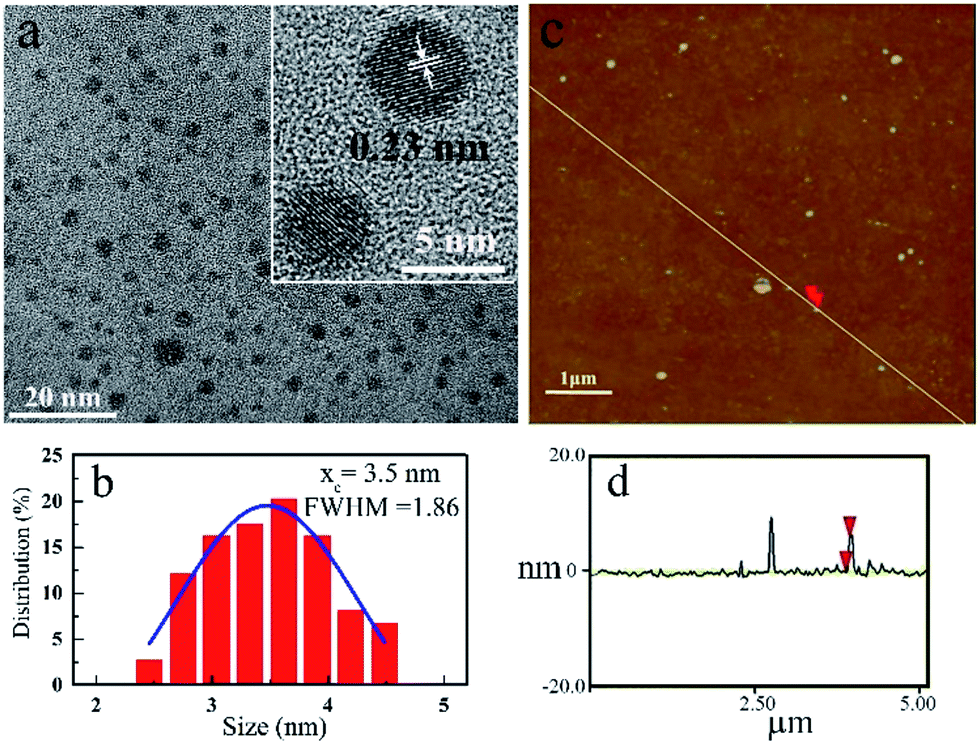 | ||
| Fig. 1 (a) TEM image of P-CDs; inset: high-resolution TEM image of P-CD; (b) size distribution of P-CDs measured by TEM; (c) AFM image of P-CDs; (d) height profile along the line in (c). | ||
To investigate the optical properties, UV-visible absorption spectra and PL spectra of P-CDs were measured. The P-CDs in a phosphoric acid solution show an absorption peak around 420 nm and an emission peak around 458 nm (Fig. S1†). The emission of the P-CDs show little dependence on the excitation wavelength in the tested excitation wavelength range (Fig. S1b†), which is different from that previously reported excitation-dependent emission property of CDs.19,20 A similar phenomenon was also observed in the carbon dots prepared by non-enzymatic browning reaction of amino acids with glucose,9 electrooxidation of graphite,21 and pyrolysis of PAN@PMMA core–shell nanoparticles.22 This could be due to the relatively narrow size distribution and uniform chemical features on the surfaces of the prepared carbon dot. Interestingly, we found that the emission wavelength red shifted when we continuously added a concentrated P-CDs solution to a blank phosphoric solution. Fig. 2a and b present the obtained absorption and PL spectra of P-CDs solutions with increased concentrations (note: the concentration of P-CDs solution is evaluated by using the optical density (OD) at 360 nm). It is clear that the emission wavelength shifted from 455 nm to 595 nm when the concentration of the P-CDs solution changed from 0.27 OD to 2.23 OD. While, the change of PL intensity of P-CDs solution with the concentration is as expected, as shown in the inset of Fig. 2b. The PL intensity first increased due to the increase of P-CDs concentration. Further increasing P-CDs concentration resulted in the decrease of the PL intensity because of fluorescence self-quenching.23 It is well known that high concentration will cause aggregation of nanoparticles in solutions. We suspect that observed red-shift of emission wavelength is induced by the aggregation of P-CDs. Thus, we performed a control experiment by diluting a concentrated P-CDs solution with phosphoric acid solution. The recorded absorption and PL spectra are shown in Fig. 2c and d, respectively. It can be seen that the emission wavelength blue shifted with the decrease in the concentration. These results illustrate that the emission wavelength of the P-CDs solution is closely related to the concentration and the shift of emission wavelength is reversible. That is to say, the extent of aggregation of the P-CDs in the solution, controlled by the concentration, determines the emission wavelength of the P-CDs solution.
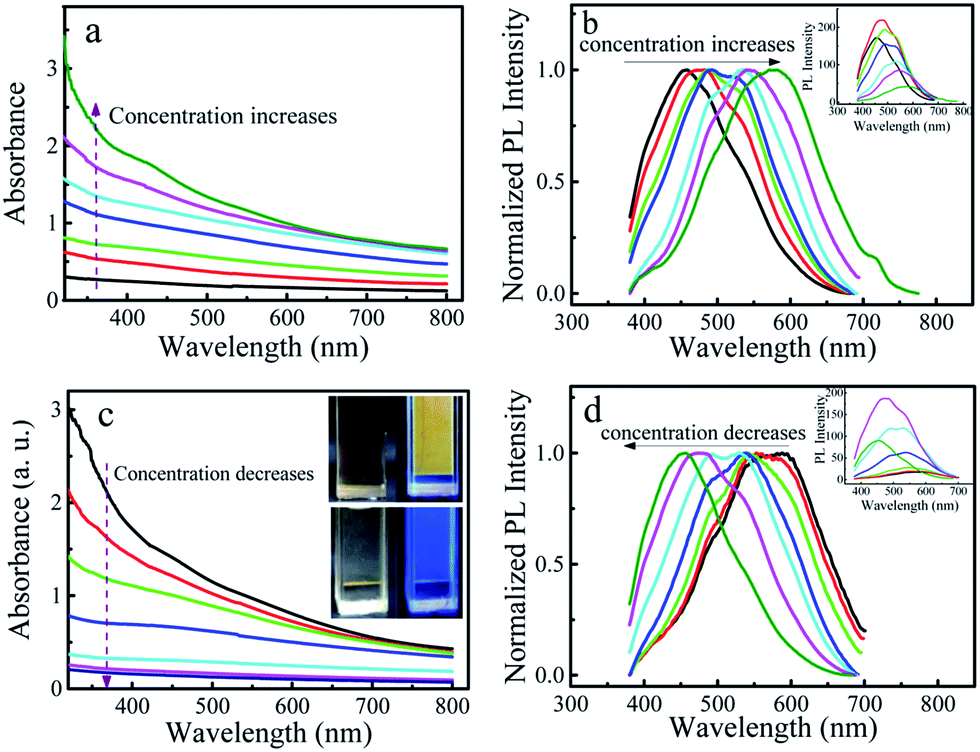 | ||
| Fig. 2 (a) Absorption spectra of P-CDs with increasing concentrations. The concentrations of P-CDs solutions are 0.27 OD, 0.54 OD, 0.73 OD, 1.11 OD, 1.35 OD, 1.73 OD and 2.23 OD, respectively; (b) corresponding normalized PL spectra; (c) absorption spectra of P-CDs with decreasing concentrations. The concentrations of P-CDs solutions are 2.26 OD, 1.69 OD, 1.21 OD, 0.71 OD, 0.33 OD, 0.22 OD and 0.18 OD, respectively; (d) corresponding normalized PL spectra. Inset in (b) and (d): unnormalized PL spectra. The PL spectra were recorded at an excitation wavelength of 360 nm. Inset in (c): photos of concentrated (left) and diluted P-CDs solutions under ambient light and UV light (325 nm). | ||
In order to exclude the contribution of phosphoric acid to the observed dependence of the emission wavelength on the concentration, the P-CDs were purified by dialysis and the aqueous solutions of the P-CDs were prepared. Decreasing the concentration of aqueous P-CDs solution resulted in the blue-shift of the emission wavelength (Fig. 3a and b). The observed phenomenon is the same as that of P-CDs in the phosphoric acid solution, which indicates that the red-shift of the emission wavelength is due to the aggregation of P-CDs, not the solvent.
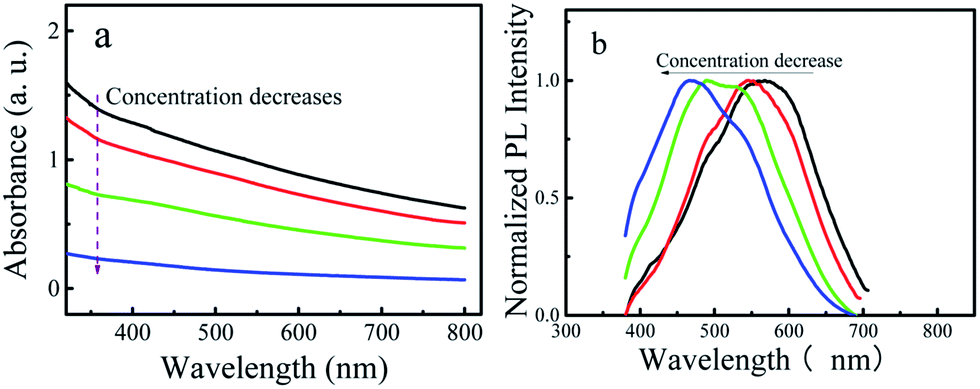 | ||
| Fig. 3 (a) Absorption spectra of P-CDs with decreasing concentrations by using distilled water. The concentrations of P-CDs solutions are 1.38 OD, 1.15 OD, 0.73 OD and 0.23 OD, respectively; (b) corresponding normalized PL spectra. | ||
To further confirm that the red-shift of the emission wavelength is caused by the aggregation, dynamic light scattering (DLS) measurements were performed by using the dialyzed aqueous P-CDs solutions. Fig. 4a and b give the size distribution curves of three P-CDs samples with different concentrations and the corresponding PL spectra. The average particle sizes of three samples were found to be 145 nm, 305 nm and 740 nm, and the corresponding emission wavelengths were 434 nm, 483 nm and 525 nm, respectively. It is a little surprising that the size of the aggregated particles are much larger than those measured by TEM and AFM; however these results are in accordance with a previous report which shows the average diameters of the aggregated carbon dots were more than 6.0 μm in tetrahydrofuran and acetone, and 0.6 μm in methanol.18 The results of DLS measurement clearly illustrate that high concentration of the solution causes the aggregation of P-CDs and the aggregation degree determines the emission wavelength of P-CDs solution.
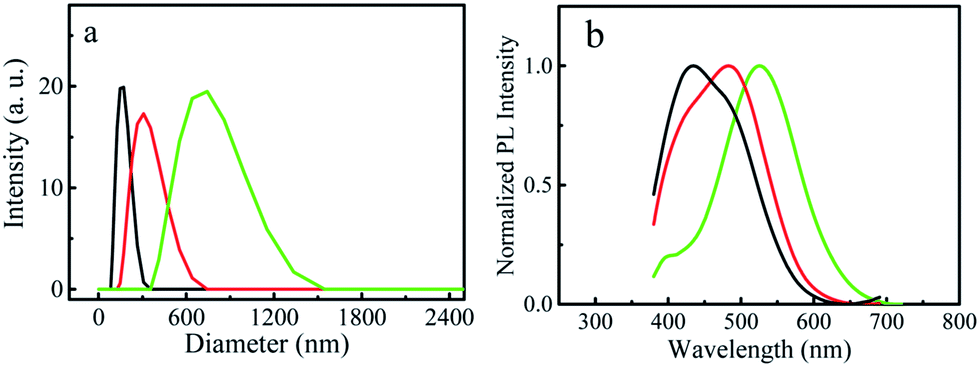 | ||
| Fig. 4 (a) Laser diffraction particle size distribution curves of P-CDs solutions. The concentrations of P-CDs solutions used for the measurements are 0.22 OD, 0.71 OD and 2.26 OD; (b) the corresponding PL spectra of the P-CDs solutions recorded with an excitation wavelength of 360 nm. | ||
To understand the mechanism of the observed AIRSE in the P-CDs, we first carried out a control experiment by using glucose and 4,7,10-trioxa-1,13-tridecanediamine as precursors to prepare nitrogen doped CDs (N-CDs). The absorption and PL spectra of N-CDs solutions with different concentrations are shown in Fig. 5a and b. It is obvious that the emission wavelength of the N-CDs is independent on the concentration. Next, we prepared CDs by using the same precursors in the presence of phosphoric acid. The elemental analysis revealed the composition of the obtained CDs to be: C 56.28 wt%, H 6.19 wt%, N 6.28 wt%, P 2.56 wt%, and O (calculated) 28.69 wt%, which illustrates that the obtained CDs are co-doped with P and N (named here P-N-CDs). Fig. 5c and d give the absorption and PL spectra of P-N-CDs solutions with different concentrations, respectively. Different from N-CDs, the emission wavelengths of P-N-CDs solutions are red shifted with the increase of the concentration. Additionally, due to the doping of phosphorus, the minimum emission wavelength of P-N-CDs (445 nm) is smaller than that of N-CDs (456 nm), which is in accordance with a previous report.24
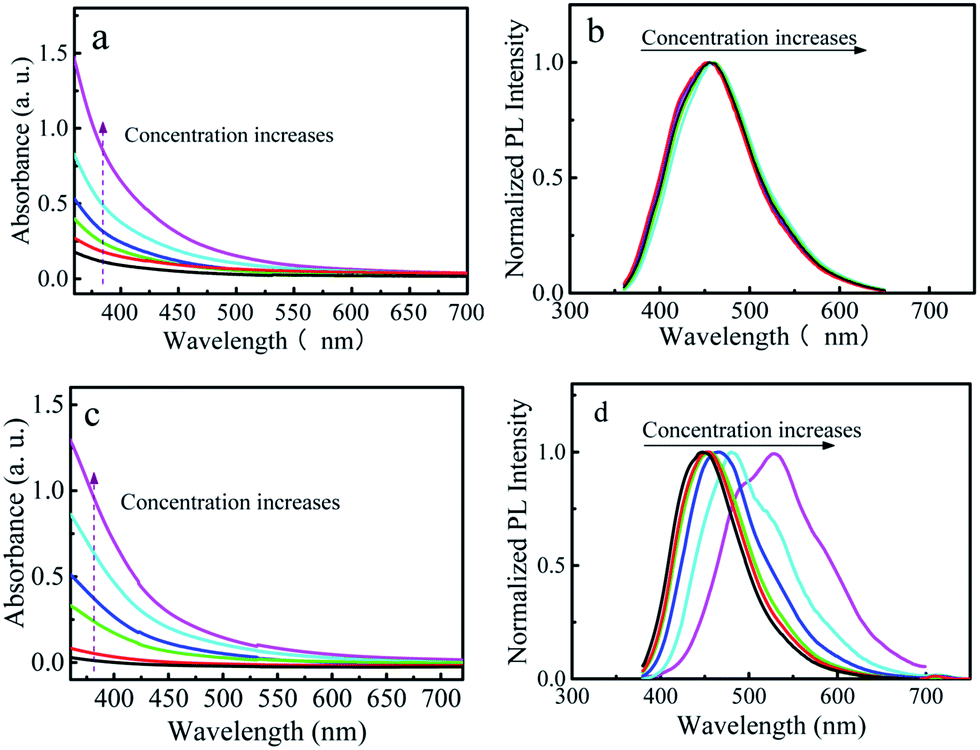 | ||
| Fig. 5 (a) Absorption spectra of N-CDs with decreasing concentrations. The concentrations of P-CDs solutions are 0.18 OD, 0.27 OD, 0.40 OD, 0.82 OD and 1.46 OD, respectively; (b) corresponding normalized PL spectra; (c) absorption spectra of P-N-CDs with decreasing concentrations. The concentrations of P-CDs solutions are 0.03 OD, 0.08 OD, 0.33 OD, 0.86 OD and 1.29 OD, respectively; (d) corresponding normalized PL spectra. The excitation wavelength is 360 nm. | ||
The above-mentioned results strongly suggest that the doped phosphorus plays an important role in the observed AIRSE. The previous reports have already illustrated that the luminescence of CDs can be enhanced by the doped phosphorus.24,25 The possible reason is that the addition of the electron-rich phosphorus into CDs causes more isolated sp2 carbon clusters and defect sites, which corresponds to the enhanced luminescence.24,25 For the observed phenomenon of AIRSE in the P-CDs solution, we believe that an electron rich system in the P-CDs was formed due to the doping of phosphorus. After aggregation, the particle sizes increase, which may cause the extension of electron system. The extension of electron system, similar to the increase in π–π conjugation, will result in the red shift of emission wavelength. In a previous report,26 Bhunia et al. illustrated that the CDs prepared from a carbohydrate in the presence of concentrated phosphoric acid emitted red light. They ascribed the red emission to the relatively larger particle sizes of the obtained CDs.26 However, they found that the red emission of CDs was only stable in strongly acidic conditions and rapidly transformed to a green emission at neutral or basic pHs. If stabilized by polyethylene glycol, the red emission was kept at physiological pH.26 Their observation is similar to our observations. We suspect that in their case polyethylene glycol stabilized the aggregates of CDs, which ensured that the aggregation degree did not change with the concentration.
In summary, we observed the phenomenon of AIRSE in phosphorus doped CDs for the first time. The emission wavelength of the P-CDs can be tuned in a wide range, from 455 nm to 595 nm by changing the solution concentration. The experimental results illustrate that the doped phosphorus plays an important role in the AIRSE of P-CDs. We suggest that a possible reason is that an electron rich system was formed in the P-CDS due to the doping with the electron-rich phosphorus. The increase in the particle sizes due to the aggregation therefore causes an extension of electron system, resulting in the red shift of the emission wavelength. The observed AIRSE of P-CDs provides a possibility for constructing new biosensing and bioimaging strategies not only based on the change of PL intensity, but also on the change of emission wavelength.
Acknowledgements
All the authors greatly appreciate the financial support from the National Key Project for Basic Research of China (Grant No. 2014CB921104).References
- S.-T. Yang, L. Cao, P. G. Luo, F. Lu, X. Wang, H. Wang, M. J. Meziani, Y. Liu, G. Qi and Y.-P. Sun, J. Am. Chem. Soc., 2009, 131, 11308 CrossRef CAS PubMed.
- C. Ding, A. Zhu and Y. Tian, Acc. Chem. Res., 2014, 47, 20 CrossRef CAS PubMed.
- S. Hu, Y. Dong, J. Yang, J. Liu and S. Cao, J. Mater. Chem., 2012, 22, 1957 RSC.
- H. Peng and J. Travas-Sejdic, Chem. Mater., 2009, 21, 5563 CrossRef CAS.
- L. Zheng, Y. Chi, Y. Dong, J. Lin and B. Wang, J. Am. Chem. Soc., 2008, 131, 1464 Search PubMed.
- Y. M. Long, Q. L. Zhao, Z. L. Zhang, Z. Q. Tian and D. W. Pang, Analyst, 2012, 137, 805 RSC.
- X. Wang, K. Qu, B. Xu, J. Ren and X. Qu, J. Mater. Chem., 2011, 21, 2445 RSC.
- J. Jiang, Y. He, S. Li and H. Cui, Chem. Commun., 2012, 48, 9634 RSC.
- W. Wei, C. Xu, L. Wu, J. Wang, J. Ren and X. Qu, Sci. Rep., 2014, 4, 3564 CrossRef PubMed.
- A. B. Bourlinos, A. Stassinopoulos, D. Anglos, R. Zboril, M. Karakassides and E. P. Giannelis, Small, 2008, 4, 455 CrossRef CAS PubMed.
- A. B. Bourlinos, A. Stassinopoulos, D. Anglos, R. Zboril, V. Georgakilas and E. P. Giannelis, Chem. Mater., 2008, 20, 4539 CrossRef CAS.
- H. Peng, Y. Li, C. Jiang, C. Luo, R. Qi, R. Huang, C.-G. Duan and J. Travas-Sejdic, Carbon, 2016, 100, 386 CrossRef CAS.
- A. Zhao, Z. Chen, C. Zhao, N. Gao, J. Ren and X. Qu, Carbon, 2015, 85, 309 CrossRef CAS.
- J. Luo, Z. Xie, J. W. Y. Lam, L. Cheng, H. Chen, C. Qiu, H. S. Kwok, X. Zhan, Y. Liu, D. Zhu and B. Z. Tang, Chem. Commun., 2001, 1740 RSC.
- J. Mei, N. L. C. Leung, R. T. K. Kwok, J. W. Y. Lam and B. Z. Tang, Chem. Rev., 2015, 115, 11718 CrossRef CAS PubMed.
- X. Jia, J. Li and E. Wang, Small, 2013, 9, 3873 CrossRef CAS PubMed.
- Z. X. Liu, Z. L. Wu, M. X. Gao, H. Liu and C. Z. Huang, Chem. Commun., 2016, 52, 2063 RSC.
- M. X. Gao, C. F. Liu, Z. L. Wu, Q. L. Zeng, X. X. Yang, W. B. Wu, Y. F. Li and C. Z. Huang, Chem. Commun., 2013, 49, 8015 RSC.
- S. Liu, J. Tian, L. Wang, Y. Zhang, X. Qin, Y. Luo, A. M. Asiri, A. O. Al-Youbi and X. Sun, Adv. Mater., 2012, 24, 2037 CrossRef CAS PubMed.
- L. Bao, Z.-L. Zhang, Z.-Q. Tian, L. Zhang, C. Liu, Y. Lin, B. Qi and D.-W. Pang, Adv. Mater., 2011, 23, 5801 CrossRef CAS PubMed.
- Q.-L. Zhao, Z.-L. Zhang, B.-H. Huang, J. Peng, M. Zhang and D.-W. Pang, Chem. Commun., 2008, 5116 RSC.
- Y. Wang, L. Dong, R. Xiong and A. Hu, J. Mater. Chem. C, 2013, 1, 7731 RSC.
- J. B. Birks, Photophysics of Aromatic Molecules-A Postscript, 1975 Search PubMed.
- J. Zhou, X. Shan, J. Ma, Y. Gu, Z. Qian, J. Chen and H. Feng, RSC Adv., 2014, 4, 5465 RSC.
- M. K. Barman, B. Jana, S. Bhattacharyya and A. Patra, J. Phys. Chem. C, 2014, 118, 20034 CAS.
- S. K. Bhunia, A. Saha, A. R. Maity, S. C. Ray and N. R. Jana, Sci. Rep., 2013, 3, 1473 CrossRef PubMed.
Footnotes |
| † Electronic supplementary information (ESI) available: synthesis of P-CDs and Fig. S1. See DOI: 10.1039/c7ra04781a |
| ‡ Y. Li and H. Lin contributed equally. |
| This journal is © The Royal Society of Chemistry 2017 |