
 Open Access Article
 This Open Access Article is licensed under a Creative Commons Attribution-Non Commercial 3.0 Unported Licence
High-performance method of carbon nanotubes modification by microwave plasma for thin composite films preparation†
Anna Dettlaffa,
Mirosław Sawczakb,
Ewa Klugmann-Radziemskaa,
Dariusz Czylkowskib,
Robert Miotkb and
Monika Wilamowska-Zawłocka *a
*a
aDepartment of Chemical Apparatus and Theory of Machines, Faculty of Chemistry, Gdańsk University of Technology, Narutowicza 11/12, 80-233 Gdańsk, Poland. E-mail: monika.wilamowska@pg.gda.pl
bInstitute of Fluid Flow Machinery, Polish Academy of Sciences, Fiszera 14, 80-231 Gdańsk, Poland
First published on 22nd June 2017
Abstract
In this work we present a simple and efficient method of nitrogen plasma modification of carbon nanotubes (CNTs). The process allows for treatment of the nanotubes in the form of powder with quite a high yield (65 mg of CNTs per hour). The modified carbon nanotubes contain approx. 3.8% nitrogen, mostly in the pyridinic form. Plasma treated CNTs exhibit better dispersibility in water and higher electric capacitance than pristine CNTs. Modified CNTs are a proper component of novel nanocomposites based on the conducting polymer poly(3,4-ethyleneidoxythiophene). Electrodeposited thin layers of the nanocomposite exhibit improved electrochemical properties (higher capacitance, better stability, lower resistance, faster diffusion) compared to the pure polymer layers.
1. Introduction
Carbon nanotubes (CNTs) can be described as cylindrically shaped one-dimensional nanostructures created from carbon hexagons arranged in a concentric manner. They are built from one or more graphene layers (single-walled, double-walled or multi-walled). CNTs have attracted particular research interest because of their unique features: thermal and mechanical stability, high surface area, good electrical and thermal conductivity and tunable porosity. Thus, these properties make CNTs attractive for potential application in the fields of: biosensors, fuel cells, nanoscale electronics, dye-sensitized solar cells, energy storage devices, hydrogen-storage systems, piezoelectrics etc.1 However, due to the strong intertubular van der Waals forces, high hydrophobicity and chemical inertness CNTs form large aggregates. Hence, CNTs are considered as structures exhibiting poor dispersion in most solvents.2–4An effective method to enhance chemical reactivity and to improve dispersibility is the incorporation of heteroatoms such as nitrogen, oxygen or boron into the carbon matrix. Among them, nitrogen atoms are the most conveniently used dopants due to their atomic radius (0.65 × 10⁻¹⁰ m) similar to that of carbon (0.70 × 10⁻¹⁰ m).5 Hence, nitrogen atoms have a feasible probability to enter the carbon lattice. Furthermore, nitrogen possesses a lone pair of electrons, which enhances the conjugative effect of the carbon nanotube lattice. Thus, nitrogen-doped carbon nanotubes (N-CNTs) exhibit extraordinary electrochemical features. Nitrogen addition may provide extra electrons in the carbon lattice, which improve the number of electronic states in the conduction and valence bands. Moreover, nitrogen can act as an n-type dopant enhancing the electron mobility and electric conductivity. Furthermore, the difference in electronegativity between C and N (2.55 and 3.04, respectively) results in increasing of the reduced work-function and tunable polarization. In this case, nitrogen groups may promote the Faradaic pseudocapacitive reactions, e.g. protonation of pyridinic nitrogen in acidic media.5–14
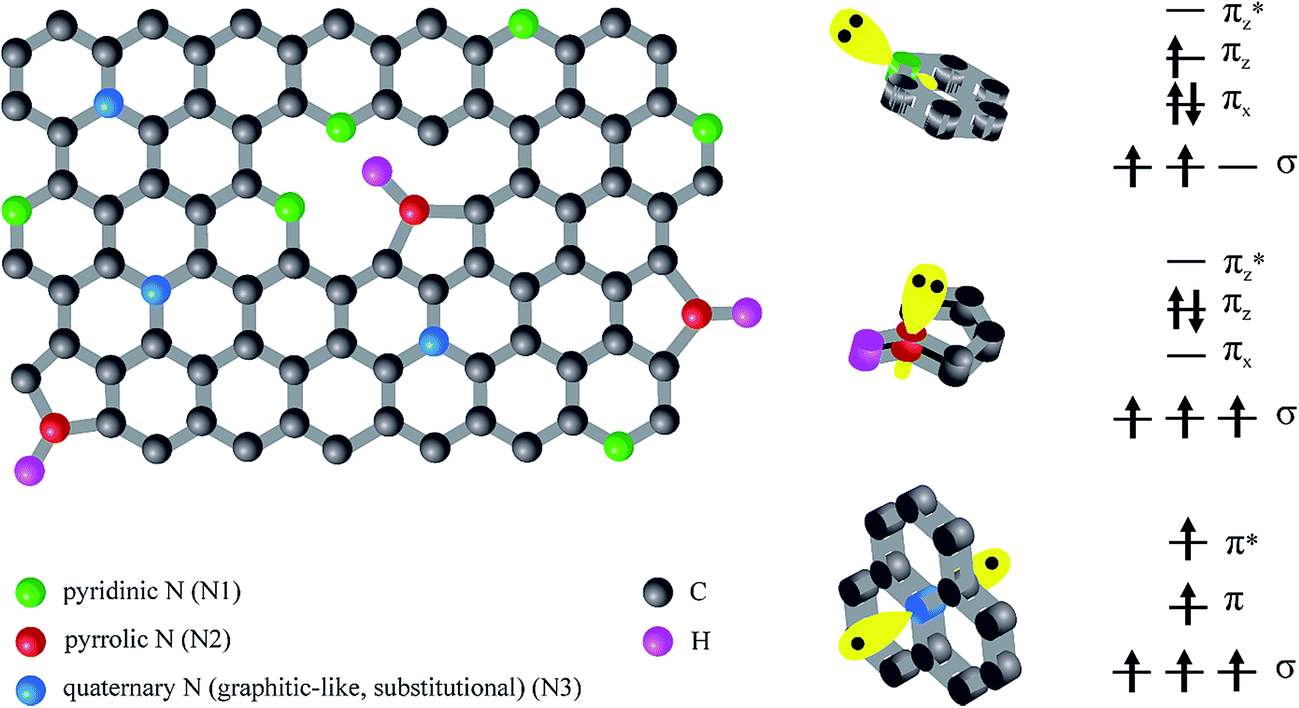
Incorporated nitrogen can create different configurations.5,15,16 Broadly speaking, there are three kinds of nitrogen incorporated in graphene sheets: pyridinic (N1), pyrrolic (N2) and graphitic-type (N3) as presented in Fig. 1. Each of them possesses distinct localized electronic features.
 | ||
| Fig. 1 Bonding and electron configurations for N in the carbon lattice. | ||
In particular, pyridinic N donates one πz electron to the ring. In pyridine the lone electron pair is in an sp2 orbital perpendicular to the p orbitals in the aromatic ring and does not interact with them. Pyrrolic-type N, in turn, contributes two πz electrons originated from the lone pair, to the p carbon orbitals. Moreover, the nitrogen atom is sp3 hybridized. On the other hand, the quaternary sp2 hybridized nitrogen is considered as N which replaces the C atom in the lattice. Substitutional nitrogen can change the local density state around the Fermi level of local carbon atoms.17 Generally, pyrrole-like and pyridine-like nitrogen improve the capacitive behaviour and substitutional nitrogen enhances the electronic transfer.8 Thus, doping with nitrogen atoms has been considered as a feasible strategy in improving properties of CNTs.
N-CNTs may be obtained by two methods: (i) in situ synthesis, which is based on direct carbonization of nitrogen-rich precursors, and (ii) post-treatment functionalisation, which refers to the modification of previously obtained carbon nanotubes. The most commonly used in situ techniques are: (i) spray pyrolysis – chemical vapour deposition – CVD18–28 (plasma enhanced PECVD,8,29–32 thermal CVD,27,29,33,34 aerosol-assisted CVD,35,36 high-vacuum CVD – HVCVD,37 etc.), and (ii) chamber pyrolysis.38–46 Less frequently used are: the arc discharge technique47–49 and hydrothermal carbonization.50 On the other hand, the post-treatment strategy includes chemical modification,51–55 thermal (heating in ammonia atmosphere or carbonization with N-rich precursors located on the CNTs surface56) and plasma treatment.44 Among these methods, the plasma approach possesses many advantages: it is solvent-free, less time-consuming and allows to control the synthesis condition. Moreover, it is rather a non-destructive method for CNTs structure, so it does not exacerbate the electrical properties of nanotubes.57
Generally, direct N-doping of carbon nanotubes in the form of powder is less studied due to the difficulty of uniform functionalization.58 There are a few reports concerning the N-doping process of powder CNTs: (i) by using plasma reactors59–62 or (ii) by plasma treatment of previously immobilized CNTs.63,64 To the best of our knowledge, this work is the first report on flowing plasma treatment of carbon nanotubes.
Herein, we report a facile method of plasma modification of carbon nanotubes. Moreover, plasma modified carbon nanotubes ((p)N-CNTs) were used as a component for preparation of nanocomposites based on conducting polymer poly(3,4-ethylenedioxythiophene) (pEDOT). The electrochemically synthesized thin layers of nanocomposite ((p)N-CNTs/pEDOT/PSS) were studied as electrodes for supercapacitor application.
2. Experimental
2.1. Chemicals
Multi-walled carbon nanotubes (≥98 carbon basis; O.D. × I.D. × L 10 nm ± 1 nm × 4.5 nm ± 0.5 nm × 3–6 μm), 3,4-ethylenedioxythiophene (EDOT) monomer, poly(sodium 4-styrenesulfonate (PSSNa) and 4-(1,1,3,3-tetramethylbutyl)phenylpolyethylene glycol (Triton™ X-100) were supplied by Sigma-Aldrich (Germany). Salts and acids: KCl, Na2SO4, HCl, H2SO4 (Avantor Performance Materials Poland S.A.) were of analytical grade and used without purification. 1-Methyl-2-pyrrolidinone (NMP) (BASF, Germany) and polyvinylidene fluoride (pVDF) (Solef, Germany) were used as received. Nitrogen (Air Liquide Polska) of purity greater than or equal to 99.995 (% vol.) was used as the plasma forming gas.2.2. Plasma modification of carbon nanotubes
In classical plasma systems the microwave (MW) of radio frequency (RF) plasma is generated in a low pressure closed chamber. In such a configuration plasma affects only the surface of the material disposed in the chamber. In case of samples in the form of powder, especially conductive powders, i.e. carbon nanotubes, that tend to agglomerate, the energy of electromagnetic radiation does not penetrate the bulk of the sample and only a small part of powder is modified. Even mixing of sample during the classical plasma process does not increase the degree of material modification. In this paper we propose an innovative method of carbon nanotubes plasma processing in flow, atmospheric pressure MW plasma. The experimental setup for plasma processing of nanotubes is presented in Fig. 2.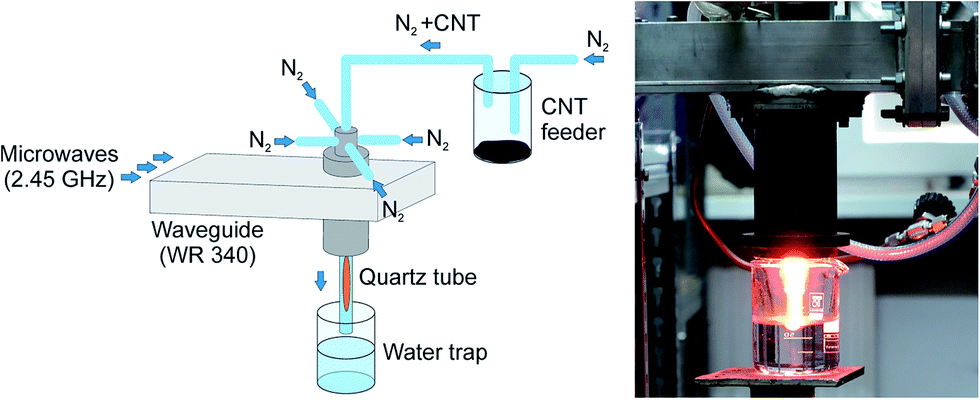 | ||
| Fig. 2 Experimental setup for CNTs modification in nitrogen plasma. | ||
A waveguide-supplied microwave (2.45 GHz) plasma source (MPS) operated at atmospheric pressure was used in this study. In such a type of MPS the plasma was generated within a dielectric (quartz) tube of inner and outer diameters and length of 10, 12 and 350 mm, respectively. Nitrogen as the plasma forming gas was introduced to the quartz tube via four gas inlets assuring a swirl flow inside the tube. Multi-walled carbon nanotubes mixed with gas (nitrogen flow seeded with the carbon nanotubes) were delivered to the plasma axially (Fig. 2). The plasma conditions (absorbed microwave power, nitrogen flow rate) were chosen experimentally to assure stable plasma source operation as well as good efficiency and repeatability of modification of carbon nanotubes. For instance, increasing the absorbed microwave power resulted in MPS quartz tube overheating leading to its destruction while increasing nitrogen flow rate caused process instabilities. Hence, the total nitrogen gas flow rate of 20 NL min−1 and the absorbed microwave power of 1 kW are the experimentally optimised conditions. Additionally, thinking of scaling up the presented process and its potential industrial application it is recommended to operate with microwave of the order of 1 kW which allows to use cheap commercial magnetron such as that installed in microwave oven and standard waveguide components. Plasma treated nanotubes (p)N-CNTs were trapped in deionised water and afterwards, dried in vacuum (12 h). For our experiment the process efficiency was estimated to 65 mg of nanotubes per hour. For future experiments we plan to optimize the CNTs feeder construction to improve the stability of mixing CNTs with nitrogen gas and to avoid transferring of nanotubes agglomerates to the plasma area. We expect that this will increase the efficiency of the process.
Regardless of the method described above, additional samples of carbon nanotubes were processed in a classical low-pressure RF plasma system (Femto Plasma System, Diener Electronics, Germany) operating at 13.56 MHz and 50 W plasma power. Carbon nanotubes in the form of powder were processed for period of time in the range from 2 min to 1 hour in a nitrogen atmosphere (samples marked as N-CNTs). Detailed conditions of plasma treatment of investigated CNTs samples by both methods and corresponding pictures of their aqueous suspensions are gathered in Table S1 and Fig. S1, respectively (see ESI†).
The aim of functionalization of carbon nanotubes is to increase their hydrophilicity and hence improve their dispersibility in polar solvents. Pristine carbon nanotubes (CNTs) and plasma treated carbon nanotubes were dispersed ultrasonically in water. Pristine CNTs, as well as N-CNTs remain agglomerated even after surfactant addition, whereas (p)N-CNTs disperse homogenously in pure water (Fig. S1 in ESI†).
2.3. Preparation of electrode layers
Pristine and N-doped carbon nanotubes electrode layers were prepared by the dip-coating technique. Firstly, 25 mg of CNTs and (p)N-CNTs powders were dispersed in 4 mL of 1-methyl-2-pyrrolidinone by sonication (20 h). Secondly, poly(vinylidene fluoride) binder was added. The weight ratio between CNTs and pVDF was 9 to 1. Afterwards, the slurries were mixed by sonication and then concentrated until the required viscosity was obtained by slow evaporation of solvent by heating (80 °C) and stirring. Then, deposition of the slurries on Pt wires by the dip-coating technique was carried out. The last step was drying of the layers in a vacuum dryer. For electrochemical measurements only coatings of similar weight were used.Nanocomposite layers based on nitrogen-doped carbon nanotubes and poly(3,4-ethylenedioxythiophene) with poly(4-styrenesulfonate) counter-ions ((p)N-CNTs/pEDOT/PSS) were prepared by electrochemical deposition at +0.87 V from an aqueous solution containing 1 mg mL−1 of N-doped carbon nanotubes, 15 mM EDOT and 0.1 M PSSNa. The electrochemical synthesis was performed in a three-electrode cell configuration. The working electrodes were: glassy carbon disc electrodes (0.0314 cm2), platinum disc electrodes (0.0177 cm2) or platinum plates (0.5 cm2), the reference electrode was Ag|AgCl|0.1 M KCl and platinum mesh served as the counter-electrode. The deposition charge was equal to 0.2 C cm−2. The concentration of (p)N-CNTs in the synthesis solution was selected according to our previous research.65
2.4. Characterization techniques
X-ray photoelectron spectroscopy (XPS) spectra of pristine and functionalised carbon nanotubes were measured using an Escalab 250Xi spectroscope (ThermoFischer Scientific, United Kingdom) with a monochromatic Al Kα source. Samples were studied in the form of powder. Spectra were acquired at constant analyser pass energy of 10 eV with 0.1 eV steps and were fitted with mixed Gaussian–Lorenzian peaks after Shirley-type background subtraction.The structure of the (p)N-CNTs/pEDOT/PSS and CNTs/PEDOT/PSS electrode layers were characterized by a scanning electron microscope (SEM) FEI Quanta FEG 250. The 10 kV beam accelerating voltage was used with a Secondary Electron-Everhart–Thornley Detector (SE-ETD) working in high vacuum mode pressure 10−4 Pa.
Raman spectra of CNTs and (p)N-CNTs powders were obtained with a confocal InVia, Renishaw micro-Raman spectrometer. The excitation wavelength was 514 nm (Ar ion laser), and the wavenumber was in the range of 100–3200 cm−1.
The electrochemical properties of carbon nanotubes and composite layers were investigated by cyclic voltammetry (CV), chronopotentiometry (ChP) and electrochemical impedance spectroscopy (EIS) using the AUTOLAB 302N potentiostat–galvanostat (AUTOLAB, Eco Chemie, B.V., Netherlands) under Nova software. All electrochemical tests were carried out in a three-electrode electrochemical cell under argon atmosphere. The Ag|AgCl|0.1 M KCl electrode and Pt mesh served as the reference and the counter electrode, respectively.
3. Results and discussion
3.1. Characterization of pristine and nitrogen-doped carbon nanotubes
Pristine and plasma treated carbon nanotubes were investigated by X-ray Photoelectron Spectroscopy and Micro-Raman Spectroscopy in order to evaluate their chemical and structural changes after the nitrogen doping process.XPS measurements were carried out mainly for verification of surface functional groups of the carbon nanotubes. The results of fitting of C 1s, O 1s, N 1s spectra are collected in Table 1.
| Pristine CNTs | (p)N-CNTs (flow plasma 1000 W) | (p)N-CNTs (flow plasma 250 W) | N-CNTs (chamber plasma 13.56 MHz, 50 W, 1 h) | Assignment | |||||
|---|---|---|---|---|---|---|---|---|---|
| BE/eV | at% | BE/eV | at% | BE/eV | at% | BE/eV | at% | ||
| C 1s | — | — | — | — | — | — | 283.4 | 6.5 | C![[double bond, length as m-dash]](https://www.rsc.org/images/entities/char_e001.gif) C C |
| 284.6 | 78.5 | 284.6 | 54.7 | 284.5 | 90.7 | 284.6 | 45.7 | C–C sp2, C–H | |
| 285.2 | 9.9 | 285.1 | 19.0 | 285.3 | 7.4 | 285.5 | 30.3 | C–C sp3 | |
| 285.9 | 4.1 | ||||||||
| 286.6 | 5.3 | 286.8 | 15.7 | — | — | 288.5 | 6.7 | CO, C–O, CN, C–N |
|
| O 1s | 531.8 | 1.4 | — | — | 530.9 | 0.9 | — | — | OC |
| 534.2 | 0.8 | 532.7 | 6.8 | 533.2 | 1.0 | 532.4 | 6.9 | O–C | |
| N 1s | — | — | 398.9 | 2.5 | — | — | 399.8 | 3.9 | Pyridinic N |
| — | — | 401.4 | 1.3 | — | — | — | — | Pyrrolic N, quaternary N | |
C 1s spectra of investigated samples were resolved into signals located in the range from 283.4 eV to 288.5 eV. The peaks are assigned to the particular carbon–carbon, carbon–oxygen and carbon–nitrogen bonds according to the literature reports.66–69 Two samples after plasma treatment, namely (p)N-CNTs (1000 W) and N-CNTs, exhibit higher amount of C–C sp3 bonds and higher amount of C–O/CO and C–N/CN bonds compared to pristine CNTs. This result suggest incorporation of oxygen and nitrogen functional groups on the CNTs surface. Moreover, XPS analysis confirmed presence of nitrogen in these two samples. The N 1s spectrum is deconvoluted into two main component peaks at binding energies of 398.9 eV and 401.4 eV. The first one can be ascribed to the pyridinic nitrogen, while the second one refers to both pyrrolic and quaternary nitrogen.66,70 The peak recorded at 401.4 eV is not divided into two separate signals due to its weak energy. The total nitrogen content in the (p)N-CNTs (1000 W) and N-CNTs samples is at the same level, namely 3.8 at% and 3.9 at%, respectively. Although both samples exhibit similar amount of nitrogen, the sample N-CNTs modified in standard plasma system does not give homogenous suspension in water (see Fig. S1, sample E, in ESI†). This leads to the conclusion that investigated classical low-pressure RF plasma (13.56 MHz, 50 W) apparently does not penetrate the bulk of the sample but causes modification only at the surface of CNTs agglomerates. On the other hand, neither nitrogen atoms nor increased amount of oxygen were detected for the sample treated with lower power flow plasma (p)N-CNTs (250 W). Despite this fact, the sample (p)N-CNTs (250 W) exhibit relatively good dispersion in 0.1 M PSSNa aqueous solution (Fig. S1, sample I, in ESI†). This suggest that modification of CNTs with lower power flow plasma was insufficient. Presented results demonstrate that homogenous dispersion of CNTs in water is possible only when CNTs are modified uniformly in the bulk of the sample and when the amount of heteroatoms/functional groups is on the proper level. The sample (p)N-CNTs modified in optimised conditions (flow plasma, 1000 W) was selected for further investigation.
To investigate the structure of pristine and nitrogen-doped (p)N-CNTs, a Raman spectroscopy measurement was conducted, and the results are shown in Fig. 3. In our work we utilize a five-peak model to fit first-order bands, and two peaks for the second-order ones (Fig. 4).
 | ||
| Fig. 3 Raman spectra showing differences in structure of carbon nanotubes upon the nitrogen-doping process. | ||
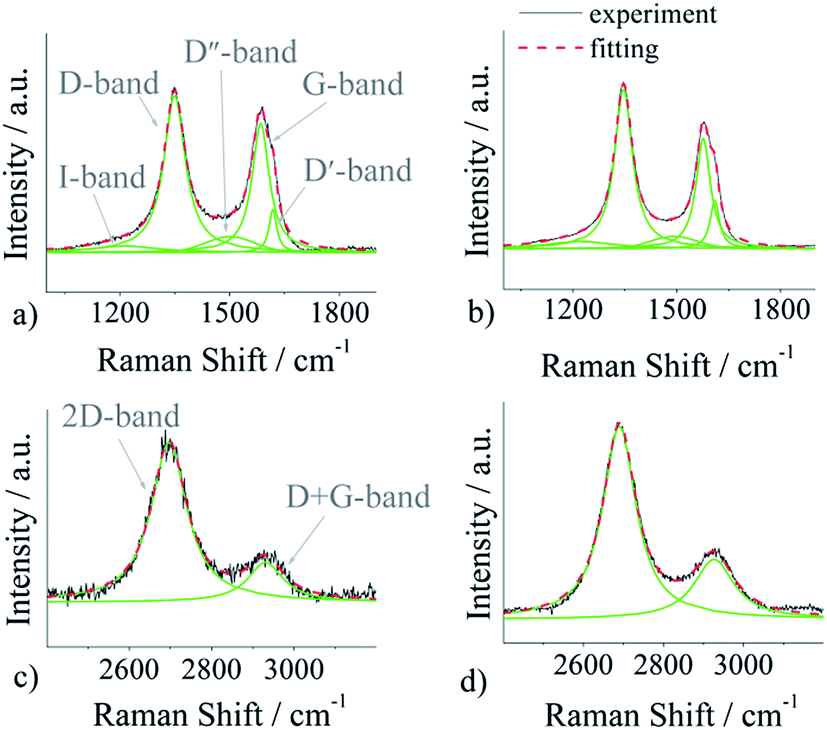 | ||
| Fig. 4 Fitting of first-order Raman spectra: (a) CNTs, (b) (p)N-CNTs; fitting of second-order spectra: (c) CNTs, (d) (p)N-CNTs. | ||
The spectra were deconvoluted independently after background subtraction. The results of the fitting procedure are gathered in Table 2. The first-order bands include: (i) D-band (1348 ± 2 cm−1), (ii) G-band (1580 ± 5 cm−1), (iii) D′-band (1614 ± 4 cm−1), (iv) D′′-band (1496 ± 5 cm−1), and (v) I-band (1216 ± 3 cm−1), whereas the second-order spectra can be fitted with two peaks: 2D-band (2693 ± 3 cm−1) and D + G-band (2929 ± 3 cm−1). The D, D′, I, D′′, D + G bands are assigned to the disordered symmetry of the carbon sp2 network. The disorganisation in the graphitic lattice may be caused by several effects: functional groups, in-plane defects of the tube, amorphous carbon (presence of the D′′ peak), heptagon–pentagon pair, incorporated heteroatoms, etc.71–73 As shown in Table 2, the area of peaks connected with disorder in the carbon lattice has increased after plasma modification.
| I-band | D-band | D′′-band | G-band | |||||
|---|---|---|---|---|---|---|---|---|
| Center of peak/cm−1 | Area (AI) | Center of peak/cm−1 | Area (AD) | Center of peak/cm−1 | Area (AD′′) | Center of peak/cm−1 | Area (AG) | |
| CNTs | 1213 | 5.6 | 1350 | 49.1 | 1501 | 7.8 | 1585 | 32.5 |
| (p)N-CNTs | 1219 | 7.5 | 1346 | 50.0 | 1491 | 6.8 | 1576 | 27.8 |
| D′-band | 2D-band | D + G-band | AD/AG | AD′/AG | ||||
|---|---|---|---|---|---|---|---|---|
| Center of peak/cm−1 | Area (AD′) | Center of peak/cm−1 | Area (A2D) | Center of peak/cm−1 | Area (AD+G) | |||
| CNTs | 1618 | 5.0 | 2696 | 80.2 | 2931 | 19.8 | 1.51 | 0.15 |
| (p)N-CNTs | 1610 | 7.9 | 2690 | 73.1 | 2926 | 26.9 | 1.80 | 0.28 |
The results show that plasma treatment changes the structure of carbon nanotubes suggesting successful incorporation of nitrogen atoms in the carbon lattice. Moreover, the area of G and 2D bands, both associated with ordered crystalline graphitic structures, decreased after nitrogen incorporation. The Raman spectra indicate that after the process of nitrogen doping the symmetry of the carbon sp2 network definitely has exacerbated.
According to literature reports, the peak area ratio of D and G bands (AD/AG) or of D′ and G peaks (AD′/AG) may be used to quantify the amount of defects in the carbon lattice.29 As shown in Table 2, the process of nitrogen doping causes an increase of the AD/AG ratio: from 1.51 for pristine CNTs to 1.80 for nitrogen doped (p)N-CNTs. The same dependence is analysed for the AD′/AG ratio: 0.15 for CNTs and 0.28 for (p)N-CNTs. These results indicate that the degree of disorder in graphitic lattice and edge plane exposure increases. The growth of these peak area ratios is connected with heterogeneous N-doping onto the carbon lattice of carbon nanotubes.22,74 Thus, the resolution of Raman spectra agrees well with the XPS data.
Cyclic voltammetry curves of CNTs and (p)N-CNTs electrode layers were recorded to evaluate their electrochemical behaviour. A rectangular shape of CV curves (Fig. 5) confirms the capacitive character of both types of carbon nanotubes. However, nitrogen-doped carbon nanotubes exhibit higher capacitance values, probably due to the presence of surface functional groups, which may be a source of pseudocapacitance.11–14 Another reason of higher current density observed on the CV curve of (p)N-CNTs may be the more homogenous electrode layer compared to the pristine CNTs, which tends to agglomerate.
 | ||
| Fig. 5 CV curves of (p)N-CNTs and CNTs dip-coated on Pt wires; outer electrolyte 0.1 M KCl, scan rate: 0.2 V s−1. | ||
3.2. Characterization of nanocomposite (p)N-CNTs/pEDOT/PSS
Plasma treated (flow plasma, 1000 W) carbon nanotubes (p)N-CNTs, due to their improved electrochemical properties, were selected for preparation of nanocomposites based on conducting polymer pEDOT with polystyrenesulfonate counterions. The nanocomposite (p)N-CNTs/pEDOT/PSS layers, obtained by electrodeposition, exhibit good adhesion to the electrode substrates, eliminating the need of using any additional binder.Scanning electron microscope measurements were taken to study the morphology and homogeneity of (p)N-CNTs/pEDOT/PSS layers and composite with pristine carbon nanotubes CNTs/pEDOT/PSS for comparison (the CNTs/pEDOT/PSS composite was electrodeposited with the same procedure as (p)N-CNTs/pEDOT/PSS layers). As shown in SEM images (Fig. 6), both composite layers exhibit a cauliflower-like structure, which is typical for poly(3,4-ethylenedioxythiophene).65,75–77 In the case of (p)N-CNTs/pEDOT/PSS composite the presence of (p)N-CNTs is clearly visible in the SEM images. Plasma treated carbon nanotubes create entangled networks that increase porosity of the nanocomposite. As can be seen in Fig. 6a), (p)N-CNTs are homogenously distributed within the composite. Higher magnification image of (p)N-CNTs/pEDOT/PSS (Fig. 6b) shows that polymer acts like a binder surrounding and connecting carbon nanotubes. On the other hand, SEM pictures of the CNTs/pEDOT/PSS composite do not show any evidence of presence of CNTs in the polymer matrix. The surface of CNTs/pEDOT/PSS is quite smooth and significantly less porous than (p)N-CNTs/pEDOT/PSS. Moreover, there are places in the CNTs/pEDOT/PSS layer with a large roughness (Fig. 6c), that may suggest random incorporation of CNTs agglomerates in the polymer.
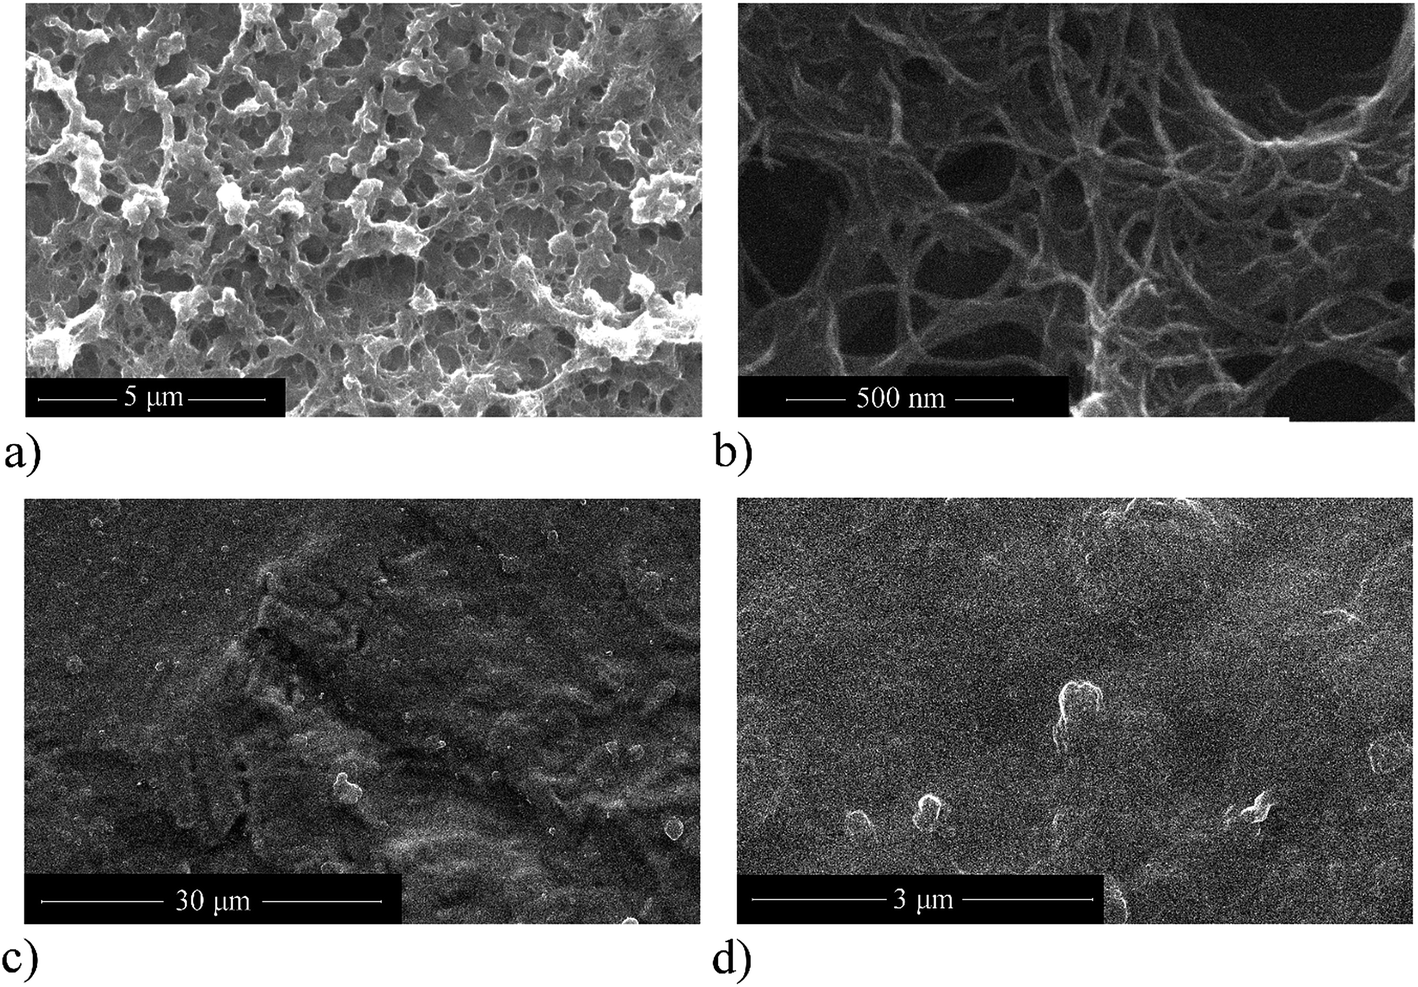 | ||
Fig. 6 SEM images of the surface of electrode layers deposited on Pt substrate: (a) (p)N-CNTs/pEDOT/PSS 10![[thin space (1/6-em)]](https://www.rsc.org/images/entities/char_2009.gif) 000× magnification, (b) (p)N-CNTs/pEDOT/PSS 100000× magnification, (c) CNTs/pEDOT/PSS 2500× magnification, (d) CNTs/pEDOT/PSS 25000× magnification. 000× magnification, (b) (p)N-CNTs/pEDOT/PSS 100000× magnification, (c) CNTs/pEDOT/PSS 2500× magnification, (d) CNTs/pEDOT/PSS 25000× magnification. | ||
Electrochemical measurements of the nanocomposite layers were performed in order to evaluate their usefulness as electrodes for supercapacitor application. The CNTs/pEDOT/PSS composite layers did not give reproducible results, thus the electrochemical studies for pure polymer without carbon nanotubes (pEDOT/PSS) are presented for comparison with the (p)N-CNTs/pEDOT/PSS composite. CV curves of the nanocomposite (p)N-CNTs/pEDOT/PSS and the conducting polymer pEDOT/PSS (Fig. 7) have a rectangular shape due to the capacitive behaviour of both materials. It is worth noticing that the nanocomposite layers exhibit significantly higher capacitance values compared to the pure polymer electrodes.
 | ||
| Fig. 7 CV curves of the (p)N-CNTs/pEDOT/PSS and pEDOT/PSS electrode layers at 0.2 V s−1; outer electrolyte 0.1 M KCl. | ||
The nanocomposite (p)N-CNTs/pEDOT/PSS layers were tested by cyclic voltammetry in different aqueous electrolytes: 1 M KCl, 1 M Na2SO4, 1 M HCl and 1 M H2SO4 (Fig. 8). The capacitance values achieved by (p)N-CNTs/pEDOT/PSS electrodes are higher in acidic solution compared to the neutral ones. It may be caused by functional groups present on the (p)N-CNTs surface that are more reactive in acidic solution. XPS analysis of (p)N-CNTs revealed that most of nitrogen atoms, incorporated during plasma treatment, are pyridine-like, which may be protonated in acidic media.11,14 Moreover, oxygen functional groups (i.e. quinone/hydroquinone), which are also present on the (p)N-CNTs surface, may be a source of additional pseudocapacitance in acidic electrolytes.12,14,65,78,79
 | ||
| Fig. 8 CV of the (p)N-CNTs/pEDOT/PSS electrode recorded in various electrolytes; scan rate 0.1 V s−1. | ||
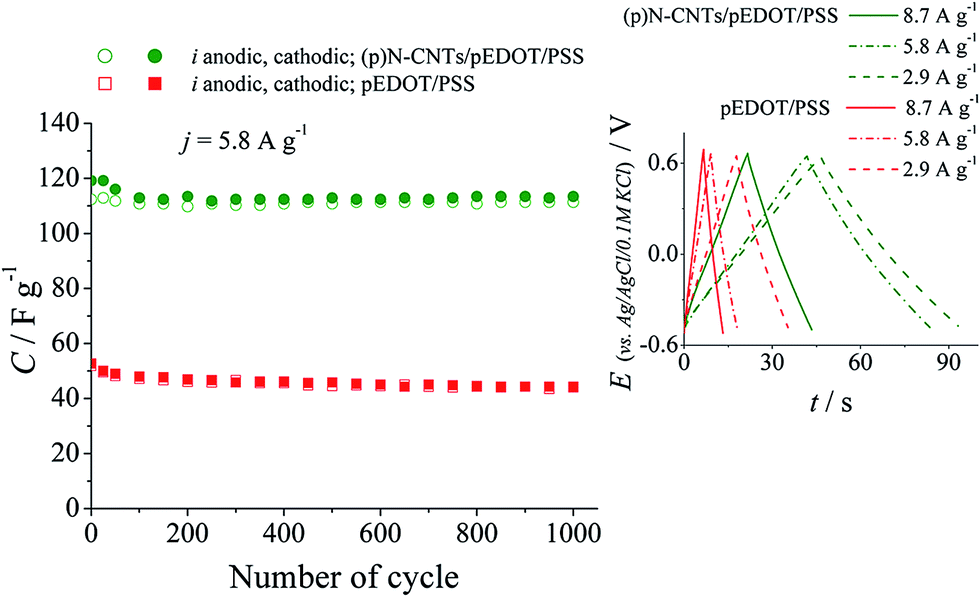
Prolonged galvanostatic charge–discharge measurements of the (p)N-CNTs/pEDOT/PSS nanocomposite and pEDOT/PSS conducting polymer electrodes were performed to evaluate the cyclability and the specific capacitance values. The results are presented in Fig. 9. The composite electrodes exhibit nearly two times higher capacitance values over thousands of charge–discharge cycles compared to the polymer electrodes. Moreover, the capacitance retention after 1000 cycles is higher for the composite (95%) than for the polymer (85%). Better stability of the (p)N-CNTs/pEDOT/PSS nanocomposite electrode layer is probably due to improved mechanical properties caused by the presence of plasma treated carbon nanotubes.80 Chronopotentiometric curves recorded at different currents (inset in Fig. 9) are symmetrical, confirming fast and reversible charge–discharge processes of investigated nanocomposite electrode layers.
 | ||
| Fig. 9 Chronopotentiometry tests of the (p)N-CNTs/pEDOT/PSS and pEDOT/PSS electrode layers recorded at 5.8 A g−1 in 0.1 M KCl electrolyte; inset: examples of chronopotentiometry curves recorded at different current densities in 0.1 M KCl electrolyte. | ||
Multicyclic chronopotentiometry tests were performed in different electrolytes (Fig. 10). The capacitance retention after thousands of cycles in neutral electrolytes is much higher (78–95%) compared to the acidic solution (67%). On the other hand, the capacitance values are two times higher in acidic media, which is in agreement with the results obtained from cyclic voltammetry measurements.
 | ||
| Fig. 10 Chronopotentiometry tests of the (p)N-CNTs/pEDOT/PSS electrode layer recorded in various electrolytes at 5.8 A g−1 current density; empty symbol – anodic current, full symbol – cathodic current. | ||
Electrochemical impedance spectroscopy measurements were carried out to examine the electrochemical behaviour, in particular the electrode kinetics, the capacitance and charge-transfer resistance of the investigated layers and the solution resistance. EIS analyses were conducted in contact with 1 M KCl electrolyte, in the frequency range from 25 kHz to 0.1 Hz with the amplitude equal to 10 mV. EIS spectra were recorded at a rest potential equal to 0.10 V and 0.25 V for the pEDOT/PSS and (p)N-CNTs/pEDOT/PSS layers, respectively. The Nyquist plots are presented in Fig. 11. The intercept of the curve with the real impedance axis gives an estimate of the solution resistance, which is equal to approximately 21 Ω. In the high- and mid-frequency region a line at a slope of about 45 degrees is present on both Nyquist plots. This domain is due to the distributed resistance/capacitance in the porous electrode and can be described by the finite transmission line model.81–83 The slope is slightly higher for the nanocomposite layer, suggesting faster diffusion of ions into the porous structure. The knee frequency is equal to 1 kHz for pEDOT/PSS and 1.45 kHz for the (p)N-CNTs/pEDOT/PSS electrode. The higher knee frequency for the nanocomposite indicates that a stable electric double-layer is formed over a wider range of frequencies. This is evidence that the (p)N-CNTs/pEDOT/PSS electrode may be more rapidly charged and discharged than the pEDOT/PSS electrode. In the low frequency region the slope of the Nyquist curve is nearly parallel to the imaginary axis. Such behaviour is typical for ideal capacitors with fast kinetics of charge flow processes.
 | ||
| Fig. 11 Nyquist impedance plots of the (p)N-CNTs/pEDOT/PSS and pEDOT/PSS; outer electrolyte 1 M KCl. | ||
The dependence between the specific capacitance and frequency (Fig. 12) exhibits an almost horizontal slope in the low frequency region. The specific capacitance values (C) were calculated from the imaginary part of the impedance spectra (−Z′′) according to eqn (1):84,85
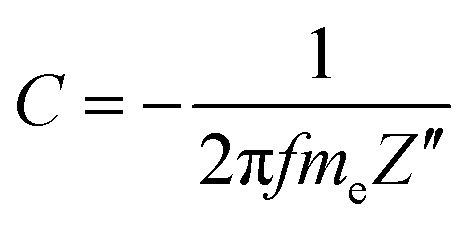 | (1) |
 | ||
| Fig. 12 Bode plots of (p)N-CNTs/pEDOT/PSS and pEDOT/PSS; outer electrolyte 1 M KCl. | ||
4. Conclusions
A facile method of flowing plasma treatment was applied for efficient modification of carbon nanotubes. The presented method allows to process the samples in the form of powder without using any solvent. Moreover, it is easy to control the synthesis conditions and influence the properties of the final product. Carbon nanotubes modified in optimised plasma conditions contain approx. 3.8% of nitrogen, mostly in pyridinic form. Modified (p)N-CNTs, due to the presence of nitrogen functional groups, exhibit better dispersibility in water, higher capacitance values compared to pristine CNTs. A novel nanocomposite (p)N-CNTs/pEDOT/PSS was synthesized and tested for supercapacitor application. The nanocomposite electrode layers exhibit two times higher capacitance values (above 100 F g−1), improved stability (95% capacitance retention after 1000 cycle in neutral electrolyte), lower resistance and easier diffusion than pure polymer layers. These features suggest that the (p)N-CNTs/pEDOT/PSS nanocomposite is a suitable electrode material for high-power application.Acknowledgements
The financial support from Norway Grants in the Polish-Norwegian Research Programme (Small Grant Scheme) operated by the National Centre for Research and Development, grant no. POL-NOR/209673/9/2013 is gratefully acknowledged. The authors thank Jacek Ryl for XPS measurements.References
- L. Dai, D. W. Chang, J.-B. Baek and W. Lu, Small, 2012, 8, 1130–1166 CrossRef CAS PubMed.
- M. Garzia Trulli, E. Sardella, F. Palumbo, G. Palazzo, L. C. Giannossa, A. Mangone, R. Comparelli, S. Musso and P. Favia, J. Colloid Interface Sci., 2017, 491, 255–264 CrossRef CAS PubMed.
- L. Dai, Y. Xue, L. Qu, H.-J. Choi and J.-B. Baek, Chem. Rev., 2015, 115, 4823–4892 CrossRef CAS PubMed.
- W.-M. Chang, C.-C. Wang and C.-Y. Chen, Electrochim. Acta, 2015, 186, 530–541 CrossRef CAS.
- S. Van Dommele, Nitrogen Doped Carbon Nanotubes: synthesis, characterization and catalysis, University of Utrecht, 2008 Search PubMed.
- W. J. Lee, U. N. Maiti, J. M. Lee, J. Lim, T. H. Han and S. O. Kim, Chem. Commun., 2014, 50, 6818–6830 RSC.
- D. Higgins, Nitrogen-Doped Carbon Nanotubes and their Composites as Oxygen Reduction Reaction Electrocatalysts for Low Temperature Fuel Cells, Master's thesis, University of Waterloo, 2011.
- S. Hussain, R. Amade, E. Jover and E. Bertran, J. Mater. Sci., 2013, 48, 7620–7628 CrossRef CAS.
- M. Y. Ghotbi and M. Azadfalah, Mater. Des., 2016, 89, 708–714 CrossRef CAS.
- H. Liu, H. Song, X. Chen, S. Zhang, J. Zhou and Z. Ma, J. Power Sources, 2015, 285, 303–309 CrossRef CAS.
- M. Antonietti and K. Müllen, Chemical Synthesis and Applications of Graphene and Carbon Materials, Wiley-VCH Verlag GmbH, Weinheim, 2017 Search PubMed.
- Y. H. Lee, K. H. Chang and C. C. Hu, J. Power Sources, 2013, 227, 300–308 CrossRef CAS.
- G. Lota, K. Lota and E. Frackowiak, Electrochem. Commun., 2007, 9, 1828–1832 CrossRef CAS.
- F. Béguin, V. Presser, A. Balducci and E. Frackowiak, Adv. Mater., 2014, 26, 2219–2251 CrossRef PubMed.
- J. McMurry, Organic Chemistry, Thomson, 7th edn, 2008 Search PubMed.
- C. P. Ewels, M. Glerup and V. Krstic, Nitrogen and boron doping in carbon nanotubes chapter in Chemistry of Carbon Nanotubes, ed. V. A. Basiuk and E. V. Basiuk, American Scientific Publishers, 2008 Search PubMed.
- Q. Wei, X. Tong, G. Zhang, J. Qiao, Q. Gong and S. Sun, Catalysts, 2015, 5, 1574–1602 CrossRef CAS.
- N. G. Tsierkezos, S. H. Othman, U. Ritter, L. Hafermann, A. Knauer, J. M. Köhler, C. Downing and E. K. McCarthy, Sens. Actuators, B, 2016, 231, 218–229 CrossRef CAS.
- N. Alexeyeva, E. Shulga, V. Kisand, I. Kink and K. Tammeveski, J. Electroanal. Chem., 2010, 648, 169–175 CrossRef CAS.
- Z. Chen, D. Higgins and Z. Chen, Carbon, 2010, 48, 3057–3065 CrossRef CAS.
- D. Higgins, Z. Chen and Z. Chen, Electrochim. Acta, 2011, 56, 1570–1575 CrossRef CAS.
- M. I. Ionescu, Y. Zhang, R. Li, H. Abou-Rachid and X. Sun, Appl. Surf. Sci., 2012, 258, 4563–4568 CrossRef CAS.
- A. R. John and P. Arumugam, J. Power Sources, 2015, 277, 387–392 CrossRef CAS.
- G. Keru, P. G. Ndungu and V. O. Nyamori, J. Nanomater., 2013, 2013, 7 Search PubMed.
- A. A. Koós, F. Dillon, E. A. Obraztsova, A. Crossley and N. Grobert, Carbon, 2010, 48, 3033–3041 CrossRef.
- A. Z. Sadek, V. Bansal, D. G. McCulloch, P. G. Spizzirri, K. Latham, D. W. M. Lau, Z. Hu and K. Kalantar-Zadeh, Sens. Actuators, B, 2011, 160, 1034–1042 CrossRef CAS.
- V. Thirumal, A. Pandurangan, R. Jayavel, S. R. Krishnamoorthi and R. Ilangovan, Curr. Appl. Phys., 2016, 16, 816–825 CrossRef.
- R. Kumar, R. K. Singh and R. S. Tiwari, Mater. Des., 2016, 94, 166–175 CrossRef CAS.
- J.-B. Kim, S.-J. Kong, S.-Y. Lee, J.-H. Kim, H.-R. Lee, C.-D. Kim and B.-K. Min, J. Korean Phys. Soc., 2012, 60, 1124–1128 CrossRef CAS.
- A. Kumar, S. Parveen, S. Husain, J. Ali, M. Zulfequar, Harsh and M. Husain, Appl. Surf. Sci., 2014, 322, 236–241 CrossRef CAS.
- A. U. Haq, J. Lim, J. M. Yun, W. J. Lee, T. H. Han and S. O. Kim, Small, 2013, 9, 3829–3833 CrossRef CAS PubMed.
- A. Salar Elahi, K. Mikaili Agah and M. Ghoranneviss, Results Phys., 2017, 7, 757–761 CrossRef.
- C. Kim, H.-R. Lee and H. T. Kim, Mater. Chem. Phys., 2016, 183, 8–12 CrossRef.
- B. Fragneaud, K. Masenelli-Varlot, A. González-Montiel, M. Terrones and J. Y. Cavaillé, Chem. Phys. Lett., 2007, 444, 1–8 CrossRef CAS.
- F. Villalpando-Paez, A. Zamudio, A. L. Elias, H. Son, E. B. Barros, S. G. Chou, Y. A. Kim, H. Muramatsu, T. Hayashi, J. Kong, H. Terrones, G. Dresselhaus, M. Endo, M. Terrones and M. S. Dresselhaus, Chem. Phys. Lett., 2006, 424, 345–352 CrossRef CAS.
- J. J. Adjizian, R. Leghrib, A. A. Koos, I. Suarez-Martinez, A. Crossley, P. Wagner, N. Grobert, E. Llobet and C. P. Ewels, Carbon, 2014, 66, 662–673 CrossRef CAS.
- L. Shi, M. Sauer, O. Domanov, P. Rohringer, P. Ayala and T. Pichler, Phys. Status Solidi B, 2015, 252, 2558–2563 CrossRef CAS.
- C. H. Choi, S. Y. Lee, S. H. Park and S. I. Woo, Appl. Catal., B, 2011, 103, 362–368 CrossRef CAS.
- C. H. Choi, S. H. Park and S. I. Woo, Appl. Catal., B, 2012, 119–120, 123–131 CrossRef CAS.
- D. P. Dubal, N. R. Chodankar, Z. Caban-Huertas, F. Wolfart, M. Vidotti, R. Holze, C. D. Lokhande and P. Gomez-Romero, J. Power Sources, 2016, 308, 158–165 CrossRef CAS.
- K. Kordatos, A. D. Vlasopoulos, S. Strikos, A. Ntziouni, S. Gavela, S. Trasobares and V. Kasselouri-Rigopoulou, Electrochim. Acta, 2009, 54, 2466–2472 CrossRef CAS.
- X. Li, L. Kong, J. Yang, M. Gao, T. Hu, X. Wu and M. Li, Appl. Phys. A: Mater. Sci. Process., 2013, 113, 735–739 CrossRef CAS.
- Z. Xu, H. Li, M. Fu, H. Luo, H. Sun, L. Zhang, K. Li, B. Wei, J. Lu and X. Zhao, J. Mater. Chem., 2012, 22, 18230 RSC.
- Z. Zhao, Y. Dai, G. Ge, X. Guo and G. Wang, Phys. Chem. Chem. Phys., 2015, 17, 18895–18899 RSC.
- Y. Wang, Y. Liu, W. Liu, H. Chen, G. Zhang and J. Wang, Mater. Lett., 2015, 154, 64–67 CrossRef CAS.
- T. Pan, H. Liu, G. Ren, Y. Li, X. Lu and Y. Zhu, Science Bulletin, 2016, 61, 889–896 CrossRef CAS.
- A. Ben Belgacem, I. Hinkov, S. Ben Yahia, O. Brinza and S. Farhat, Mater. Today Commun., 2016, 8, 183–195 CrossRef CAS.
- M. Glerup, J. Steinmetz, D. Samaille, O. Stéphan, S. Enouz, A. Loiseau, S. Roth and P. Bernier, Chem. Phys. Lett., 2004, 387, 193–197 CrossRef CAS.
- R. I. Zhao, Y. Ma, J. Zhang, F. Li, W. Liu and Q. Cui, Mater. Sci., 2010, 28, 189–198 CAS.
- J. Cao, T. Huang, R. Liu, X. Xi and D. Wu, Electrochim. Acta, 2017, 230, 265–270 CrossRef CAS.
- H. T. Ham, C. M. Koo, S. O. Kim, Y. S. Choi and I. J. Chung, Macromol. Res., 2004, 12, 384–390 CrossRef CAS.
- Z. Zhao, Z. Yang, Y. Hu, J. Li and X. Fan, Appl. Surf. Sci., 2013, 276, 476–481 CrossRef CAS.
- A. Yıldrım and T. Seçkin, Adv. Mater. Sci. Eng., 2014, 2014, 1–6 CrossRef.
- P. Santhosh, A. Gopalan and K. P. Lee, J. Catal., 2006, 238, 177–185 CrossRef CAS.
- B. Pan, D. Cui, R. He, F. Gao and Y. Zhang, Chem. Phys. Lett., 2006, 417, 419–424 CrossRef CAS.
- M. Sevilla, L. Yu, L. Zhao, C. O. Ania and M. Titiricic, ACS Sustainable Chem. Eng., 2014, 2, 1049–1055 CrossRef CAS.
- Y. Li and N. Chopra, Carbon, 2014, 77, 675–687 CrossRef CAS.
- M. Garzia Trulli, E. Sardella, F. Palumbo, G. Palazzo, L. C. Giannossa, A. Mangone, R. Comparelli, S. Musso and P. Favia, J. Colloid Interface Sci., 2017, 491, 255–264 CrossRef CAS PubMed.
- Z. Chen, X. J. Dai, P. R. Lamb, D. R. De Celis Leal, B. L. Fox, Y. Chen, J. Du Plessis, M. Field and X. Wang, Plasma Processes Polym., 2012, 9, 733–741 CrossRef CAS.
- L. G. Nair, A. S. Mahapatra, N. Gomathi, K. Joseph, S. Neogi and C. P. R. Nair, Appl. Surf. Sci., 2015, 340, 64–71 CrossRef CAS.
- R. Chetty, S. Kundu, W. Xia, M. Bron, W. Schuhmann, V. Chirila, W. Brandl, T. Reinecke and M. Muhler, Electrochim. Acta, 2009, 54, 4208–4215 CrossRef CAS.
- A. Gohel, K. C. Chin, Y. W. Zhu, C. H. Sow and A. T. S. Wee, Carbon, 2005, 43, 2530–2535 CrossRef CAS.
- Y. H. Lai, H. Bin Lian and K. Y. Lee, Diamond Relat. Mater., 2009, 18, 544–547 CrossRef CAS.
- G. R. S. Iyer and P. D. Maguire, J. Mater. Chem., 2011, 21, 16162 RSC.
- A. Dettlaff and M. Wilamowska, Synth. Met., 2016, 212, 31–43 CrossRef CAS.
- R. Bogdanowicz, M. Sawczak, P. Niedzialkowski, P. Zieba, B. Finke, J. Ryl, J. Karczewski and T. Ossowski, J. Phys. Chem. C, 2014, 118, 8014–8025 CAS.
- B.-J. Kim, J.-P. Kim and J.-S. Park, Nanoscale Res. Lett., 2014, 9, 236 CrossRef PubMed.
- P. Niedziałkowski, T. Ossowski, P. Zięba, A. Cirocka, P. Rochowski, S. J. Pogorzelski, J. Ryl, M. Sobaszek and R. Bogdanowicz, J. Electroanal. Chem., 2015, 756, 84–93 CrossRef.
- K. Siuzdak, M. Ficek, M. Sobaszek, J. Ryl, M. Gnyba, P. Niedziałkowski, N. Malinowska, J. Karczewski and R. Bogdanowicz, ACS Appl. Mater. Interfaces, 2017, 9(15), 12982–12992 CAS.
- R. Arrigo, M. Hävecker, R. Schlögl and D. S. Su, Chem. Commun., 2008, 4891–4893 RSC.
- V. Datsyuk, M. Kalyva, K. Papagelis, J. Parthenios, D. Tasis, A. Siokou, I. Kallitsis and C. Galiotis, Carbon, 2008, 46, 833–840 CrossRef CAS.
- O. Beyssac, B. Goffe, J. Petitet, E. Froigneux and M. Moreau, Spectrochim. Acta, Part A, 2003, 59, 2267–2276 CrossRef.
- T. Sharifi, F. Nitze, H. R. Barzegar, C. W. Tai, M. Mazurkiewicz, A. Malolepszy, L. Stobinski and T. Wagberg, Carbon, 2012, 50, 3535–3541 CrossRef CAS.
- S. Y. Wang, X. S. Zhao, T. Cochell and A. Manthiram, J. Phys. Chem. Lett., 2012, 3, 2164–2167 CrossRef CAS PubMed.
- Y. Xiao, X. Cui and D. C. Martin, J. Electroanal. Chem., 2004, 573, 43–48 CAS.
- Y. Ma, F. Zhao and B. Zeng, Talanta, 2013, 104, 27–31 CrossRef CAS PubMed.
- M. Wilamowska and A. Lisowska-Oleksiak, Solid State Ionics, 2011, 188, 118–123 CrossRef CAS.
- V. Khomenko, E. Raymundo-Piñero and F. Béguin, J. Power Sources, 2010, 195, 4234–4241 CrossRef CAS.
- M. Seredych, M. Koscinski, M. Sliwinska-Bartkowiak and T. J. Bandosz, J. Power Sources, 2012, 220, 243–252 CrossRef CAS.
- Z. Mousavi, J. Bobacka, A. Lewenstam and A. Ivaska, J. Electroanal. Chem., 2009, 633, 246–252 CrossRef CAS.
- W. J. Albery and A. R. Mount, J. Chem. Soc., Faraday Trans., 1993, 89, 2487 RSC.
- P. G. Pickup, J. Chem. Soc., Faraday Trans., 1990, 86(21), 3631–3636 RSC.
- X. Ren and P. G. Pickup, J. Chem. Soc., Faraday Trans., 1993, 89, 321 RSC.
- M. Skunik-Nuckowska, P. Bacal and P. J. Kulesza, J. Solid State Electrochem., 2015, 19, 2753–2762 CrossRef CAS.
- Y.-G. Wang, Z.-D. Wang and Y.-Y. Xia, Electrochim. Acta, 2005, 50, 5641–5646 CrossRef CAS.
Footnote |
| † Electronic supplementary information (ESI) available. See DOI: 10.1039/c7ra04707j |
| This journal is © The Royal Society of Chemistry 2017 |