
 Open Access Article
 This Open Access Article is licensed under a
 Creative Commons Attribution 3.0 Unported Licence
Cathodic shift of a photo-potential on a Ta3N5 photoanode by post-heating a TiO2 passivation layer†
Jie Liua,
Wenjun Luo *a,
Kaijian Zhua,
Xin Wenb,
Fei Xiua,
Jiajie Yuana,
Zhigang Zoub and
Wei Huang*ac
*a,
Kaijian Zhua,
Xin Wenb,
Fei Xiua,
Jiajie Yuana,
Zhigang Zoub and
Wei Huang*ac
aKey Laboratory of Flexible Electronics (KLOFE), Institute of Advanced Materials (IAM), Jiangsu National Synergetic Innovation Center for Advanced Materials (SICAM), Nanjing Tech University (Nanjing Tech), 30 South Puzhu Road, Nanjing 211816, P. R. China. E-mail: iamwjluo@njtech.edu.cn; iamwhuang@njtech.edu.cn
bEco-materials and Renewable Energy Research Center (ERERC), National Laboratory of Solid State Microstructures, Department of Physics, Nanjing University, Nanjing 210093, P. R. China
cKey Laboratory for Organic Electronics & Information Displays (KLOEID), Institute of Advanced Materials (IAM), Nanjing University of Posts and Telecommunications, Wenyuan Road 9, Nanjing 210023, China
First published on 14th June 2017
Abstract
Ta3N5 is a promising photoanode material for solar water splitting due to its suitable band gap and high theoretical solar energy conversion. A high onset potential of Ta3N5 limits its photoelectrochemical performance due to serious surface charge recombination. In a previous study, a TiO2 passivation layer was usually coated on the surface of Ta3N5 to reduce the surface recombination and improve the performance of a sample. However, to date, there are no studies on the effect of conductivity of the TiO2 passivation layer on the photoelectrochemical properties of a Ta3N5 photoanode. In this work, for the first time, the conductivity of TiO2 is increased by post-heating of a TiO2 passivation layer, leading to a 90 mV cathodic shift of the photo-potential of Ta3N5. After further loading with a Ni(OH)x/FeOOH bi-layer electrocatalyst, the Ta3N5 photoanode achieves a current density of 6.4 mA cm−2 at 1.23 VRHE and a HC-STH (half-cell solar to hydrogen efficiency) of 0.72% under a sunlight simulator (100 mW cm−2), which are the highest values among the Ta3N5 photoanodes prepared by thermal oxidation and nitridation of Ta foil.
1. Introduction
Since Fujishima and Honda reported the use of a TiO2 photoanode to split water into H2 and O2 under illumination,1 solar water splitting has become a promising method to convert solar energy into clean and high energy density H2.2,3 In the past forty years, three kinds of photoelectrochemical (PEC) cells, including PV (photovoltaic) + electrolysis, PV + PEC and a p–n tandem cell, have been explored.4–9 In a p–n tandem cell, a n-type semiconductor as a photoanode is ohmically contacted with a p-type semiconductor as a photocathode. A two-photon system is used to split water in a p–n tandem cell and has higher efficiency than that of a conventional single-photon cell. Moreover, no expensive PV cells are used. Therefore, a p–n tandem cell is the most promising one due to its high theoretical efficiency and low cost.10,11Recently, some n-type semiconductors, BiVO4, Fe2O3 and Ta3N5, have been intensively studied as photoanodes.12–15 The band gap of BiVO4 is too wide (2.4 eV), which leads to a low theoretical efficiency (9.1%), even lower than the minimum efficiency (10%) for practical applications.12 Though Fe2O3 has a high theoretical efficiency (16%), most of the samples achieve photocurrent lower than 4 mA cm−2, which leads to an experimental efficiency lower than 5%.16,17 The low efficiency is due to an intrinsic short hole diffusion length caused by a local d-band composition in valence band of Fe2O3.18 In 2002, Ta3N5 was firstly reported as a visible light photocatalyst for water splitting by Domen's group.19 Though Ta3N5 has a similar band gap (2.1 eV) and theoretical photocurrent with Fe2O3, a valence band of Ta3N5 is composed of N2p and has a longer hole diffusion length than that of Fe2O3. Moreover, the bottom of conduction band of Ta3N5 is at −0.3 VRHE, 0.6 V higher than that of Fe2O3, which means a more negative onset potential and a lower bias for photoelectrochemical water oxidation.20,21 Therefore, it is easier for a Ta3N5 photoanode to obtain high efficiency than Fe2O3. In recent years, photocurrent of Ta3N5 has been boosted to a theoretical maximum value.14,22–24 However, an onset potential of a Ta3N5 photoanode (0.6–0.8 VRHE) is still much positive than the theoretical value (−0.3 VRHE) even after coating efficient electrocatalysts on the surface of Ta3N5 to accelerate interface charge transfer.22,25–27 The positive onset potential of a Ta3N5 photoanode mainly originates from poor bulk transport of majority carriers and severe surface carrier recombination.14,28,29 In order to further lower an onset potential, a TiO2 surface passivation layer was coated on the surface of Ta3N5 because TiO2 could reduce surface recombination of photo-generated carriers.30–33 However, to date, there are few studies on effect of conductivity of the TiO2 passivation layer on photoelectrochemical property of a Ta3N5 photoanode.
In this study, we found that the large amount of OH− group exist in an as-deposited TiO2 passivation layer to form TiOx(OH)y, which impeded interface hole transfer and limited a conversion efficiency of Ta3N5. A strategy of post-heating of TiO2 passivation layer was proposed to cathodically shift photo-potential of Ta3N5 by about 90 mV. After post-heating at a low temperature, TiOx(OH)y in the as-deposited passivation layer was dehydrated into TiOx(OH)y−δ, which enhanced the interface hole transfer. Therefore, an onset potential of a Ta3N5 photoanode was cathodically shifted. To the best of our knowledge, it is the first time to shift the onset potential of Ta3N5 by heating a TiO2 passivation layer at a low temperature. This strategy not only deepens understanding the role of a TiO2 passivation layer in a photoelectrochemical cell but also offers reference to improve the performance of other photoelectrodes.
2. Experimental section
2.1 Preparation of Ta3N5 photoanodes
Ta3N5 photoanodes were prepared by modified oxidation and nitridation of Ta foils at a high temperature.14 Ta foils (7 × 16 mm) were firstly rinsed by isopropanol, acetone and ethanol before use, respectively. In order to remove the oxygen-rich surface recombination layer, Ta foils were etched in 5 mL hydrofluoric acid solution (40%) for 225 min at room temperature (25 °C), and then rinsed with distilled water and ethanol. The etched Ta foils were calcined in air at 554 °C for 30 min to obtain Ta2O5 film, followed by a further nitridation treatment under a flow of ammonia gas (800 mL min−1) at 900 °C for 8 h to become Ta3N5. A Ta foil without etching was also calcined in the same conditions as a reference to investigate the etching effect.2.2 Deposition of a TiO2 passivation layer
A TiO2 passivation layer was deposited by CBD method.24 200 μL of titanium trichloride solution (20%) was added into 20 mL of deionized water in ice water bath. A Ta3N5 sample was vertically immersed into the obtained solution, and a TiO2 passivation layer was deposited on the surface of a Ta3N5 sample at 70 °C for 6 min. After washed with distilled water, the TiO2 coated Ta3N5 electrode was calcined in nitrogen atmosphere at different temperatures (100 °C, 150 °C, 200 °C, and 250 °C) for 30 min in a tube furnace. A TiO2 coated Ta3N5 electrode without calcination was also prepared as a reference.2.3 Coating of a Ni(OH)x/FeOOH bi-layer electrocatalyst
A FeOOH layer and a Ni(OH)x layer were deposited on a TiO2 coated Ta3N5 photoelectrode by CBD method and electro-deposition method,24 respectively. A FeOOH layer was deposited in a mixture of 50 mM Fe(NO)3 and 500 mM NaNO3 aqueous solution at 100 °C for 20 min. After washed with distilled water and dried in air, a Ni(OH)x layer was electro-deposited with a potential of −0.85 V vs. saturated calomel electrode (SCE) in 0.1 M NiSO4 aqueous solution at room temperature. The deposition charge was about 12 mC cm−2.2.4 Characterization of samples
The crystal structures of samples were measured by X-ray diffraction patterns (XRD, Bruker D8 ADVANCE diffractometer). The morphologies of samples were observed by field-emission scanning electron microscopy (FE-SEM, Nova NanoSEM 230, FEI). XPS spectra of samples were obtained by using a Thermo ESCALAB 250 machine and the binding energy was calibrated by C1s (284.8 eV).2.5 Photoelectrochemical measurement
The photoelectrochemical properties were conducted in an electrochemical analyzer (CHI-660D, Shanghai Chenhua). A Ta3N5 electrode, SCE and Pt foil were used as the working electrode, reference electrode and counter electrode, respectively. 1 M NaOH (pH = 13.6) aqueous solution was used as electrolyte. A reversible hydrogen electrode (RHE) potential was obtained by the formula:| E(V vs. RHE) = E(V vs. SCE) + 0.242V + 0.059 × pH |
A Xe lamp and AM 1.5G sunlight simulator (100 mW cm−2, Newport oriel 92251A-1000) were used as light sources, respectively. The electrochemical impedance spectra (EIS) of samples were measured by an electrochemical analyzer (Solartron1260 + 1287) with a 10 mV amplitude perturbation and frequencies between 0.1 Hz and 10 MHz. The incident photon-to-current efficiency (IPCE) was measured under irradiation of different wavelengths of light generated by monochromatic filters. A photometer (Newport, 840-C, USA) was used to detect light intensity. The IPCE was calculated as follow:
| IPCE = 1240 × Iph/Pλ |
3. Results and discussion
3.1 Improved efficiency of Ta3N5 by etching a Ta foil precursor with HF solution
In our previous study, a smooth and thin layer of Ta3N5 with high oxygen impurity existed on the surface of an as-prepared sample, which played a role as surface recombination center and lowered the conversion efficiency of Ta3N5. By removing the Ta3N5 surface layer through thermal or mechanical exfoliation method, an efficient Ta3N5 photoanode was obtained.14 In this study, a new surface etching approach was carried out on a Ta foil precursor with HF aqueous solution before oxidation and nitridation. The oxidation temperature was 554 °C, lower than the critical temperature of 590 °C.14 Therefore, no surface thermal exfoliation was observed on the Ta3N5 samples in this study. Fig. 1a and b shows SEM images of Ta3N5 from Ta foil precursor without and with surface etching, respectively. Without surface etching, a smooth surface is observed on the sample. The surface becomes rougher after surface etching of Ta foil precursor and some particles, aggregates and grooves are observed. XRD (see Fig. S1a and Table S1†) and Raman (see Fig. S1b†) results suggest that there are no obvious differences in crystal structures and grain sizes between the two samples before and after etching. XPS indicates the ratio of O/Ta on the surface of Ta3N5 decreases from 0.35 to 0.24 after surface etching of Ta foil precursor (see Fig. 1c). The surface etching of Ta foil precursor with HF solution is a new method to remove an oxygen-rich surface layer. Fig. 1d indicates photoelectrochemical properties of Ta3N5 photoanodes from Ta foils with and without surface etching. After surface etching, the performance of a Ta3N5 photoanode increases remarkably, which comes from the surface oxygen-rich layer removal. The result is in good agreement with our previous study.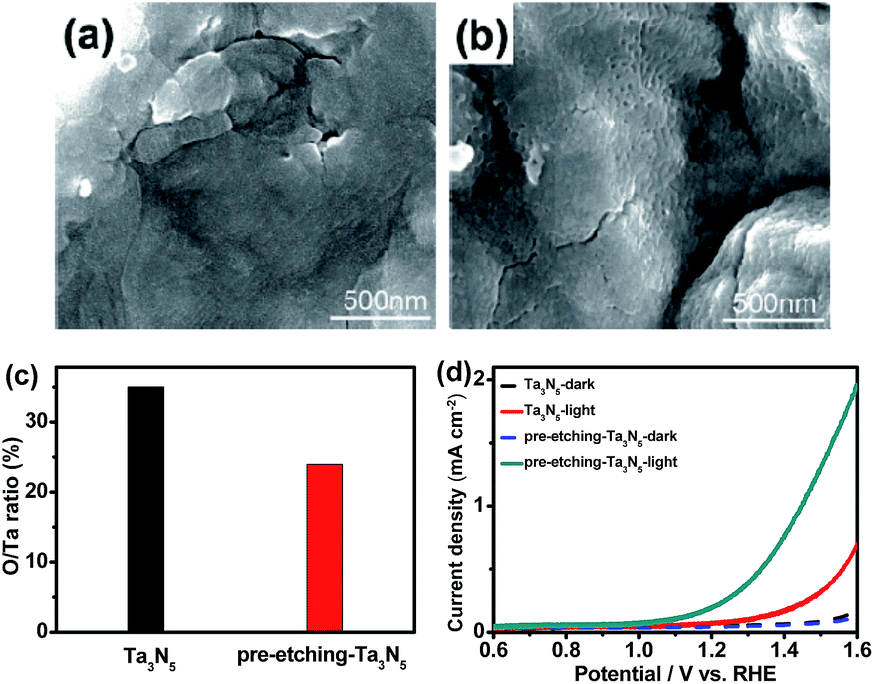 | ||
| Fig. 1 SEM images of Ta3N5 from Ta foil precursor without (a) and with (b) surface etching; (c) O/Ta ratios on the surface of Ta3N5 by XPS from a Ta foil precursor with and without surface etching; (d) current–potential curves of Ta3N5 photoanodes from Ta foil precursor with and without surface etching in 1 M NaOH aqueous solution (pH = 13.6) under xenon lamp irradiation. | ||
3.2 Effect of post-heating a TiO2 passivation layer on a photo-potential of a Ta3N5 photoanode
Efficient Ni(OH)x/FeOOH bilayer electrocatalysts for OER were coated on the surface of Ta3N5 photoanodes to accelerate the water oxidation process, following a previous report.24 In this study, a Ni(OH)x/FeOOH coated Ta3N5 sample is referred as Ta3N5/F/N. In order to further decrease the surface recombination of Ta3N5, post-heating a TiO2 passivation layer in nitrogen atmosphere at different temperatures was carried out. Fig. 2a indicates photoelectrochemical properties of Ta3N5/TiO2/F/N after post-heating TiO2 at different temperatures, and Ta3N5/F/N references without a TiO2 layer before and after calcining at 200 °C. After coating a TiO2 passivation layer, an onset potential of Ta3N5/F/N shifts cathodically, which is in good agreement with previous study.31 However, in previous studies,24,31 no post-treatment of a TiO2 passivation layer was carried out to further improve the performance of a Ta3N5 photoanode. In this study, after post-heating a TiO2 passivation layer in N2 at different temperatures for 30 min, the onset potential of Ta3N5/F/N with a TiO2 passivation layer is cathodically shifted. The optimized post-heating temperature is 200 °C. Compared to the sample post-heating at 200 °C, an onset potential of Ta3N5/TiO2/F/N with post-heating at 250 °C is anodic shifted. An onset potential of Ta3N5/F/N without a TiO2 passivation layer is also anodic shifted after post-heating Ta3N5 in N2 at 200 °C for the same time. The results suggest that the cathodic shift of onset potentials of Ta3N5/F/N with a TiO2 passivation layer after post-heating does not come from post-heating Ta3N5, but the TiO2 passivation layer.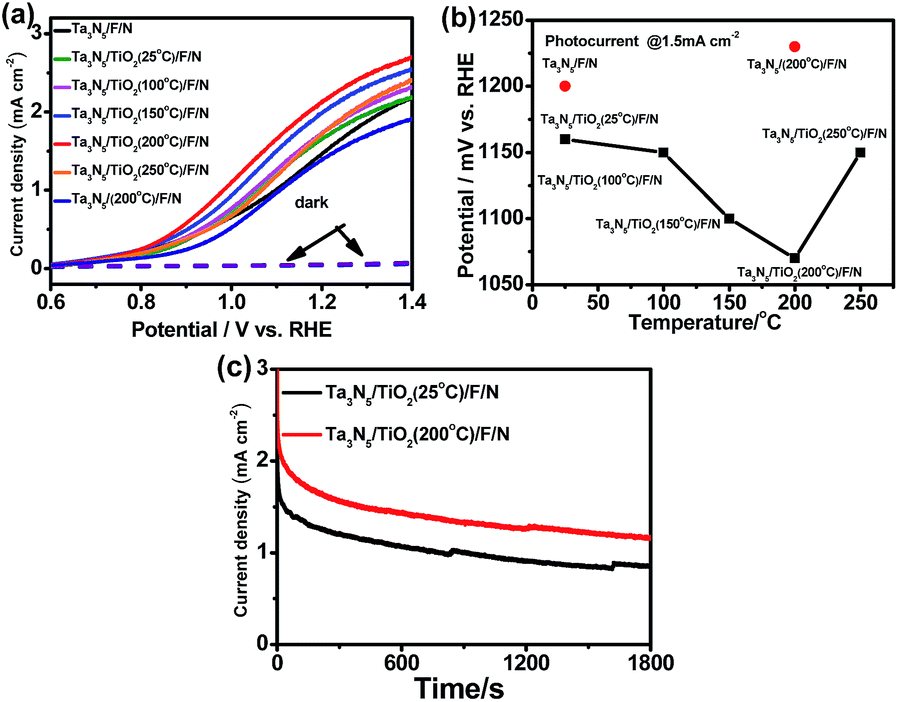 | ||
| Fig. 2 (a) Current–potential curves of Ta3N5/F/N, Ta3N5/TiO2 (25 °C)/F/N, Ta3N5/TiO2 (100 °C)/F/N, Ta3N5/TiO2 (150 °C)/F/N, Ta3N5/TiO2 (200 °C)/F/N, Ta3N5/TiO2 (250 °C)/F/N and Ta3N5 (200 °C)/F/N without TiO2 in 1 M NaOH (pH = 13.6) under 300 W xenon lamp irradiation; (b) photo-potentials@1.5 mA cm−2 of the samples vs. post-heating temperatures; (c) current density–time curves of Ta3N5/TiO2 (25 °C)/F/N and Ta3N5/TiO2 (200 °C)/F/N at 1.23 VRHE under 300 W xenon lamp irradiation. | ||
Fig. 2b shows the photo-potential (@1.5 mA cm−2) of the samples with post-heating TiO2 at different temperatures. After coating a TiO2 passivation layer at room temperature, a photo-potential of a Ta3N5/F/N is cathodically shifted about 40 mV. An photo-potential is further cathodically shifted about 10 mV, 60 mV and 90 mV after post-heating TiO2 passivation layers at 100 °C, 150 °C and 200 °C, respectively. Two kinds of slopes of photo-potential decrease are observed at the post-heating temperature lower and higher than 100 °C, suggesting 100 °C is a critical temperature to activate the TiO2 passivation layer. When the post-heating temperature is increased to 250 °C, a photo-potential is anodically shifted about 50 mV, which comes from decreased performance of a Ta3N5 photoanode after post-heated at such a high temperature. The result suggests that the improved performance of a TiO2 coated Ta3N5 comes from the post-heating treatment of TiO2 but not Ta3N5. Fig. 2c indicates the photo-stability of Ta3N5/TiO2/F/N with and without post-heating TiO2 at 200 °C. Photo-stability of the two samples is similar and the increased photocurrent can be kept during 1800s' illumination, suggesting that the post-heating treatment makes Ta3N5/TiO2/F/N change irreversibly.
3.3 A mechanism for improved performance of a Ta3N5 photoanode by post-heating a TiO2 passivation layer
Fig. 3 indicates surface morphologies of Ta3N5, Ta3N5/TiO2 (25 °C), Ta3N5/TiO2 (200 °C) and Ta3N5/TiO2 (200 °C)/F/N, respectively. Some pores are observed on the surface of Ta3N5, which comes from decreased quantity of anions after nitriding Ta2O5 into Ta3N5.34 No obvious morphology change is observed after coating and post-heating a TiO2 passivation layer at 200 °C, which suggests that the TiO2 layer is very thin (Fig. 3b and c), several nanometer, according to previous study.24 After loading a Ni(OH)x/FeOOH bilayer electrocatalyst, some nanoparticles uniformly distribute on the surface of a Ta3N5 photoanode (see Fig. 3d). X-ray diffraction patterns (XRD) and Raman was also employed to characterize TiO2 on the surface of Ta3N5 samples with post-heating TiO2 at different temperatures (see Fig. S3 and S4†). All the samples show the same XRD and Raman patterns with a bare Ta3N5 sample and no TiO2's signal is observed possibly due to the thin and poor crystalline of a TiO2 layer. | ||
| Fig. 3 Surface SEM images of (a) Ta3N5, (b) Ta3N5/TiO2 (25 °C), (c) Ta3N5/TiO2 (200 °C), (d) Ta3N5/TiO2 (200 °C)/F/N. | ||
Fig. 4a and b show XPS peaks of Ta4f and N1s in TiO2 coated Ta3N5 samples at different post-heating temperatures, respectively. Binding energies of Ta4f (25.2 eV and 27.1 eV) in Fig. 4a are assigned to Ta5+ in a TiO2 coated Ta3N5 without post-heating, which do not shift after post-heating at temperatures of 100 °C, 150 °C and 200 °C. However, the binding energies shift to lower values about 0.1 eV after post-heating at 250 °C. Fig. 4b indicates similar trend of N1s with that in Fig. 4a. The results suggest that the valence state of Ta5+ and N3− in Ta3N5 did not change when post-heating at a temperature lower than 200 °C. However, Ta3N5 is oxidized during post-heating at 250 °C due to residual O2 impurity in N2 carrier gas.35,36 The binding energies of Ti2p (465 eV and 459 eV) in Fig. 4c are assigned to Ti4+,37,38 which shift to lower binding energy as post-heating temperatures increase. The peak shift possibly comes from dehydration of titanium hydroxides into TiOx at high temperatures.38
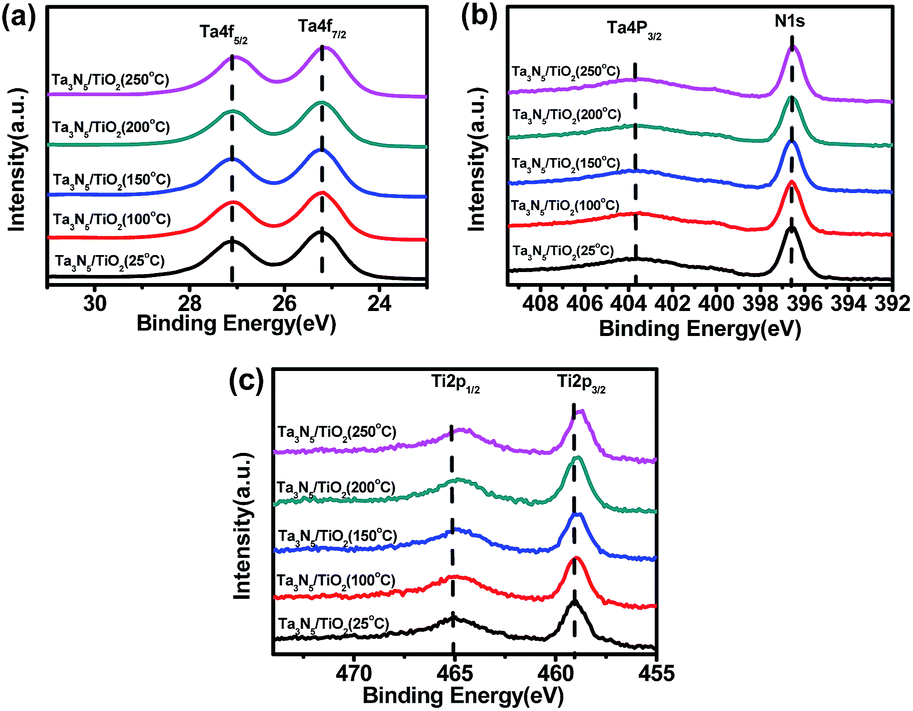 | ||
| Fig. 4 XPS spectra of (a) Ta4f5/2 and Ta4f7/2, (b) Ta4p3/2 and N1s, (c) Ti2p1/2 and Ti2p3/2 of Ta3N5/TiO2 (25 °C), Ta3N5/TiO2 (100 °C), Ta3N5/TiO2 (150 °C), Ta3N5/TiO2 (200 °C), Ta3N5/TiO2 (250 °C). | ||
Fig. 5a shows the XPS spectra of O1s in the Ta3N5/TiO2 at different post-heating temperatures. Three kinds of peaks (530.4 eV, 531.5 eV and 533.5 eV) are used to fit XPS spectra of O1s, which are assigned to lattice O2−, lattice OH− and adsorbed H2O (see Fig. S5†), respectively.39,40 The relative concentrations of these three kinds of oxygen species are calculated from XPS data and the results are shown in Fig. 5b. The ratio of OH− to O2− in the sample without post-heating is 0.83, which does not change obviously after post-heating at 100 °C, and decreases to 0.55 when the calcination temperature is 250 °C (see Fig. 5c). The OH− content of the samples decreases with higher post-heating temperature, due to the dehydration reaction during the post-heating process:41 Ti-OH + HO-Ti → Ti–O–Ti + H2O. Therefore, the post-heating of a TiO2 coated Ta3N5 leads to a reduction of OH− content in the TiO2 passivation layer. However, when the post-heating temperature is lower than 100 °C, no OH− decrease is observed. These results suggest that there is a barrier for the dehydration reaction.
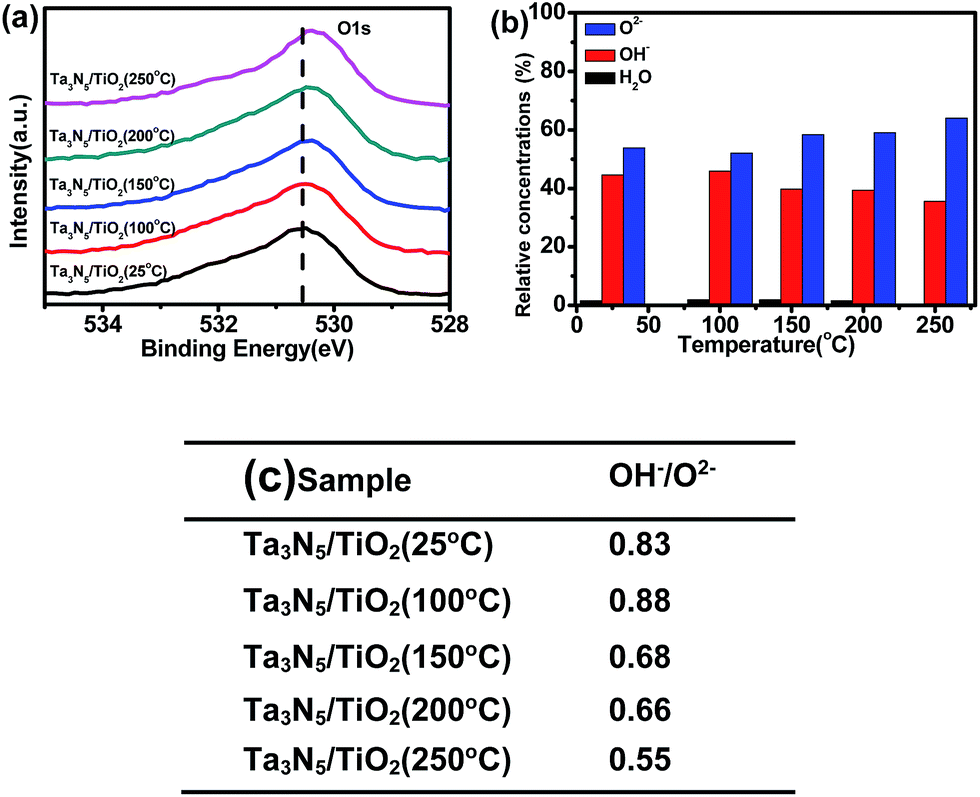 | ||
| Fig. 5 (a) XPS spectra of O1s (b) relative concentrations of adsorbed H2O (dark), lattice OH− (red), lattice O2− (blue) vs. post-heating temperatures and (c) ratio of OH− to O2− on the surface of Ta3N5/TiO2 (25 °C), Ta3N5/TiO2 (100 °C), Ta3N5/TiO2 (150 °C), Ta3N5/TiO2 (200 °C), Ta3N5/TiO2 (250 °C). | ||
In order to understand the effect of post-heating on photo-potential of a TiO2 coated Ta3N5, electrochemical impedance spectroscopy (EIS) measurement of the samples was also carried out and the results are shown in Fig. 6a. An equivalent circuit is plotted in the inset of Fig. 6a. Rct, Rs, and CPE represent a charge transfer resistance in semiconductor–electrolyte interface, an electrolyte resistance and a constant phase element of a double layer, respectively.31 The semicircle of a TiO2 coated Ta3N5 with post-heating at 200 °C is the smallest, indicating a fastest interface charge transfer speed among the five samples. Fig. 6b shows the Rct values of the TiO2 coated Ta3N5 samples with post-heating at different temperatures. There is a positive correlation between the performance of a TiO2 coated Ta3N5 and interface charge transfer. Therefore, reduced OH− content in the TiO2 passivation layer after the post-heating process, which leads to an increase of interface charge transfer and cathodic shift of the photo-potential.
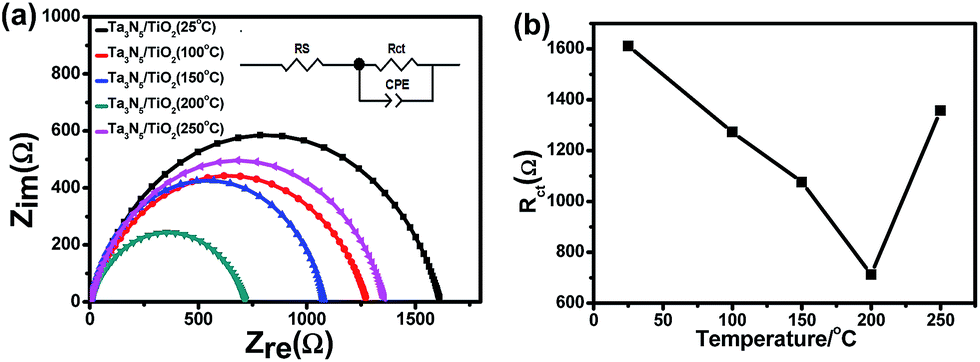 | ||
| Fig. 6 (a) EIS of Ta3N5/TiO2 (25 °C), Ta3N5/TiO2 (100 °C), Ta3N5/TiO2 (150 °C), Ta3N5/TiO2 (200 °C), Ta3N5/TiO2 (250 °C); (b) interface charge transfer resistance Rct vs. post-heating temperatures. | ||
Photocurrent–potential curves of Ta3N5 before and after depositing TiO2 layer in 1 M NaOH with H2O2 as sacrificial reagent were measured and the results are shown in Fig. S6a.† From Fig. S6a,† the photocurrent of Ta3N5 in the solution with sacrificial reagent are similar to the samples after depositing a TiO2 layer and post-heating TiO2 layer, which suggests that charge separation efficiency does not change after depositing the TiO2 layer.15 Therefore, the improved performance of a TiO2 coated Ta3N5 photoanode for water oxidation comes from enhanced interfacial charge transfer efficiency, which is in agreement with previous study.24 Both loading oxygen evolution reaction (OER) catalysts and passivating surface defect states by noncatalysts can enhance interfacial charge transfer efficiency.42 In order to investigate the role of a TiO2 layer, current–potential curves of FTO, FTO/TiO2 and FTO/TiO2 (200 °C) for oxygen evolution reaction are shown in Fig. S6b.† The OER current of FTO decreases after depositing a TiO2 layer, whether post-heating or not. The results suggest that no catalysis effects are observed on the TiO2 layer, which are in good agreement with previous studies.24,32,33 Therefore, the TiO2 layer plays a role as a passivation layer,31,43 which reduces the surface carrier recombination and facilitate interfacial charge transfer.
According to XPS and EIS results, a mechanism of cathodic shift photo-potential after post-heating a TiO2 layer is illustrated in Fig. 7. Before post-heating, holes are generated in the valence band of Ta3N5, which transfer to the TiO2 passivation layer and then to electrocatalysts for water oxidation under illumination. From EIS in Fig. 6, large amount of OH− in the as-deposited TiO2 decreases conductivity of TiO2 and limits hole transfer in the TiO2 passivation layer. After post-heating, OH− content in TiO2 decrease and increase the conductivity of the passivation layer. Therefore, hole transfer in a TiO2 passivation layer is increased after post-heating. However, if the post-heating temperature is too high (250 °C), Ta3N5 can be oxidized and the performance of the samples becomes lower. Therefore, an optimum post-heating temperature is observed.
 | ||
| Fig. 7 Illustration of energy band positions and interface charge transfer in a TiO2 coated Ta3N5 before and after post-heating. | ||
3.4 Performance of a Ta3N5 photoanode with post-heating a TiO2 passivation layer under sunlight simulator illumination
Fig. 8a shows current–potential curves of the Ta3N5/TiO2 (200 °C)/F/N under a standard measurement condition to compare the performance of our sample with previous studies. A photocurrent of 6.4 mA cm−2 at 1.23 VRHE is achieved in the Ta3N5/TiO2 (200 °C)/F/N. The IPCEs at 1.23 VRHE of the samples were measured and the results are shown in Fig. 8b. An integrated photocurrent is calculated as 6.2 mA cm−2 from IPCEs at the standard solar spectrum, which is consistent with the measured value in Fig. 8a. Therefore, the solar photocurrent in Fig. 8a is reliable. A half-cell solar to hydrogen efficiency (HC-STH) is calculated as 0.72% at 1.02 VRHE (Fig. 8c). The photocurrent at 1.23 VRHE and HC-STH are the highest values among Ta3N5 photoanodes prepared by oxidation and nitridation of Ta foils method. The results suggest that post-heating is an effective strategy to obtain efficient TiO2 coated Ta3N5 photoanodes for solar water splitting. | ||
| Fig. 8 (a) A current–potential curve of Ta3N5/TiO2 (200 °C)/F/N photoanode and (b) the corresponding IPCEs at 1.23 VRHE; (c) a half-cell solar to hydrogen efficiency electrolyte: 1 M NaOH (pH = 13.6), light source: AM 1.5G simulated sunlight (100 mW cm−2). | ||
4. Conclusion
In summary, a new etching method was used to remove an oxygen-rich surface layer of Ta3N5 and enhanced the performance of a Ta3N5 photoanode. The conversion efficiency of Ta3N5 was improved by coating a TiO2 passivation layer on the surface. We found that amount of OH− decreased the conductivity of an as-deposited TiO2 layer, which limited the performance of a TiO2 coated Ta3N5. Therefore, a post-heating treatment was proposed to decrease OH− species and increase the conductivity of TiO2, which cathodically shifted the photo-potential of Ta3N5 about 90 mV. After the post-heating, a photocurrent of 6.4 mA cm−2 at 1.23 VRHE and a HC-STH efficiency of 0.72% were obtained in a TiO2 coated Ta3N5 photoanode with Ni(OH)x/FeOOH bilayer electrocatalyst, which are the highest values among Ta3N5 photoanodes prepared by thermal oxidation and nitridation of Ta foils.Acknowledgements
This work is financially supported by the National Basic Research Program of China (973 Program, No. 2015CB932200, 2014CB239303 and 2013CB632404), the Natural Science Foundation of Jiangsu Province of China (No. 15KJB150010 and No. BK20150955), Synergetic Innovation Center for Organic Electronics and Information Displays, the Priority Academic Program Development of Jiangsu Higher Education Institutions (PAPD). Wenjun Luo and Wei Huang acknowledge a Newton Research Collaboration Programme Type 2 Award (No. NRCP/1415/264).Notes and references
- A. Fujishima and K. Honda, Nature, 1972, 238, 37–38 CrossRef CAS PubMed.
- M. Gratzel, Nature, 2001, 414, 338–344 CrossRef CAS PubMed.
- M. G. Walter, E. L. Warren, J. R. McKone, S. W. Boettcher, Q. Mi, E. A. Santori and N. S. Lewis, Chem. Rev., 2010, 110, 6446–6473 CrossRef CAS PubMed.
- O. Khaselev, A. Bansal and J. A. Turner, Int. J. Hydrogen Energy, 2001, 26, 127–132 CrossRef CAS.
- M. C. Hanna and A. J. Nozik, J. Appl. Phys., 2006, 100, 074510 CrossRef.
- O. Khaselev and J. A. Turner, Science, 1998, 280, 425–427 CrossRef CAS PubMed.
- K. Ohashi, J. McCann and J. O. M. Bockris, Nature, 1977, 266, 610–611 CrossRef CAS.
- J. Akikusa and S. U. M. Khan, Int. J. Hydrogen Energy, 2002, 27, 863–870 CrossRef CAS.
- A. J. Nozik, Appl. Phys. Lett., 1976, 29, 150–153 CrossRef CAS.
- L. Fornarini, A. J. Nozik and B. A. Parkinson, J. Phys. Chem., 1984, 88, 3238–3243 CrossRef CAS.
- M. S. Prévot and K. Sivula, J. Phys. Chem. C, 2013, 117, 17879–17893 Search PubMed.
- W. Luo, Z. Yang, Z. Li, J. Zhang, J. Liu, Z. Zhao, Z. Wang, S. Yan, T. Yu and Z. Zou, Energy Environ. Sci., 2011, 4, 4046–4051 CAS.
- D. P. Cao, W. J. Luo, J. Y. Feng, X. Zhao, Z. S. Li and Z. G. Zou, Energy Environ. Sci., 2014, 7, 752–759 CAS.
- M. Li, W. Luo, D. Cao, X. Zhao, Z. Li, T. Yu and Z. Zou, Angew. Chem., Int. Ed., 2013, 52, 11016–11020 CrossRef CAS PubMed.
- Z. Li, W. Luo, M. Zhang, J. Feng and Z. Zou, Energy Environ. Sci., 2013, 6, 347–370 CAS.
- S. D. Tilley, M. Cornuz, K. Sivula and M. Graetzel, Angew. Chem., Int. Ed., 2010, 49, 6405–6408 CrossRef CAS PubMed.
- S. C. Warren, K. Voitchovsky, H. Dotan, C. M. Leroy, M. Cornuz, F. Stellacci, C. Hebert, A. Rothschild and M. Graetzel, Nat. Mater., 2013, 12, 842–849 CrossRef CAS PubMed.
- M. N. Huda, A. Walsh, Y. Yan, S.-H. Wei and M. M. Al-Jassim, J. Appl. Phys., 2010, 107, 123712 CrossRef.
- G. Hitoki, A. Ishikawa, T. Takata, J. N. Kondo, M. Hara and K. Domen, Chem. Lett., 2002, 7, 736–737 CrossRef.
- C. M. Fang, E. Orhan, G. A. de Wijs, H. T. Hintzen, R. A. de Groot, R. Marchand, J. Y. Saillard and G. de With, J. Mater. Chem., 2001, 11, 1248–1252 RSC.
- W. J. Chun, A. Ishikawa, H. Fujisawa, T. Takata, J. N. Kondo, M. Hara, M. Kawai, Y. Matsumoto and K. Domen, J. Phys. Chem. B, 2003, 107, 1798–1803 CrossRef CAS.
- Y. Li, L. Zhang, A. Torres-Pardo, J. M. Gonzalez-Calbet, Y. Ma, P. Oleynikov, O. Terasaki, S. Asahina, M. Shima, D. Cha, L. Zhao, K. Takanabe, J. Kubota and K. Domen, Nat. Commun., 2013, 4, 2566 Search PubMed.
- L. Wang, X. Zhou, N. T. Nguyen, I. Hwang and P. Schmuki, Adv. Mater., 2016, 28, 2432–2438 CrossRef CAS PubMed.
- G. Liu, S. Ye, P. Yan, F. Xiong, P. Fu, Z. Wang, Z. Chen, J. Shi and C. Li, Energy Environ. Sci., 2016, 9, 1327–1334 CAS.
- M. Liao, J. Feng, W. Luo, Z. Wang, J. Zhang, Z. Li, T. Yu and Z. Zou, Adv. Funct. Mater., 2012, 22, 3066–3074 CrossRef CAS.
- G. Liu, J. Shi, F. Zhang, Z. Chen, J. Han, C. Ding, S. Chen, Z. Wang, H. Han and C. Li, Angew. Chem., Int. Ed., 2014, 53, 7295–7299 CrossRef CAS PubMed.
- L. Wang, F. Dionigi, N. Nhat Truong, R. Kirchgeorg, M. Gliech, S. Grigorescu, P. Strasser and P. Schmuki, Chem. Mater., 2015, 27, 2360–2366 CrossRef CAS.
- C. Wang, T. Hisatomi, T. Minegishi, M. Nakabayashi, N. Shibata, M. Katayama and K. Domen, J. Mater. Chem. A, 2016, 4, 13837–13843 CAS.
- E. Nurlaela, S. Ould-Chikh, M. Harb, S. del Gobbo, M. Aouine, E. Puzenat, P. Sautet, K. Domen, J.-M. Basset and K. Takanabe, Chem. Mater., 2014, 26, 4812–4825 CrossRef CAS.
- S. Hu, M. R. Shaner, J. A. Beardslee, M. Lichterman, B. S. Brunschwig and N. S. Lewis, Science, 2014, 344, 1005–1009 CrossRef CAS PubMed.
- P. Zhang, T. Wang and J. Gong, Chem. Commun., 2016, 52, 8806–8809 RSC.
- X. Yang, R. Liu, C. Du, P. Dai, Z. Zheng and D. Wang, ACS Appl. Mater. Interfaces, 2014, 6, 12005–12011 CAS.
- M. G. Ahmed, I. E. Kretschmer, T. A. Kandiel, A. Y. Ahmed, F. A. Rashwan and D. W. Bahnemann, ACS Appl. Mater. Interfaces, 2015, 7, 24053–24062 CAS.
- B. A. Pinaud, P. C. K. Vesborg and T. F. Jaramillo, J. Phys. Chem. C, 2012, 116, 15918–15924 CAS.
- A. Ishikawa, T. Takata, J. N. Kondo, M. Hara and K. Domen, J. Phys. Chem. B, 2004, 108, 11049–11053 CrossRef CAS.
- D. Yokoyama, H. Hashiguchi, K. Maeda, T. Minegishi, T. Takata, R. Abe, J. Kubota and K. Domen, Thin Solid Films, 2011, 519, 2087–2092 CrossRef CAS.
- J. Yao, H. Shao, H. He and Z. Fan, Appl. Surf. Sci., 2007, 253, 8911–8914 CrossRef CAS.
- K. H. Wong, C. W. Mason, S. Devaraj, J. Ouyang and P. Balaya, ACS Appl. Mater. Interfaces, 2014, 6, 2679–2685 CAS.
- H. Perron, J. Vandenborre, C. Domain, R. Drot, J. Roques, E. Simoni, J. J. Ehrhardt and H. Catalette, Surf. Sci., 2007, 601, 518–527 CrossRef CAS.
- N. Kruse and S. Chenakin, Appl. Catal., A, 2011, 391, 367–376 CrossRef CAS.
- J. G. Yu, H. G. Yu, B. Cheng, X. J. Zhao, J. C. Yu and W. K. Ho, J. Phys. Chem. B, 2003, 107, 13871–13879 CrossRef CAS.
- R. Liu, Z. Zheng, J. Spurgeon and X. Yang, Energy Environ. Sci., 2014, 7, 2504–2517 CAS.
- X. Li, P. S. Bassi, P. P. Boix, Y. Fang and L. H. Wong, ACS Appl. Mater. Interfaces, 2015, 7, 16960–16966 CAS.
Footnote |
| † Electronic supplementary information (ESI) available. See DOI: 10.1039/c7ra04647b |
| This journal is © The Royal Society of Chemistry 2017 |