
 Open Access Article
 This Open Access Article is licensed under a
 Creative Commons Attribution 3.0 Unported Licence
Pollen derived blue fluorescent carbon dots for bioimaging and monitoring of nitrogen, phosphorus and potassium uptake in Brassica parachinensis L.†
Yinjian Zhengab,
Haoran Zhanga,
Wei Lia,
Yingliang Liu a,
Xuejie Zhanga,
Houcheng Liu*b and
Bingfu Lei*ab
a,
Xuejie Zhanga,
Houcheng Liu*b and
Bingfu Lei*ab
aGuangdong Provincial Engineering Technology Research Center for Optical Agriculture, College of Materials and Energy, South China Agricultural University, Guangzhou 510642, China. E-mail: tleibf@scau.edu.cn
bCollege of Horticulture, South China Agricultural University, Guangzhou 510642, China
First published on 3rd July 2017
Abstract
Carbon dots (CDs), synthesized from biological sources, have attracted attention in bioimaging and bioscience due to their low cytotoxicity, water-soluble nature, and biocompatibility. However, there are a few reports on the absorption of elements and tracking the transporting systems in plants. Herein, we report pollen-CDs synthesized by a hydrothermal method that emit blue light under excitation of UV light, which can be used to track the absorption of nitrogen, phosphorus, and potassium, and mark the biological transport systems in Brassica parachinensis L. The pollen-CDs were transported via the vascular system of Brassica parachinensis L., confirmed by the confocal images. TEM results demonstrated that the pollen-CDs were enriched in the periplasmic space, which helps to enhance the absorption efficiency of potassium and inhibit the accumulation of nitrates in Brassica parachinensis L. The hydroponic experiment results demonstrated that Brassica parachinensis L. had the highest yield of 42.90 mg when 3.5 mg L−1 pollen-CDs were added to the nutrient solution. All the results demonstrated that the pollen-CDs have potential for application in hydroponically grown vegetables and biocompatible studies in vitro/in vivo imaging.
Introduction
Exploring the interactions between nanoparticles (NPs) and plant response is crucial in horticultural science because the processes of nanoparticles' uptake, localization, and activity in plants could revolutionize crop production.1 CDs with the sizes below 10 nm may be taken up easily by plants and transported within plant tissues. It has been reported that carbon nanotubes (CNTs) can penetrate the thick seed coat and support water uptake inside seeds, which can affect seed germination rate and growth of tomato seedlings.2 As an example, multi walled carbon nanotubes (MWCNTs) (5–500 μg mL−1) can up-regulate the expression of the CycB (cell division) and NtLRX1 (cell wall extension) genes and enhance the growth of tobacco cell culture.3,4 Oxidized MWCNTs can accelerate root growth and increase wheat (cv. Triticum aestivum) biomass, but there is no significant effect on seed germination or stem length.5 Treating gram (cv. Cicer arietinum) with 6.0 μg mL−1 of water soluble CNTs showed an evident increase in the weight of the roots and shoots. All these conclusions demonstrate that water soluble CNTs can improve absorption and retention of water, and therefore enhance the growth.6 MWCNTs, Fe-filled CNTs, and Fe–Co-filled CNTs significantly inhibit rice growth by decreasing the concentrations of endogenous plant hormones and change the ratio of C![[thin space (1/6-em)]](https://www.rsc.org/images/entities/char_2009.gif) :N in the roots of rice.7
:N in the roots of rice.7
Bee pollen, a mass of pollen gathered by honeybees, has been favorably consumed as diet supplementation due to its good nutrition and therapeutic values, such as proximate contents, amino acid composition, dietary fiber, mineral elements, and fatty acid composition.8 It has been reported that CDs can be easily prepared from bee pollen via a highly reproducible one-step hydrothermal carbonization process, yielding pollen of relatively high content of nitrogen, good water solubility, and small size of about 2 nm. As is known, the transportation of molecules into plant cells is quite complicated because of the plant cell wall and cell membrane.9 Molecule size is among the key factors for nanomaterials utilized in plant. Compared with other semiconductor quantum dots, pollens-CDs are superior due to their merits including small size, non-toxicity, biocompatibility, and tunable emissions upon varied excitation.10 The flowering Chinese cabbage (Brassica parachinensis L.) is an important leafy vegetable of Southeast Asia. It is rich in flavones, anthocyanins, vitamins, glucosinolates, folic acid and so on11 and has been abundantly exported to Europe, America, Australia and other regions.12 However, to date, there are no reports about the uptake of nanoparticles within the Brassica parachinensis L.
As mentioned above, the agronomic application of nanotechnology in plants has the potential to enhance plant production and use them as bioimaging probes. However, some studies are not discussed in-depth. The application of CNTs in agriculture can increase plant production and affect seed germination rate, but there is no fluorescent probe for tracking the transport system to explain the mechanisms that affect crop absorption elements. Metallic oxides, such as nano-TiO2 and ZnO, can increase photophosphorylation activity, and CdSe/ZnS quantum dots can be used as optical imaging probes in vivo. However, they have great toxicity to the organisms and also negatively impact the environment. In this study, CDs derived from pollen with blue fluorescence were first used in hydroponic Brassica parachinensis L. for studying the mechanisms of increasing yield and promoting the absorbance efficiency of nutrients. Moreover, this pollen-CDs with fluorescence characteristics can also be used to track the progress of nutrient uptake and transportation, and mark the nutrient content in the nutrient solution via a visual measurement technique.
Results and discussion
To obtain structural information about the CDs, we performed Fourier transform infrared (FT-IR) measurements (Fig. 1a). The typical peaks at 1662 cm−1, 2976 cm−1 and 3405 cm−1 correspond to the stretching vibrations of C![[double bond, length as m-dash]](https://www.rsc.org/images/entities/char_e001.gif) O, C–H, O–H and N–H, respectively, while those at 1052 cm−1 and 1400 cm−1 can be attributed to the bending vibrations of C–N–C and N–H, respectively.21,22 These results demonstrate the presence of carboxyl, hydroxyl and amino groups embedded in the CDs. The powder X-ray diffraction (XRD) pattern shows a broad band peak at 21°, which can be ascribed to the (002) plane of graphitic interlayer spacing of 0.32 nm (Fig. 1b), indicating that the as-synthesized CDs retain their amorphous nature.23 The pollen-CDs exhibit a broadband blue emission under different excitation wavelengths (320 nm, 340 nm and 360 nm, Fig. 1c), displayed in the photograph inset in Fig. 1c. The individual X-ray photoelectron spectroscopy (XPS) results showing C 1s, N 1s and O 1s binding energies (Fig. 1d and S6†) revealed that three types of carbon (C–C, C–O/C–N, and CO), two types of nitrogen (C–N–C and N–H) and two types of oxygen (CO and C–O) existed in the CDs. The difference is that the emission band shows a tiny red shift, attributed to the characteristic photoluminescence properties of CDs that depend on the excitation wavelengths. The excitation spectrum exhibits a broad band centered at 350 nm, demonstrating that pollen-CDs can be effectively excited by UV light. The quantum efficiency (QE) of pollen-CDs was determined to be 7.7% under 360 nm excitation, using quinine sulfate as the reference.24 The morphology and size of the pollens-CDs were also simultaneously determined by transmission electron microscopy (TEM) and atomic force microscopy (AFM), respectively. The CDs were uniform without precipitation, and the size distribution histogram shows that the average diameter of the particles is 2.01 nm (Fig. 1e). The AFM topography image (Fig. 1g) of the mica substrate showing the particle heights further confirmed the mean size of 2.00 nm, as presented in a spherical shape, which is also consistent with a previous report.10
O, C–H, O–H and N–H, respectively, while those at 1052 cm−1 and 1400 cm−1 can be attributed to the bending vibrations of C–N–C and N–H, respectively.21,22 These results demonstrate the presence of carboxyl, hydroxyl and amino groups embedded in the CDs. The powder X-ray diffraction (XRD) pattern shows a broad band peak at 21°, which can be ascribed to the (002) plane of graphitic interlayer spacing of 0.32 nm (Fig. 1b), indicating that the as-synthesized CDs retain their amorphous nature.23 The pollen-CDs exhibit a broadband blue emission under different excitation wavelengths (320 nm, 340 nm and 360 nm, Fig. 1c), displayed in the photograph inset in Fig. 1c. The individual X-ray photoelectron spectroscopy (XPS) results showing C 1s, N 1s and O 1s binding energies (Fig. 1d and S6†) revealed that three types of carbon (C–C, C–O/C–N, and CO), two types of nitrogen (C–N–C and N–H) and two types of oxygen (CO and C–O) existed in the CDs. The difference is that the emission band shows a tiny red shift, attributed to the characteristic photoluminescence properties of CDs that depend on the excitation wavelengths. The excitation spectrum exhibits a broad band centered at 350 nm, demonstrating that pollen-CDs can be effectively excited by UV light. The quantum efficiency (QE) of pollen-CDs was determined to be 7.7% under 360 nm excitation, using quinine sulfate as the reference.24 The morphology and size of the pollens-CDs were also simultaneously determined by transmission electron microscopy (TEM) and atomic force microscopy (AFM), respectively. The CDs were uniform without precipitation, and the size distribution histogram shows that the average diameter of the particles is 2.01 nm (Fig. 1e). The AFM topography image (Fig. 1g) of the mica substrate showing the particle heights further confirmed the mean size of 2.00 nm, as presented in a spherical shape, which is also consistent with a previous report.10
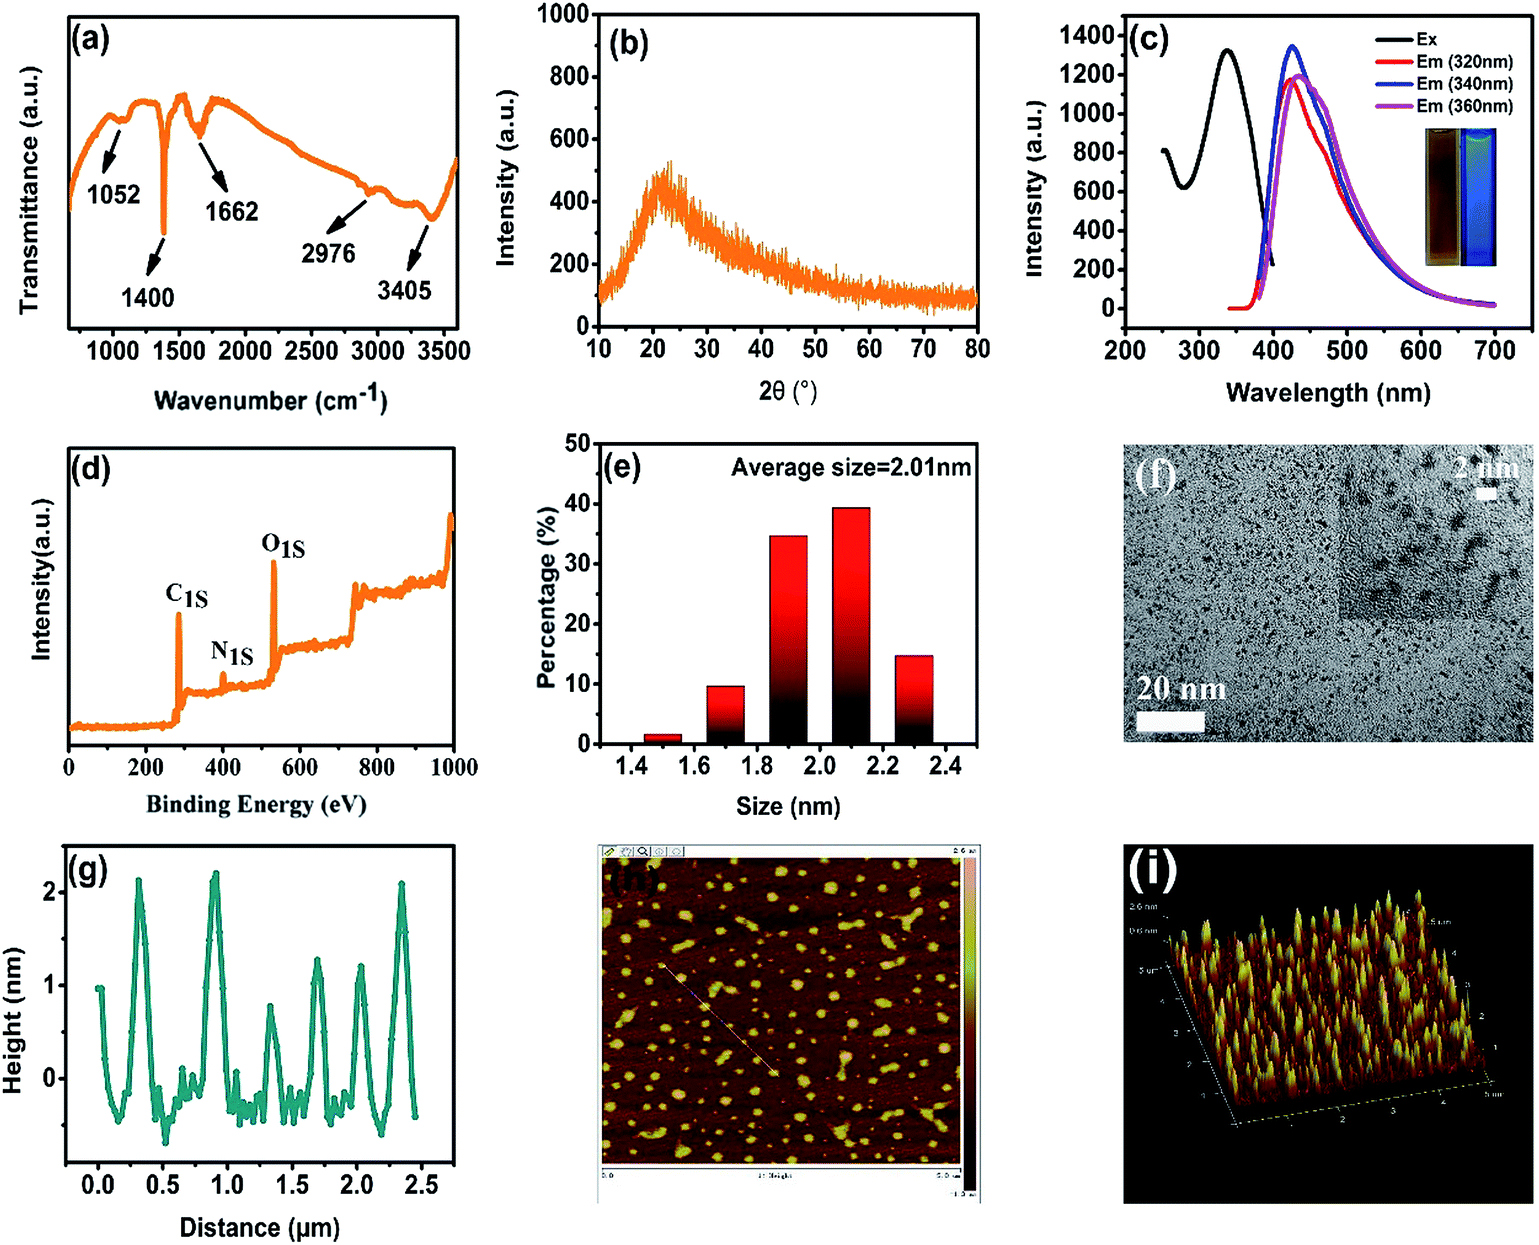 | ||
| Fig. 1 FT-IR spectra (a) and XRD of CDs (b). Wavelength-dependent fluorescent emission spectra of CDs excited at 320, 340, and 360 nm, respectively, and excitation spectrum of CDs monitored at 388 nm. Inset shows the digital photographs taken under daylight and UV (365 nm) irradiation, respectively (c). XPS of CDs (d). Particle size distribution of CDs (e). TEM images of CDs in large scale and small scale (f). AFM of CDs (g). 2D AFM topography image (h). 3D AFM topography image (i). | ||
To study the phytotoxicity and physiological function of pollen-CDs during the hydroponic growth of Brassica parachinensis L., the biomass, chlorophyll content and element absorption were investigated. The biomass of pollen-CDs treated Brassica parachinensis L. was measured by fresh weight (FW) and dry weight (DW). As shown in Fig. 2 and Table 1, the T2 had the highest yield in the CDs cultivated plants and also exhibited the highest fluorescence under UV-light. The fresh weights of the shoots of the CDs treated Brassica parachinensis L. were much higher than those of the ones treated with CK (for which the added CDs concentration was 0 mg L−1), the former exhibiting an increase of 17.37% (T1, the added CDs concentration was 7 mg L−1), 69.36% (T2, the added CDs concentration was 3.5 mg L−1), and 36.32% (T3, the added CDs concentration was 1.75 mg L−1). Moreover, the FW of roots increased by 4.95%, 66.12%, and 29.50%. The DW of Brassica parachinensis L. showed the same trend (Table 1). Among the plants cultivated in the Hoagland nutrient treated by CDs, the yield of T2 was higher than that of T1 and T3, which may be attributed to its higher concentration of CDs (T1), which inhibited the growth of Brassica parachinensis L. The concentration of CDs in T3 was too low to effectively increase the yield. Hence, from our study, it can be seen that the concentration of pollen-CDs can significantly affect the yield of Brassica parachinensis L. Nitrogen, the nutrient element analyzed in our study, is the most highly absorbed nutrient that is taken up by the plants from the soil.25 Its state (ionic charge and oxidation state) has an effect on the metabolism and finally affects the growth and competitive ability of the plant.26 Ammonium is the predominant form in which nitrogen is absorbed and accumulated in plants.27 As mentioned above, there are two types of nitrogen (C–N–C and N–H) on the surfaces of CDs (Fig. 1a), namely, CDs untaken into by plant stay in cytoplasmic space (Fig. 4 and 5b) and the nitrogen of the nutrient solution (Fig. S3a and b†). The decrease in the latter nitrogen indicates that the absorption and accumulation of nitrogen has improved, favoring the increased mass of Brassica parachinensis L. The effect of CDs on the chlorophyll contents in Brassica parachinensis L. was also determined (Fig. 3). Compared with CK, there was a significant increase in the content of chlorophyll a in T1, T2 and T3, showing an increase of 32.35%, 26.47% and 13.24%, respectively. There was no significant difference in the contents of chlorophyll b of T1 and T2, which were 26.92% and 23.08% higher than those of CK, respectively. The total chlorophyll content exhibits the same change trend as that of chlorophyll b. There was no significant difference in carotenoid contents of Brassica parachinensis L. In previous studies of heterotrophic bacteria, electrons donated to the environment were found to be derived from the oxidation of organic molecules through respiratory metabolism.28,29 According to FT-IR spectra, the CDs have three types of carbon (C–C, C–O/C–N, and CO), two types of nitrogen (C–N–C and N–H), and two types of oxygen (CO and C–O) (Fig. 1a). However, photosynthesis is a complex reaction in the plant body, which has a variety of substrates and participates in various metabolic pathways. Hence, we infer that these groups can affect the chlorophyll contents, and might be derived from photosynthetic electron transport. Carotenoids can provide protection when plants are over-exposed to light through dissipation of excess energy and free radical detoxification.30,31 Our results showed that there was no significant difference in carotenoid contents due to the lower phytotoxicity of pollen-derived CDs in the photosynthesis of Brassica parachinensis L.
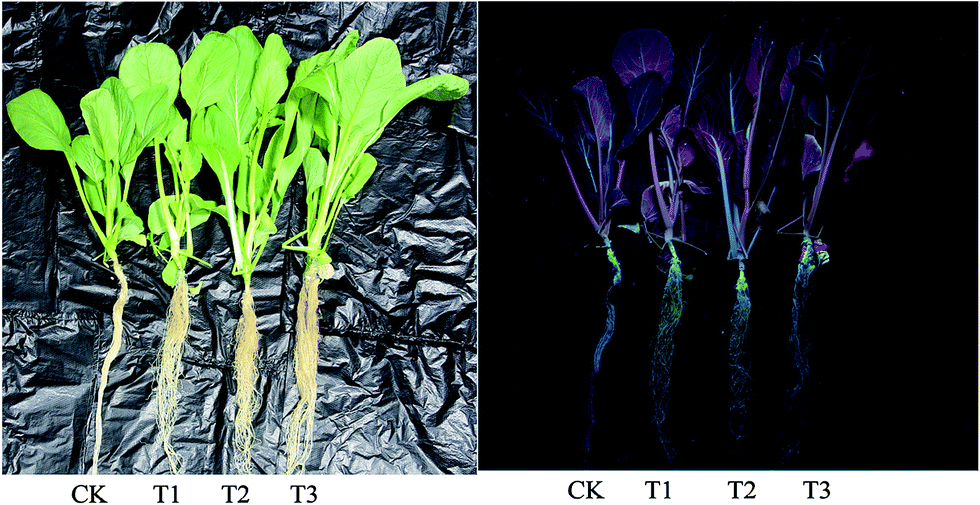 | ||
| Fig. 2 The images of Brassica parachinensis L. under daylight and UV light, respectively. | ||
| Treatment | Fresh weight | Dry weight | ||
|---|---|---|---|---|
| Shoot (g) | Root (g) | Shoot (g) | Root (g) | |
| a The values presented are the means ± SE. Different letters indicate significant differences between treatments (a < 0.05). | ||||
| CK | 25.33 ± 1.21 d | 5.46 ± 1.26 c | 1.83 ± 0.06 c | 0.53 ± 0.06 a |
| T1 | 29.73 ± 0.51 c | 5.73 ± 0.11 c | 2.03 ± 0.12 c | 0.53 ± 0.06 a |
| T2 | 42.90 ± 2.53 a | 9.07 ± 0.45 a | 3.17 ± 0.12 a | 0.63 ± 0.06 a |
| T3 | 34.53 ± 2.75 b | 7.20 ± 0.17 b | 2.37 ± 0.31 b | 0.53 ± 0.06 a |
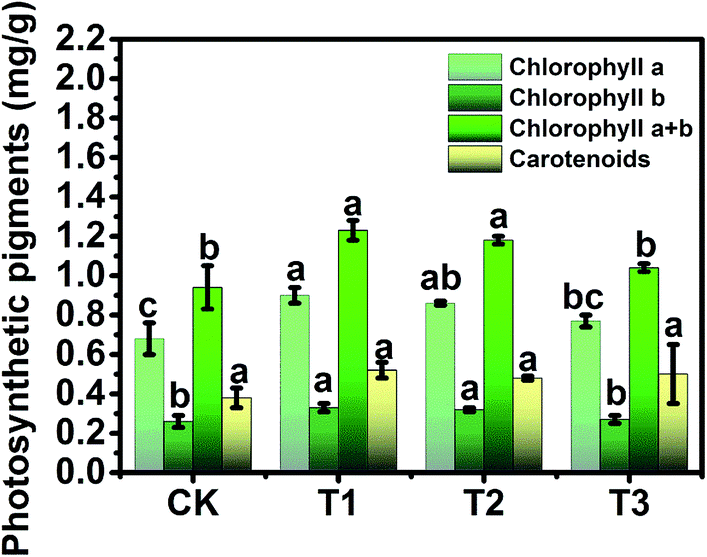 | ||
| Fig. 3 The chlorophyll content of supplementary CDs concentration on Brassica parachinensis L., the values presented are the means ± SE. Different letters indicate significant differences between treatments (a < 0.05). | ||
Another interesting result is that pollen-CDs can evidently affect the efficiency of photosynthesis (Fig. 3) and the content of soluble sugars (Fig. S1a†) of Brassica parachinensis L. This result can be explained by the fact that the pollen-CDs affected the photosynthetic rate through an effect on RuBP regeneration rather than RuBP case activity and changed the Calvin cycle enzymes with three types of carbon, increasing the flow of carbon to starch. The photosynthetic capacity of the leaves is mainly related to the nitrogen content because the protein of the Calvin cycle and thylakoids represents the majority of leaf nitrogen.32 Soluble sugars are the product of photosynthesis.33 T1 had the highest chlorophyll contents and the lowest content of soluble protein (Fig. S1b†), while T2 had the highest content of soluble sugars (Fig. S1a†) and FW (Table 1), as well as the lowest content of nitrate nitrogen (Fig. S1c†). The content of the soluble protein of T2 was not significantly different compared with that of CK (Fig. S1b†). These results of enhancing the accumulation of nitrate nitrogen (T1, Fig. S1c†) and increasing the soluble sugars content (T2) logically explains why pollen-CDs can improve the photosynthetic rate, which indicates that three types of carbon and two types of nitrogen components on the surface of CDs can improve photosynthesis and affect the accumulation of energy for plant growth.
The relationship between the application of pollen-CDs to hydroponic Brassica parachinensis L. and the absorption of nitrogen, phosphorus and potassium was analyzed and presented in the ESI (Fig. S2).† In plants, the uptake of one K+ is energized by the co-uptake of one proton.34 Higher plant cells show more evident discrimination of K+ transports across the cytoplasmic membrane of water via.35 In this study, pollen-CDs treated plants showed an increase in the contents of potassium, with T2 having higher potassium content than the others (Fig. S2c†), indicating that pollen-CDs affects cell plant membrane permeability. As proven by the accumulation and transport mechanism of K+ in Brassica parachinensis L. because K+ transport via is equal to water via. Malondialdehyde (MDA) is widely used as a marker of oxidative lipid injury, as its concentration varies in response to biotic and abiotic stress.36 This stress derived from the unsaturated lipids of plant membranes is one of the primary targets of such oxidative reactions.37 From Fig. S1d,† CDs treatment resulted in significantly higher contents of MDA compared to CK treatment. This further supports the conclusion that the pollen-CDs can affect the cytomembrane of Brassica parachinensis L., but exhibit no effect on the absorption of the element (Fig. S2 and S3†) and physiological metabolism (Fig. 3 and S1†), which means that pollen-CDs have lower phytotoxicity in plants.
From the above analysis, it is reasonable to conclude that the addition of pollen-CDs is effective for hydroponic growth of Brassica parachinensis L. Herein, we chose T2 as the example due to the fact that it has significant difference compared to CK in tracking the element transporting system in Brassica parachinensis L. through the characteristic fluorescence of pollen-CDs. After 20 days' treatment, the Brassica parachinensis L. grew rapidly. The nutrient solution was investigated about every three days by measuring ammonium nitrogen, nitrate nitrogen, phosphorus, potassium and fluorescence before harvesting the plants (Fig. S3†). The content of nitrogen, phosphorus, and potassium in the nutrient solution showed a decreasing tendency (Fig. S3†), which indicates that they were absorbed and transformed to plant mass (as confirmed in Table 1). Moreover, the PL intensity in the nutrient solution exhibited the same trend, indicating that the pollen-CDs were absorbed by Brassica parachinensis L. (Fig. S4†). It is reported that plant cell surface is removed enzymatically together with certain cell surface proteins.38 Therefore, from Fig. 4 and 5b, it can be concluded that the pollen-CDs do not penetrate into the cells. However, the surface function group of the CDs can increase the absorption efficiency of potassium because the level of accumulation of nitrate in the plants decreases (Fig. S1 and S2†). Moreover, the CDs can improve ammonium nitrogen absorption (Fig. S1c, S3a and b†) and finally increase the yield of the plant.
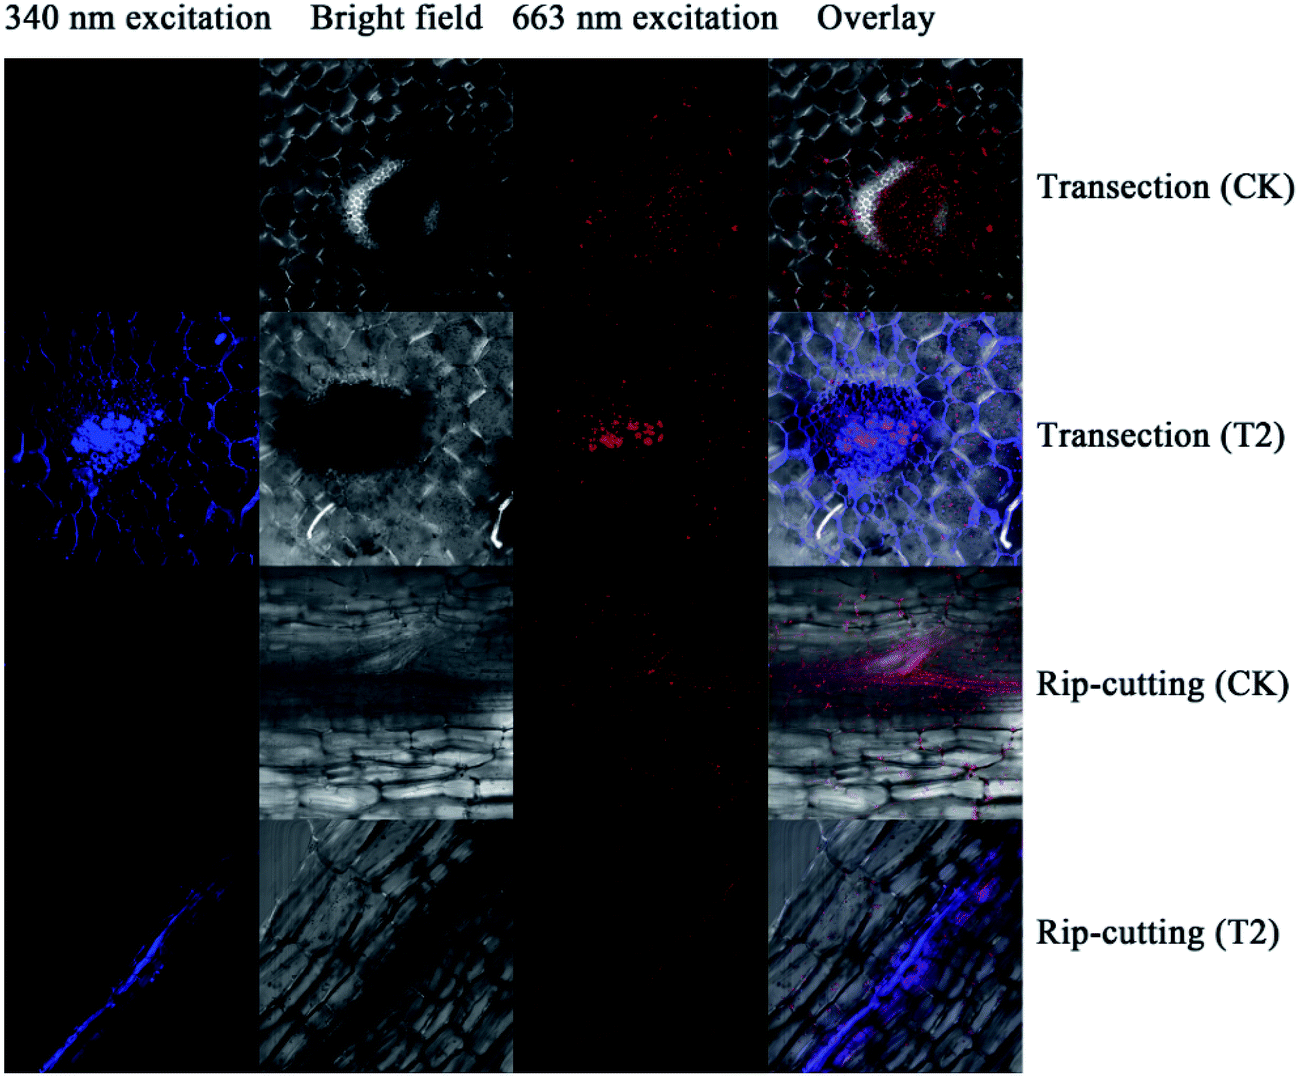 | ||
| Fig. 4 The images of laser scanning confocal microscope in the petiole of Brassica parachinensis L. | ||
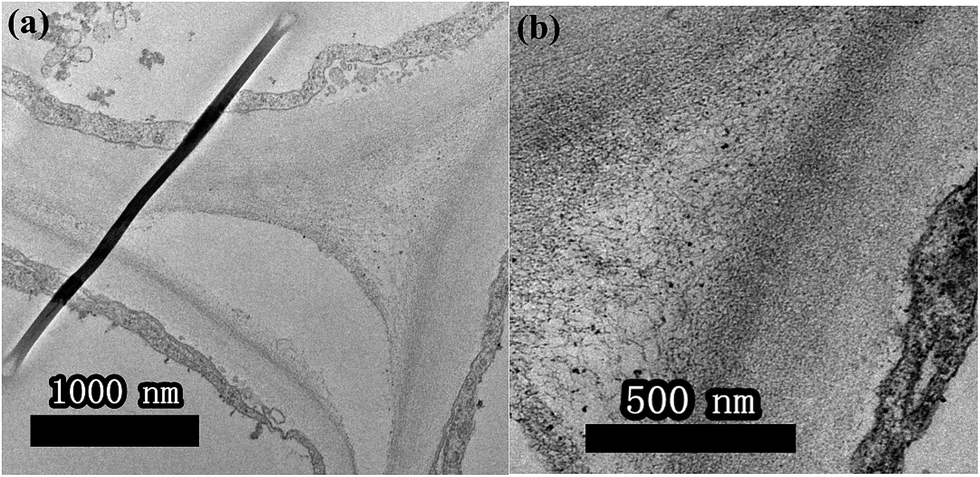 | ||
| Fig. 5 TEM images of the petiole of Brassica parachinensis L. in CK (a) and CDs (b). | ||
As shown in Fig. 4, the pollen-CDs show effective emission under 340 nm excitation. Herein, we wanted to use the PL of chlorophyll pigments to locate the CDs position. The pollen-CDs, with high fluorescence, were selected as a better candidate and used as a probe for cell imaging using laser scanning confocal microscopy. Slices in the organs of Brassica parachinensis L. were made and checked (roots, stems, leaves), and the results indicated that pollen-CDs were transported from root to leaf by plant conduits (Fig. S5†), which diffused via the protoplast pathway. To ensure the located position of CDs, TEM images of two biological samples (CK, T2) were measured and (Fig. 5), the results indicate that the plant transported CDs together with water, and CDs are enriched in the periplasmic space (Fig. 5b). The observed particle size was consistent with that revealed by TEM (Fig. 1d) and AFM (Fig. 1g). Pollen-CDs were enriched in the cells protoplast space, producing higher osmotic pressure and resulting in the plant cells transporting more water into the cell. This was confirmed by the K+ results (Fig. S2c and S3c†), which justify why the CDs affect the content of potassium in Brassica parachinensis L. This also explains the absorption of phosphorus and nitrogen in plants. The NPs that enter the intercellular space of the plants by passage through the vascular bundles are deposited on the cell wall of the substomatal cavity or neighboring cells;39 thus, the CDs transported by biomechanical and cell-to-cell translocation depend on the size exclusion limit of plasmodesmata between the adjacent cells. We also know the nutritional elements absorbed by plant is a ion state, element through the cell membrane is the need for zeta changes, but we also can't fund an effective method detected the changes in cell membrane zeta. Not unexpectedly, the TEM and confocal image showed that the presented CDs were agglomerated as relatively larger clusters in the intercellular space, so we infer because of the CDs reunited result in water potential reduction, also the content soluble sugars and potassium etc. in plant had significant difference from CK. This result is attributed to the properties of the CDs. All these results demonstrate that CDs are excellent materials that can be applied in hydroponic plants. We were not able to conclude which physiological or metabolic pathway affected the yield of Brassica parachinensis L. after CDs supplementation or whether the CDs entered the cytoplasm or the cell nucleus. We will therefore consider these issues in future studies.
Conclusion
In conclusion, pollen-CDs were synthesized from the bee pollen via a one-step hydrothermal carbonization process. They exhibited a blue emission under UV excitation with a quantum yield of 7.7%. The average size of the pollen-CDs, based on TEM and AFM, was approximately 2.01 nm. Such a small size is beneficial for plant uptake and transport. The surface functionalization and chemical compositions of the pollen-CDs were confirmed by FT-IR and XRD. The addition of 3.5 mg L−1 pollen-CDs into the nutrient solution can increase the MDA content of Brassica parachinensis L. and significantly increase potassium absorption, which subsequently inhibits the accumulation of nitrates. The biomass of Brassica parachinensis L. treated with 3.5 mg L−1 pollen-CDs was higher than that of the others. The pollen-CDs, as a specific microelement, can be used in hydroponic vegetables for improving the absorption efficiency of potassium, inhibiting the accumulation of nitrates, and increasing the yield of the vegetables. The fluorescence characteristic of pollen-CDs can be used to track the elemental contents of nutrient solutions, label the transport through the plants, and monitor the uptake of active compounds from nutrient solutions. All the results indicate that pollen-CDs are ideal materials for the addition of microelements into hydroponic plants and for achieving biocompatibility in vitro/in vivo imaging.Experimental
Synthesis of carbon dots
Hydrothermal synthesis of pollens-CDs was previously reported.13 Briefly, 0.75 g of pollens were dispersed into 30 mL pure water for 15 min, with sonication. The resulting solution was transferred to a 50 mL Teflon-lined stainless steel autoclave and sealed, heated to 200 °C and maintained in an oven for 24 h, and afterwards naturally cooled to room temperature. The obtained pollens-CDs suspension was separated via vacuum filtration (pore size 0.22 μm) and stored at 4 °C for further characterization and application.The cultivation of Brassica parachinensis L.
After one hour of soaking, the seeds were cultivated on perlite (temperature 30/20 °C (day/night)), and sowed in sponge blocks with water. After 10 days, the seedlings were transplanted in the hydroponic system with 1/4 Hoagland nutrient solution (CaNO3 945 mg L−1, KNO3 607 mg L−1, NH4PO4 115 mg L−1, MgSO4 493 mg L−1, pH ≈ 6.0) (temperature is 30/20 °C (day/night)). At 20 days after transplantation with random allocation, pollens-CDs were applied (concentration 0 mg L−1 (CK), 7 mg L−1 (T1), 3.5 mg L−1 (T2), 1.75 mg L−1 (T3), respectively) until the plants were harvested. Three replicate treatments were performed to ensure accuracy.Characterization of CDs
The morphology of the pollens-CDs was characterized using transmission electron microscopy (TEM) and atomic force microscopy (AFM). An F-7000 Hitachi fluorescence spectrofluorometer was used for photoluminescence spectra. Bioimaging was performed by confocal microscopy. Fourier transform infrared (FTIR) spectroscopy was employed to demonstrate the function of surface groups on pollens-CDs.Measurement of plant physiology
Chlorophyll was extracted with 80% (v/v) acetone and measured by UV-spectrophotometry.14 The content of soluble sugars was measured by the method of sulfuric acid anthrone by UV-spectrophotometry,15 and soluble proteins were measured by the Coomassie brilliant blue method by UV-spectrophotometry.16 The free amino acids contents were measured by UV-spectrophotometry,17 the nitrate content was measured by UV-spectrophotometry,18 malondialdehyde (MDA) content was assayed by the method of Gunderson,19 and the total nitrogen, phosphorus and potassium was measured by spectrophotometry.20Data statistics
All the assays were performed in triplicates. Significant differences among the treatments were determined by analysis of variance (ANOVA) followed by Duncan multiple range tests using a statistical analysis system (SPSS 17.0, Origin 9.3).Acknowledgements
The present study was supported by the National Natural Science Foundations of China (Grant No. 21671070, 21571067), the Teamwork Projects funded by the Guangdong Natural Science Foundation (Grant No. S2013030012842), the Project for Construction of High-level University in Guangdong Province, the Provincial Science and Technology Project of Guangdong Province (No. 2016A050502043, 2015B090903074), and the Guangzhou Science & Technology Project (No. 201707010033, 201605030005).References
- S. Zhu, Q. Meng, L. Wang, J. Zhang, Y. Song, H. Jin, K. Zhang, H. Sun, H. Wang and B. Yang, Highly photoluminescent carbon dots for multicolor patterning, sensors, and bioimaging, Angew. Chem., 2013, 52, 3953–3957 CrossRef CAS PubMed.
- P. Wang, E. Lombi, F. J. Zhao and P. M. Kopittke, Nanotechnology: A New Opportunity in Plant Sciences, Trends Plant Sci., 2016, 21, 699 CrossRef CAS PubMed.
- M. V. Khodakovskaya, B. Kim, J. N. Kim, M. Alimohammadi, E. Dervishi, T. Mustafa and C. E. Cernigla, Carbon Nanotubes as Plant Growth Regulators: Effects on Tomato Growth, Reproductive System, and Soil Microbial Community, Small, 2013, 9, 115–123 CrossRef CAS PubMed.
- M. V. Khodakovskaya, K. de Silva, A. S. Biris, E. Dervishi and H. Villagarcia, Carbon Nanotubes Induce Growth Enhancement of Tobacco Cells, ACS Nano, 2012, 6, 2128–2135 CrossRef CAS PubMed.
- A. Mondal, R. Basu, S. Das and P. Nandy, Beneficial role of carbon nanotubes on mustard plant growth: an agricultural prospect, J. Nanopart. Res., 2011, 13, 4519–4528 CrossRef CAS.
- X. Wang, H. Han, X. Liu, X. Gu, K. Chen and D. Lu, Multi-walled carbon nanotubes can enhance root elongation of wheat (Triticum aestivum) plants, J. Nanopart. Res., 2012, 14, 841 CrossRef.
- S. Tripathi, S. K. Sonkar and S. Sarkar, Growth stimulation of gram (Cicer arietinum) plant by water soluble carbon nanotubes, Nanoscale, 2011, 3, 1176–1181 RSC.
- M. J. Murcia, D. L. Shaw, E. C. Long and C. A. Naumann, Fluorescence correlation spectroscopy of CdSe/ZnS quantum dot optical bioimaging probes with ultra-thin biocompatible coatings, Opt. Commun., 2008, 281, 1771–1780 CrossRef CAS PubMed.
- K. Yang, D. Wu, X. Ye, D. Liu, J. Chen and P. Sun, Characterization of Chemical Composition of Bee Pollen in China, J. Agric. Food Chem., 2013, 61, 708–718 CrossRef CAS PubMed.
- S. Santra, H. Yang, P. H. Holloway, J. T. Stanley and R. A. Mericle, Synthesis of Water-Dispersible Fluorescent, Radio-Opaque, and Paramagnetic CdS: Mn/ZnS Quantum Dots: A Multifunctional Probe for Bioimaging, J. Am. Chem. Soc., 2005, 127, 1656–1657 CrossRef CAS PubMed.
- J. Zhang, Y. Yuan, G. Liang and S. H. Yu, Scale-Up Synthesis of Fragrant Nitrogen-Doped Carbon Dots from Bee Pollens for Bioimaging and Catalysis, Adv. Sci., 2015, 2, 1502–1508 Search PubMed.
- Isolation of membranes and organelles from plant cells, ed. J. L. Hall and A. L. Moore, 1983, vol. 149, pp. 581–592 Search PubMed.
- B. Halliwell, J. M. Gutteridge and O. I. Aruoma, The deoxyribose method: a simple “test-tube” assay for determination of rate constants for reactions of hydroxyl radicals, Anal. Biochem., 2012, 165, 215–219 CrossRef.
- Y. Yang, C. Tian, J. Sheng and Q. Wen, Spatial variability of soil organic matter, total nitrogen, phosphorus and potassium in cotton field, Agricultural Research in the Arid Areas, 2002, vol. 20, pp. 26–30 Search PubMed.
- S. Zhu, Q. Meng, L. Wang, J. Zhang, Y. Song, H. Jin, K. Zhang, H. Sun, H. Wang and B. Yang, Highly photoluminescent carbon dots for multicolor patterning, sensors, and bioimaging, Angew. Chem., Int. Ed., 2013, 52, 3953–3957 CrossRef CAS PubMed.
- J. Zhang, L. Dong and S. H. Yu, A selective sensor for cyanide ion (CN−) based on the inner filter effect of metal nanoparticles with photoluminescent carbon dots as the fluorophore, Sci. Bull., 2015, 60, 785–791 CrossRef CAS.
- J. Zhang, L. Dong and S. Yu, A selective sensor for cyanide ion (CN−) based on the inner filter effect of metal nanoparticles with photoluminescent carbon dots as the fluorophore, Sci. Bull., 2015, 60, 785–791 CrossRef CAS.
- J. Zhang, Y. Yuan, G. Liang and S. H. Yu, Scale-Up Synthesis of Fragrant Nitrogen-Doped Carbon Dots from Bee Pollens for Bioimaging and Catalysis, Adv. Sci., 2015, 2, 152–159 Search PubMed.
- E. C. Gunderson and C. C. Anderson, A sampling and analytical method for airborne m-phenylenediamine (MPDA) and 4,4′-methylenedianiline (MDA), Am. Ind. Hyg. Assoc. J., 1988, 49, 531–538 CrossRef CAS PubMed.
- D. A. Rennie and R. W. Adams, American Society of Agronomy, Geoderma, 1968, 2, 82–83 CrossRef.
- A. Gigon and I. H. Rorison, The Response of Some Ecologically Distinct Plant Species to Nitrate- and to Ammonium-Nitrogen, J. Ecol., 1972, 60, 93–102 CrossRef CAS.
- S. K. Chaudhuri and D. R. Lovley, Electricity generation by direct oxidation of glucose in mediatorless microbial fuel cells, Nat. Biotechnol., 2003, 21, 1229–1232 CrossRef CAS PubMed.
- U. Binesh, Wu. Chien-Wei, P. I-Wen, C. Huan-Tsung and L. Chia-Hua, Carbon Dot-Mediated Synthesis of Manganese Oxide Decorated Graphene Nanosheets for Supercapacitor Application, ACS Sustainable Chem. Eng., 2016, 4, 3008–3016 CrossRef.
- V. Lattanzio, V. M. T. Lattanzio, A. Cardinali and F. Imperato, Role of phenolics in the resistance mechanisms of plants against fungal pathogens and insects, Phytochemistry, 2006, 37, 23–67 Search PubMed.
- D. R. Lovley, The microbe electric: conversion of organic matter to electricity, Curr. Opin. Biotechnol., 2008, 19, 564–571 CrossRef CAS PubMed.
- J. R. Evans, Photosynthesis and nitrogen relationships in leaves of C3 plants, Oecologia, 1989, 78, 9–19 CrossRef PubMed.
- M. W. Davey, E. Stals, B. Panis, J. Keulemans and R. L. Swennen, High-throughput determination of malondialdehyde in plant tissues, Anal. Biochem., 2005, 347, 201–207 CrossRef CAS PubMed.
- H. Giday, D. Fanourakis, K. H. Kjaer, I. S. Fomsgaard and C. O. Ottosen, Threshold response of stomatal closing ability to leaf abscisic acid concentration during growth, J. Exp. Bot., 2014, 65, 4361–4376 CrossRef CAS PubMed.
- J. V. Pego, A. J. Kortstee, C. Huijser and S. C. Smeekens, Photosynthesis, sugars and the regulation of gene expression, J. Exp. Bot., 2000, 51, 407–416 CrossRef CAS PubMed.
- H. Esterbauer, R. J. Schaur and H. Zollner, Chemistry and biochemistry of 4-hydroxynonenal, malonaldehyde and related aldehydes, Free Radical Biol. Med., 1991, 11, 81–128 CrossRef CAS PubMed.
- D. P. Schachtman and J. I. Schroeder, Structure and transport mechanism of a high-affinity potassium uptake transporter from higher plants, Nature, 1994, 370, 655–658 CrossRef CAS PubMed.
- B. M. Mampholo, D. Sivakumar, M. Beukes and W. J. van Rensburg, Effect of modified atmosphere packaging on the quality and bioactive compounds of Chinese cabbage (Brasiccarapa L. ssp. chinensis), J. Sci. Food Agric., 2013, 93, 2008–2015 CrossRef CAS PubMed.
- Q. Qiu, Y. Wang, Z. Yang and J. Yuan, Effects of phosphorus supplied in soil on subcellular distribution and chemical forms of cadmium in two Chinese flowering cabbage (Brassica parachinensis L.) cultivars differing in cadmium accumulation, Food Chem. Toxicol., 2011, 49, 2260–2267 CrossRef CAS PubMed.
- J. Zhang, Y. Yuan, G. Liang and S. Yu, Scale-Up Synthesis of Fragrant Nitrogen-Doped Carbon Dots from Bee Pollens for Bioimaging and Catalysis, Adv. Sci., 2015, 2, 152–158 Search PubMed.
- A. R. Wellburn, The Spectral Determination of Chlorophylls a and b, as well as Total Carotenoids, Using Various Solvents with Spectrophotometers of Different Resolution, J. Plant Physiol., 1994, 144, 307–313 CrossRef CAS.
- S. W. Song, G. X. Liao, H. C. Liu, G. W. Sun and R. Y. Chen, Effect of Ammonium and Nitrate Ratio on Nutritional Quality of Chinese Kale, Appl. Mech. Mater., 2011, 142, 188–192 CrossRef.
- M. Bradford, A rapid method for the quantification of microgram quantities of protein utilizing the principle of protein-dye binding, Anal. Biochem., 1976, 72, 248–254 CrossRef CAS PubMed.
- S. Konosu, K. Watanabe and T. Shimizu, Distribution of Nitrogenous Constituents in the Muscle Extracts of Eight Species of Fish, Nippon Suisan Gakkaishi, 1974, 40, 909–915 CrossRef CAS.
- G. D. Humble and T. C. Hsiao, Light-dependent Influx and Efflux of Potassium of Guard Cells during Stomatal Opening and Closing, Plant Physiol., 1970, 46, 483–487 CrossRef CAS PubMed.
Footnote |
| † Electronic supplementary information (ESI) available. See DOI: 10.1039/c7ra04644h |
| This journal is © The Royal Society of Chemistry 2017 |