
 Open Access Article
 This Open Access Article is licensed under a
 Creative Commons Attribution 3.0 Unported Licence
Rapid construction of 3D foam-like carbon nanoarchitectures via a simple photochemical strategy for capacitive deionization†
Haiyan Duan‡
,
Tingting Yan‡,
Zhongxun An,
Jianping Zhang,
Liyi Shi and
Dengsong Zhang *
*
Research Center of Nano Science and Technology, Shanghai University, Shanghai 200444, China. E-mail: dszhang@shu.edu.cn; Tel: +86 21 66137152
First published on 11th August 2017
Abstract
Herein, 3D foam-like carbon nanoarchitectures are originally and rapidly constructed via a simple photochemical strategy as high-performance electrodes for capacitive deionization. It is found that the nanocomposites are obtained in a few seconds via UV radiation at room temperature. To date, this type of easily available nanocomposite has rarely been explored as precursors to fabricate carbon materials. Furthermore, the precise control of pore size and the milder synthetic conditions can be simultaneously realized in comparison with the conventional strategies. The resulting materials feature 3D foam-like interconnected open pore structures, ultrathin pore walls, highly accessible surface area, tunable pore size and low inner resistance. The above characteristics significantly enhance the accessible adsorption surface and facilitate the transport of ions, rendering the obtained electrodes adequate in attaining the desired deionization performance. The electrochemical tests showed that the obtained materials presented higher capacitance, good stability and low inner resistance. The deionization measurements demonstrated a higher capacity of 20.9 mg g−1 in a 1000 mg L−1 NaCl solution at 1.4 V. Furthermore, it has been verified that the electrodes presented higher adsorption rate. The electrodes also presented excellent regeneration performance during the repeated adsorption–desorption experiments. In combination with the facile and efficient photochemical preparation process, this work may open up new probabilities for the widespread fabrication of high-quality 3D carbon nanoarchitectures for capacitive deionization and other energy-related applications.
1. Introduction
Water scarcity has became one of the key issues faced by human beings due to the economic development and the expansion of population.1,2 It has been accepted that deionization of saline water is one of the most promising strategies to tackle this issue. Traditional deionization strategies, including distillation and membrane processes, always have a high cost and require significant amounts of energy, as well as being environmentally unfriendly.3 Therefore, further exploration of economical and efficient water treatment technologies is urgently required. Recently, capacitive deionization (CDI) has been receiving great interest as an eco-friendly and energy-efficient alternative for removing salt ions from seawater and brackish water compared with conventional approaches.4–6 The electrical double layers (EDL) will be formed upon the application of an external voltage,7 and the ions will be electroabsorbed on the oppositely charged electrode and then stored inside the EDL. By reversing the external voltage or short-circuiting, the adsorbed ions can be released in the solution; then the generation of electrodes can be successfully realized.8,9 Based on the above EDL mechanism, the electrodes should possess highly accessible specific surface area (SSA), suitable pore structure, good wettability and superior conductivity to achieve high deionization capacity.10,11 Up to now, diverse carbon-based materials have been extensively probed as CDI electrodes by us and other research groups, including graphene,12,13 carbon nanotubes,14,15 carbon aerogels,16,17 activated carbon,18,19 porous carbon20–22 and their composites.23–25Currently, 3D porous carbon nanoarchitectures have exerted a tremendous scientific and technological fascination due to their unique structural properties such as large accessible SSA, various pore sizes and high pore volume.26–28 These intriguing structural characteristics permit their enormous potential in many applications, including catalysis,29,30 sensing,31–33 as well as energy storage and conversion.34,35 In addition, 3D porous carbon nanoarchitectures can be ideal candidates for CDI application. Recently, the possibility of using 3D porous carbon nanoarchitectures as electrodes for the deionization process has been proved. Lei et al. successfully demonstrated that the 3D porous carbon electrodes have a good adsorption capacity and present great potential in CDI.36 Moreover, 3D porous carbon nanoarchitectures as well as 3D porous carbon nanoarchitectures/graphene composites with increased deionization performance have been verified by our groups.37–39
3D porous carbon nanoarchitectures are mainly fabricated by hydrothermal process or thermal polymerization with the subsequent calcination treatment. For biomass-derived porous carbon nanoarchitectures, hydrothermal treatment has been widely used in the preparation process.40 However, the pore sizes are widely distributed and difficult to control, the pore size of the resultant carbon is mainly concentrated on micropores. For templated porous carbon, the 3D porous structure nanoarchitectures are performed by predesigned hard templates or organic molecular precursors, followed by sacrificial templates removal and structure transformation/replication.41 For instance, recent studies of colloidal silica and aromatic polymers through thermal polymerization have emphasized potential advantages to develop 3D porous carbon with tunable pore size.42 The hard template colloidal silica allows for the accurate control of pore sizes. More recently, the soft templating strategies developed by Zhao and co-workers are exceedingly impressive.43 However, in the above fabrication process of 3D porous carbon nanoarchitectures, the hydrothermal treatment was always realized at 180–220 °C for 5.5–15 h,44,45 and the thermal polymerization was mostly conducted in harsh reaction conditions for 24–48 h.46,47 It should be noted that the above fabrication processes are always energy-consuming, high-cost, and practically time-consuming. Therefore, fabricating 3D porous carbon nanoarchitectures by a much milder strategy for energy-related applications is urgently required.
Herein, we rationally designed and originally proposed a simple photochemical strategy to rapidly construct pore size-tunable 3D foam-like carbon nanoarchitectures (3DFCN) under milder conditions. The simple synthetic procedures are illustrated in Fig. 1. Firstly, the modified colloidal silica templates were well mixed with a homogeneous mixture of epoxy acrylate resin (EA) and 1,4-butanediol diglycidyl ether (BDDGE). Then nanocomposites formed via solvent evaporation and UV irradiation. The UV-induced photochemical mechanism is discussed in detail as follows. The active centers can generate when the photoinitiator is activated by absorbing UV radiation energy, which will react with the unsaturated group and epoxy group, as well as interaction concurrently to form cross-linked polymeric network. Thereby the chain transfer reactions are initiated and silica-templated nanocomposites are easily obtained in a few seconds at room temperature. After the subsequent calcination and removal of sacrificial templates, pore size-tunable 3DFCN was achieved. The 3DFCN possessed 3D foam-like interconnected open porous structures, highly accessible surface area and tunable pore size. As a result, 3DFCN is originally fabricated by a much milder and rapider synthetic strategy compared with the conventional thermal polymerization and hydrothermal process. The pore size-tunable 3DFCN should act as high-performance candidates for the CDI application.
 | ||
| Fig. 1 Schematic illustration of the construction of 3DFCN. | ||
2. Experimental section
2.1 Materials
Silica and triarylsulfonium hexafluoroantimonate salts (50 wt% in propylene carbonate) were purchased from Sigma Aldrich. 3-(Trimethoxysilyl)propylmethacrylate (MPS) was provided by Aladdin. EA were supplied by Nanjing Fine Chemical Co. LTD, BDDGE was from TOKYO KASEI. All chemicals were used without further purification except colloidal silica. Before preparation, the colloidal silica was dialyzed in methanol solution under continuous stirring. Deionized water was used throughout the process.2.2 Preparation
The 3DFCN was synthesized by photopolymerization of EA and BDDGE in the presence of SiO2 and subsequent thermal treatment. Typically, varying amounts (1 g, 1.5 g, 2 g, representing different mass percent of 20, 30 and 40) of SiO2 was thoroughly mixing with a certain amount (0.41 g, 0.62 g, 0.82 g) of MPS via ultrasonication for 1 h. Depending on the amount of SiO2, 2.17–3.59 g mixture of EA and BDDGE was added in the above solution. The stable dispersion was formed under continuous ultrasonication. Then 0.06–0.08 g photoinitiator was added and the resultant solution was evaporated at room temperature to remove solvent. Afterwards, the mixture can directly transform into nanocomposites in few seconds by UV irradiation. The obtained nanocomposites were then annealed at 400 °C for 2 hours then to 900 °C for 2 hours under N2 flow. The SiO2 templates were removed by the etching treatment in 3 M NaOH solution. The resultant products were denoted as 3DFCN-x-y, which refers to samples developed from silica templates with x nm and mass percent of y%.2.3 Characterization
The morphologies were observed using scanning electron microscope (SEM, JEOL JEM-6700 F) and transmission electron microscopy (TEM, JEOL JEM-200CX). High-Resolution TEM (HRTEM) images were obtained using a Tecnai G2 20 TWIN microscope operated at 200 kV. N2 adsorption–desorption measurements were carried out on an Autosorb-IQ2, the samples were treated in vacuum states by degasification at 573 K before tests. A Rigaku D/MAX-RB X-ray diffractometer was utilized to record the powder X-ray diffraction (XRD) tests. A JY H800UV spectrometer was used to measure the Raman spectra. Thermal behaviors of the nanocomposites was evaluated by thermogravimetry (TG) under an N2 atmosphere by an STA 449 instrument, the heating rate is 10 °C min−1 and the temperature change is from room temperature to 800 °C.2.4 Electrochemical measurements
The electrodes were fabricated by blending 90 wt% of 3DFCN and 10 wt% of polytetrauoroethylene in ethanol. The obtained slurry were loaded on the graphite substrate with a size of 50 mm × 40 mm. The samples were dried for 8 h at 110 °C. The CHI 660D workstation was utilized to measure the corresponding cyclic voltammetry (CV) as well as electrochemical impedance spectroscopy (EIS). LAND battery instruments were utilized to conduct the galvanostatic charge–discharge (GCD) tests. All the electrochemical experiments were carried out in 0.5 M NaCl solution utilizing the three-electrode cell configuration, including the 3DFCN electrode as working electrodes, graphite as counter electrodes, and saturated calomel as reference electrodes, respectively. The specific capacitance C was calculated from the formulas:
 | (1) |
2.5 Deionization experiments
The deionization experiments were performed in a flow through recycling cell included two sided electrodes possessing a total active mass of 160 mg. The details can be seen in our previously reported method.25 During each deionization experiments, 25 mL NaCl solution was continuously pumped to the CDI cell utilized a pump setting the flow rate of solution at 40 mL min−1 and salt ions were removed by applying an external voltage ranging from 1.0 V to 1.4 V with an interval of 0.2 V. The NaCl solution with the beginning concentration of 300, 500, and 1000 mg L−1 were utilized respectively. At the outlet of the cell, a conductivity meter was used to transiently monitor and measure the concentration change of the solution. The salt adsorption capacity, SAC, of electrode materials was obtained from the formulas:| SAC = (C0 − C)V/m | (2) |
The salt adsorption rate, SAR, of the electrodes was obtained from the formulas:
| SAR = SAC/t | (3) |
3. Results and discussion
3.1 Characteristics
The resultant pore size-tunable 3DFCN derived from silica-templated UV-curable nanocomposites (Fig. S1†) were subjected to microscopic characterization. A complete carbon conversion was realized by calcination at 900 °C, as determined by TG analysis under nitrogen (Fig. S2†). The SEM images taken on the surface in Fig. 2a demonstrated that the as-formed 3DFCN-7-30 shows well-developed foam-like carbon nanoarchitectures without structural collapse after carbonization and etching. Fig. 2b manifests a typical TEM image of 3DFCN-7-30. It can be vividly observed that 3D interconnected open pores were well-developed throughout the entire surface of 3DFCN-7-30. A closer observation via HRTEM images depicted in Fig. 2c clearly reveal the well-formed 3D open porous structures, in good uniformity with the original morphology of the SiO2. And the size of pores is around 7 nm, which is highly consistent with size of silica (Fig. S3†). The 3D interconnected open porous structures can ensure more transmission pathways and lower the transmission barriers. Besides, the ultrathin walls of around 2–5 nm can not only supply minimal resistance of ion diffusion on the electrode interface but also facilitate ion transmission by shortening the diffusive pathways.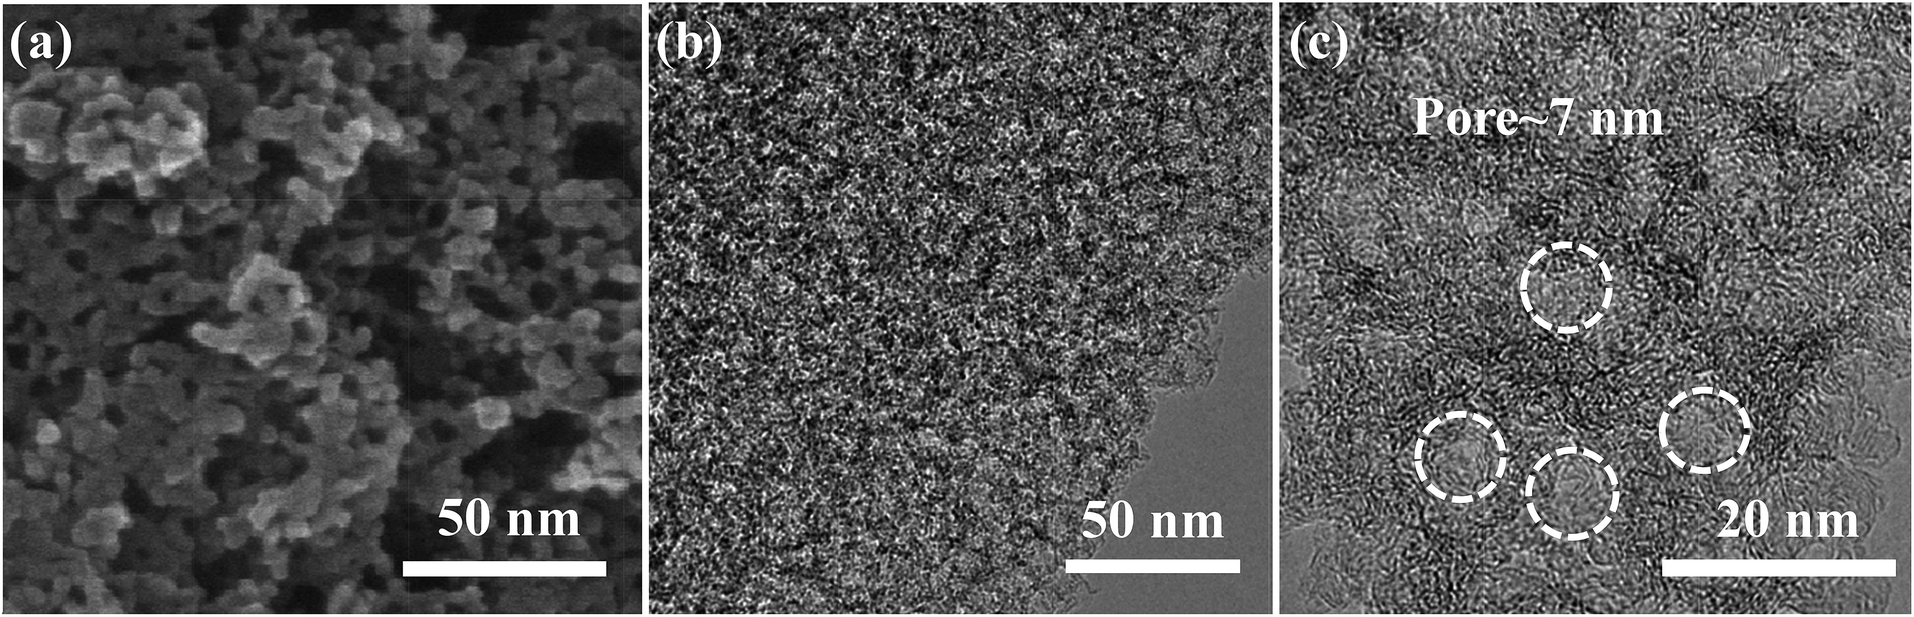 | ||
| Fig. 2 (a) SEM images taken on the surface, (b) TEM images and (c) HRTEM images of 3DFCN-7-30. | ||
In fact, the realization of 3D interconnected open porous structures of 3DFCN-7-30 is realized by adjusting the size and mass percent of colloidal silica. When colloidal silica of different size was used (Fig. S3†), the pore size of 3DFCN could be effectively adjusted as manifested in Fig. 3a and b. The 3DFCN-12-30 and 3DFCN-16-30 exhibited similar 3D homogeneous foam-like open pores ranging from 12 nm to 16 nm. Therefore, the colloidal silica with different size were served as mesoporous templates for EA/BDDGE photopolymerization and the pore size-tunable interconnected open networks can be well formed after carbonization and removal of templates. In addition, the mass percent of silica with 7 nm is also easily modulated to control the morphology of 3DFCN (Fig. 3c and d). Obviously, when the mass percent of silica is 20, 3DFCN-7-20 still maintains the interconnected 3D foam-like porous morphology and the uniform thinner carbon layers. However, as the mass ratio of silica increased to 40, the morphology of 3DFCN-7-40 is broken to some degree, this is because the excessive amounts of silica could induce severe agglomeration. Similarly, when varying the mass ratio of silica from 20 to 40 for the 3DFCN with 12 nm and 16 nm, they also possess the same variation trend of 3D foam-like porous structures (Fig. S4†). Thereby, the unique structures and morphology analyses verified that the facile UV-curable polymerization strategy is a promising route to rationally design and rapidly construct 3D foam-like carbon nanoarchitectures with controllable pore size and morphology.
 | ||
| Fig. 3 TEM images of (a) 3DFCN-12-30, (b) 3DFCN-16-30, (c) 3DFCN-7-20 and (d) 3DFCN-7-40. | ||
To further explore the physical characteristics of 3DFCN, N2 adsorption–desorption measurements were also conducted to probe the porosities of the 3DFCN, which is crucial to the CDI applications. As can be seen in Fig. 4a, the above samples all exhibited type-IV isotherms with a large capillary condensation step at a relatively higher pressure starting from around 0.65, indicating a dominant mesostructure with 3D interconnected open networks.48 This could be further demonstrated by the pore size distribution calculated from QSDFT in Fig. 4b. Obviously, the pore size distribution plots determined distribution peak at around 7, 12 and 16 nm for 3DFCN-7-30, 3DFCN-12-30 and 3DFCN-16-30 respectively, which is highly consistent with the size of silica and TEM observations. The results, including SSA, pore size and pore volume, are summarized in Table 1. The SSA for 3DFCN-7-30, 3DFCN-12-30 and 3DFCN-16-30 were calculated to be 1096, 992 and 762 m2 g−1 respectively, indicating the pores with smaller size can significantly enhance the SSA. The colloidal silica with different size can utilized as mesoporous templates for EA/BDDGE photopolymerization and the interconnected open porous networks can be well developed after carbonization and removal of templates, which render the 3DFCN with large SSA. Moreover, compared with 3DFCN with 12 nm and 16 nm, the 3DFCN with 7 nm can be a well balance of SSA and pore size. It is noteworthy that the mesopore size of 7 nm is large enough to ensure the smooth delivery of salt ions. Therefore, in combination with the N2 adsorption isotherms and pore size distribution analysis, 3DFCN-7-30 with pore size of 7 nm could ensure more available adsorption surface for ions transmission and facilitate the faster transport of salt ions across the 3D networks. In addition, when increasing the pore size of 3DFCN from 7 nm to 16 nm, the pore volume also remarkably decreased from 2.80 cm3 g−1 to 2.51 cm3 g−1. The larger pore volume of 3DFCN-7-30 can facilitate fast ion transport and result in a significantly increased rate performance of electrodes. Besides, the 3DFCN with a mass percent of 20 to 40 gave SSA from 551 to 1096 m2 g−1. The higher surface area can be attributed to the well-developed interconnected open pores generated from appropriate template content. It is noteworthy that they all exhibit a mesopore distribution peak at 7 nm, highly consistent with the diameter of silica. The pore volume of 3DFCN with a mass percent of 20 to 40 was significantly different from 2.40 cm3 g−1 to 2.80 cm3 g−1. Therefore, combing the SSA and pore volume, the 3DFCN-7-30 with a silica mass ratio of 30 presents the better developed porous structures and favors the faster transport of salt ions than 3DFCN-7-20 and 3DFCN-7-40. These results demonstrate that pore size-tunable 3DFCN with various morphologies could be originally designed and easily modulated via the milder UV-curable polymerization strategy. The large SSA, pore volume and well-developed interconnected open pore structures of 3DFCN-7-30 could supply sufficient adsorption surface and be beneficial to the faster transmission of salt ions, thus the 3DFCN-7-30 is anticipated to present excellent adsorption performance.
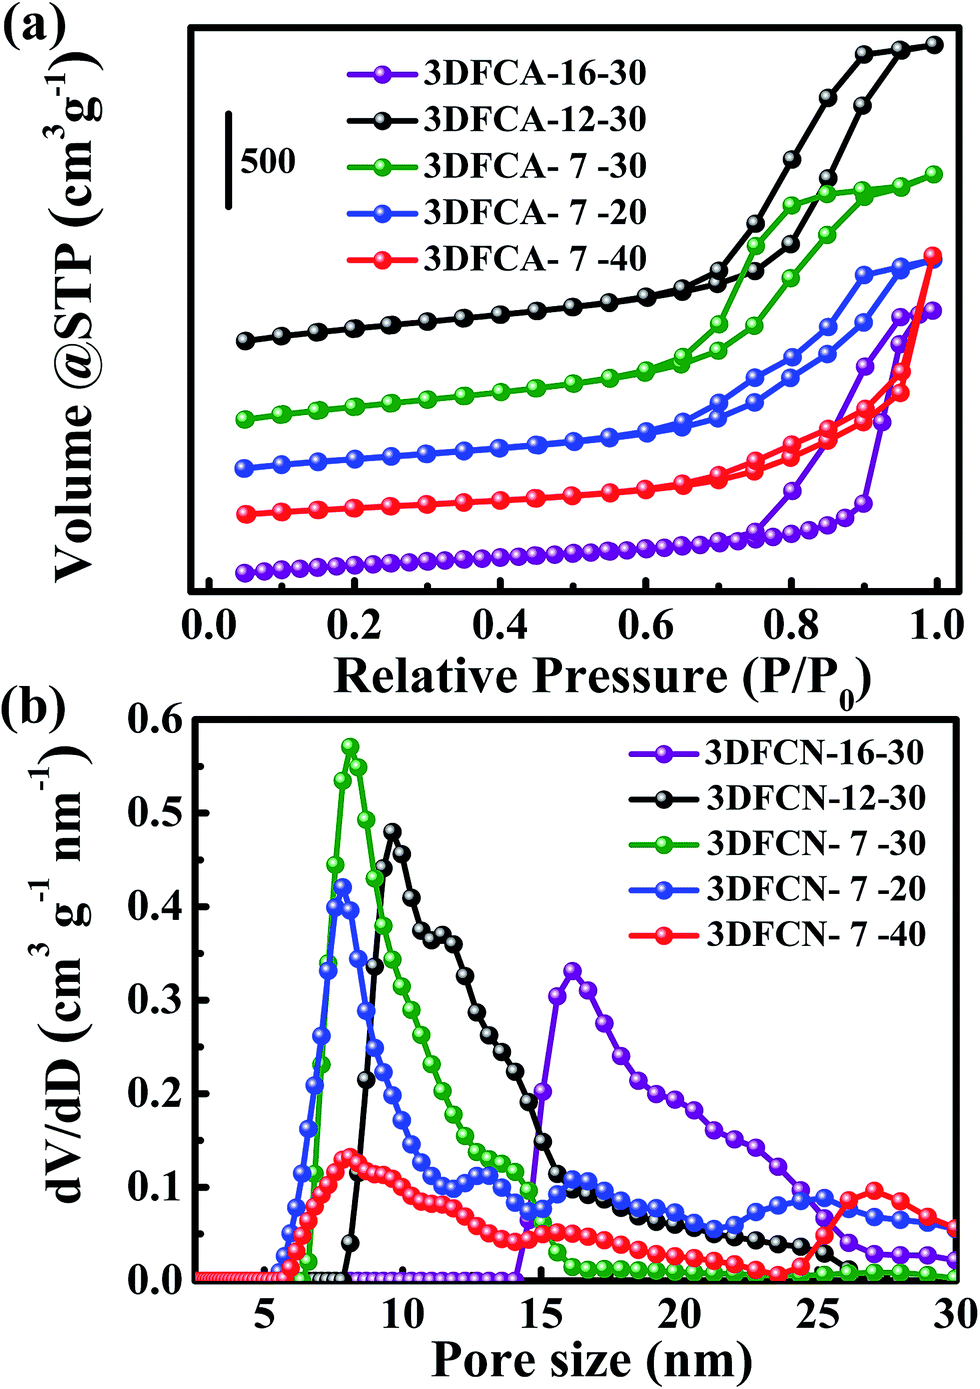 | ||
| Fig. 4 (a) N2 adsorption–desorption isotherms and (b) pore size distribution profiles of all samples. | ||
| Sample | Specific surface area (m2 g−1) | Average pore size (nm) | Pore volume (cm3 g−1) |
|---|---|---|---|
| 3DFCN-16-30 | 762 | 16 | 2.51 |
| 3DFCN-12-30 | 992 | 12 | 2.67 |
| 3DFCN-7-30 | 1096 | 7 | 2.80 |
| 3DFCN-7-20 | 793 | 7 | 2.58 |
| 3DFCN-7-40 | 551 | 7 | 2.40 |
It should be mentioned that using this facile UV-curable strategy to prepare pore size-tunable 3DFCN can be further extended to other carbon- and nitrogen-rich polymer precursors such as the mixture of epoxy resin and BDDGE (ER/BDDGE), as well as the mixture of polyurethane acrylate and 1,6-hexanediol diacrylate (PUA/HDDA). The corresponding 3DFCN obtained by altering precursor exhibited similar pore size and continuous foam-like interconnected open porous morphology (Fig. S5†). Meanwhile, the SSA of 3DFCN prepared from PUA/HDDA (designated as 3DFCN-PUA/HDDA) and 3DFCN prepared from ER/BDDGE (designated as 3DFCN-ER/BDDGE) were calculated to be 764 m2 g−1 and 721 m2 g−1 respectively (Fig. S6†), indicating the universality of this rapid UV-curable methodology.
The XRD patterns of 3DFCN samples investigated in Fig. 5a all identified two weak and broad peaks standing for the (002) and (100) diffraction modes respectively, suggesting the nature of amorphous carbon. The impurities are not observed and the colloidal silica templates have been completely removed. In addition, the shift to the smaller degree of (002) peak in comparison with the standard graphite (26.6°) suggests the broader interlamellar spacing between the (002) planes of 3DFCN. Furthermore, the (002) peak of 3DFCN is broad compared with the sharp ones of graphite, which can be attributed to more defects and pores in the structures of 3DFCN.49 The relatively weak (100) peak manifests a similarly low crystalline structure of the as-prepared 3DFCN.50 This could be further elaborated by Raman spectra analysis in Fig. 5b. Raman spectra of all samples displayed a crystalline graphitic G band at 1590 cm−1 and a broad disorder-induced D band at 1344 cm−1. In addition, the intensity ratio of the D band to G band is related to the amounts of defects in carbon-based materials, representing the graphitization degree.51–53 The lower ID/IG values always correspond to the elevated graphitization degree. As calculated, the ID/IG values of 3DFCN-7-30, 3DFCN-12-30, 3DFCN-16-30 are 1.02, 1.04 and 1.09 respectively, suggesting that the 3DFCN all have a disordered structure and 3DFCN-7-30 present the highest graphitization degree. Further, the ID/IG values of 3DFCN-7-20, 3DFCN-7-40 are calculated to be 1.06 and 1.11 respectively, indicating that when the mass percent of template is increased to 40, the structure of 3DFCN-7-40 are more disorder and the graphitization degree are significantly decreased. It can be concluded that 3DFCN-7-30 possessed the highest graphitization degree among the series of 3DFCN, which can facilitate the ion transmission and lower the internal resistance of electrode in the CDI process.
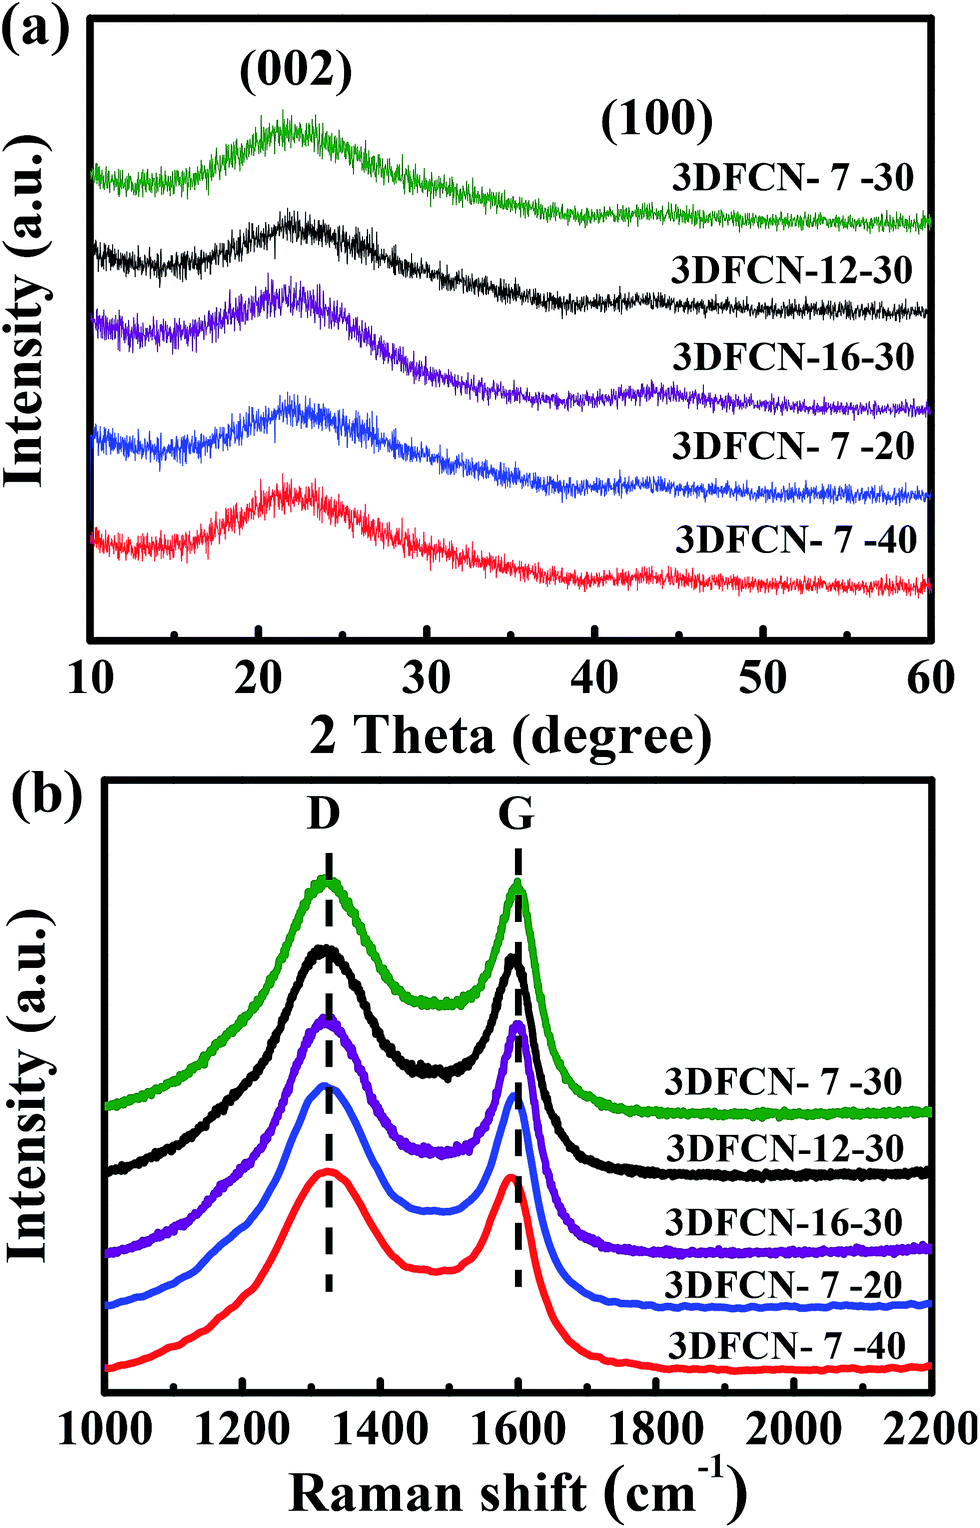 | ||
| Fig. 5 (a) XRD patterns and (b) Raman spectra of all samples. | ||
3.2 Electrochemical performances
As a demonstration of the great potential in CDI, the electrochemical measurements of the 3DFCN was carried out, considering that the capacitive behavior was closely related to the CDI performance. The corresponding CV measurements of 3DFCN with different silica content were depicted in Fig. 6a. Obviously, the CV curves all have a rectangular-like shape and no obvious redox peaks are observed, indicative of an ideal capacitive behavior.54 Generally, a larger enclosed area of the CV curve is desirable for a higher capacitance, which is an index of adsorption capacity. The calculated specific capacitance based on the integral area of the CV curves are 238, 180 and 115 F g−1 respectively, which followed the sequence of 3DFCN-7-30 > 3DFCN-7-20 > 3DFCN-7-40. Moreover, 3DFCN-12-30 and 3DFCN-16-30 also exhibited high specific capacitance up to 206 F g−1 and 187 F g−1, but still lower than 3DFCN-7-30 (Fig. S7†). The much higher capacitance of 3DFCN-7-30 can be attributed to the following advantages. Firstly, the 3D interconnected open structures of 3DFCN-7-30 can function as shortcuts between neighboring pores for ion transport, accelerating ion dynamics across the 3DFCN. Secondly, the ultrathin walls of 3DFCN can not only supply minimal resistance of ion diffusion on the electrode interface but also facilitate ion transmission by shortening the diffusive pathways. Thirdly, the mesopores of 7 nm on the carbon layer provides abundant ion transport pathways with low resistance, so the ions in the bulk solution can easily penetrate and transport into the pores. Besides, smaller mesopore size increases the available surface area to storage ions.55 Therefore, combining the 3D interconnected open structures, the ultrathin walls, the mesopores of 7 nm, low resistance as well as high available surface area, the 3DFCN-7-30 exhibits significant advantages in ions transmission and adsorption.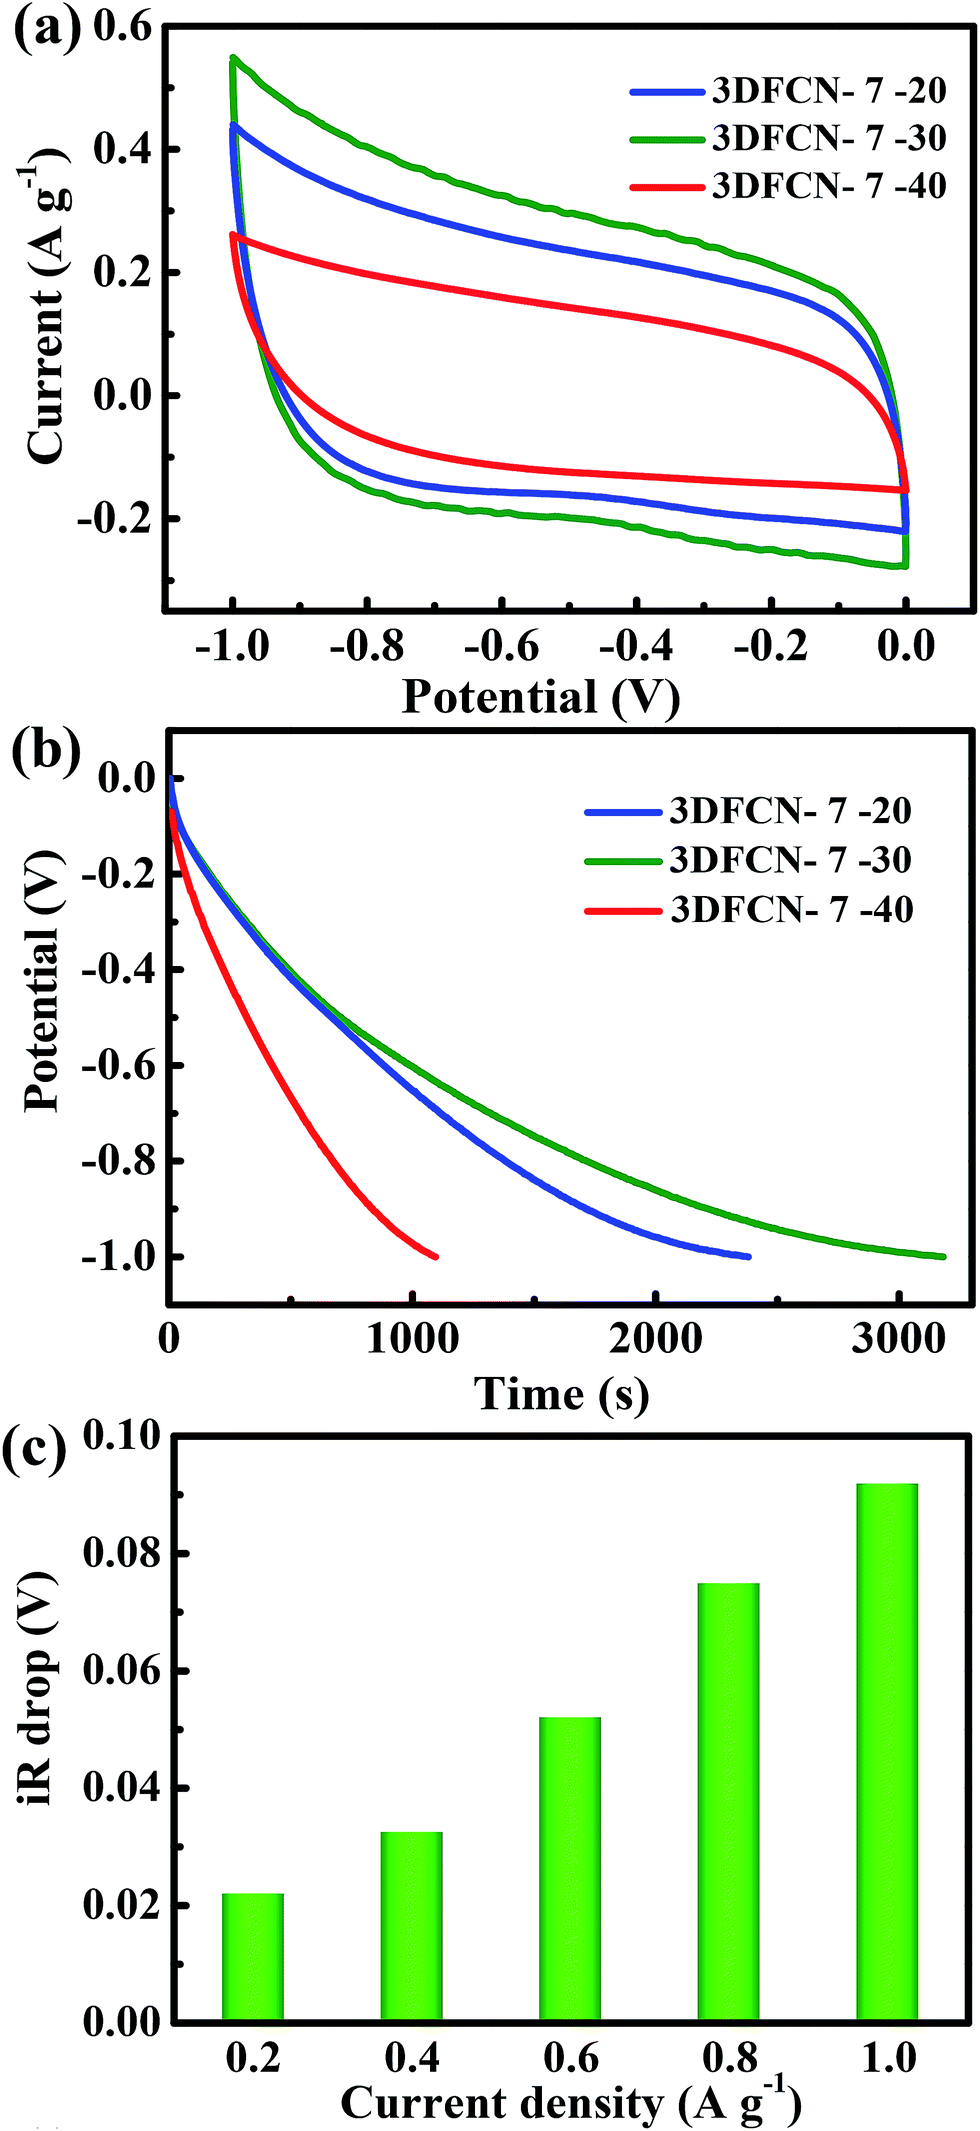 | ||
| Fig. 6 (a) CV curves of 3DFCN with different template content at a scan rate of 1 mV s−1, all the curves were obtained in a 0.5 M NaCl aqueous solution. (b) GCD curves of 3DFCN with different template content at 0.2 A g−1. (c) iR drop of the 3DFCN-7-30 electrode vs. current density. | ||
Next, the samples were subjected to the GCD tests with a potential change from 0 V to −1 V at 0.2 A g−1 (Fig. 6b). A close comparison reveals that 3DFCN-7-30 has a longer discharge time than 3DFCN-7-20 and 3DFCN-7-40. Besides, the GCD measurements of 3DFCN-12-30 and 3DFCN-16-30 also revealed longer discharge time, which followed the sequence of 3DFCN-7-30 > 3DFCN-12-30 > 3DFCN-16-30 (Fig. S8†). Therefore, the 3DFCN possessed quite larger capacitance, which agree well with the above CV analysis. The higher capacitance determined from GCD tests further verified that the 3D interconnected open structures, the ultrathin walls as well as the abundant mesopores of 7 nm can greatly enhance the specific capacitance because of the enhanced conductivity, sufficient ions transmission pathways and short diffusion distance. The cycling stability is another crucial criterion for high efficiency and long term operation of electrodes. Significantly, the nearly identical charge–discharge curves after 10![[thin space (1/6-em)]](https://www.rsc.org/images/entities/char_2009.gif) 000 cycles further confirm its electrochemical stability (Fig. S9†). The sudden voltage drop (iR drop) of 3DFCN-7-30 electrode at the initial stage of discharge process can be used to reveal the inner resistance of electrode. Fig. 6c presents the detailed values of iR drop of 3DFCN-7-30. The iR drop at lower current density can be inconspicuous, however, when increasing the current density, the value of iR drop increase. This can be attributed to the insufficient discharge time in the EDL at the initial stage of discharge curves.56,57 Obviously, the small iR drop of 3DFCN-7-30 reveals the smaller internal resistance, which will potentially accelerate the ion transport. This further confirms that the interconnected open pore structures can decrease the inner resistance of the electrodes and facilitate transmission of salt ions. As a consequence, more salt ions can be easily adsorbed and penetrated in such designed 3D structures with low resistance, which show great potentiality in superior deionization performance.58
000 cycles further confirm its electrochemical stability (Fig. S9†). The sudden voltage drop (iR drop) of 3DFCN-7-30 electrode at the initial stage of discharge process can be used to reveal the inner resistance of electrode. Fig. 6c presents the detailed values of iR drop of 3DFCN-7-30. The iR drop at lower current density can be inconspicuous, however, when increasing the current density, the value of iR drop increase. This can be attributed to the insufficient discharge time in the EDL at the initial stage of discharge curves.56,57 Obviously, the small iR drop of 3DFCN-7-30 reveals the smaller internal resistance, which will potentially accelerate the ion transport. This further confirms that the interconnected open pore structures can decrease the inner resistance of the electrodes and facilitate transmission of salt ions. As a consequence, more salt ions can be easily adsorbed and penetrated in such designed 3D structures with low resistance, which show great potentiality in superior deionization performance.58
The transport property of the salt ions within the 3DFCN electrodes was also probed by EIS. As presented in Fig. 7, the Nyquist profiles consisted of a linear shape in the low frequency range and a small quasi-semicircle at the high frequency one.59 The relatively straight and nearly vertical line of all electrodes in the low-frequency region confirms the primary electrostatic adsorption and capacitive behaviours. And the width of quasi-semicircles plotted is in parallel with the charge-transfer resistance caused by faradic reactions in the interface. It should be noted that the semicircle impedance loop can be ignorable. In addition, the equivalent series resistance (ESR) can be revealed by the point intersecting the real axis. In general, a smaller ESR value indicates lower internal resistance and faster charge/discharge rate.60,61 It can be obviously seen from the inset of Fig. 7, the ESR value of 3DFCN-7-30 is smaller than that of 3DFCN-7-20 and 3DFCN-7-40. Therefore, the 3D interconnected open porous structures can not only favor the contact between the salt ions and electrodes but also serve as multi-dimensional pathways facilitating the charge transfer and the diffusion of salt ions in the bulk electrode. The EIS measurement shows that the 3DFCN-7-30 electrode has easy electron/ion transport pathway with lower resistance, which also agrees well with the iR drop discussed above.
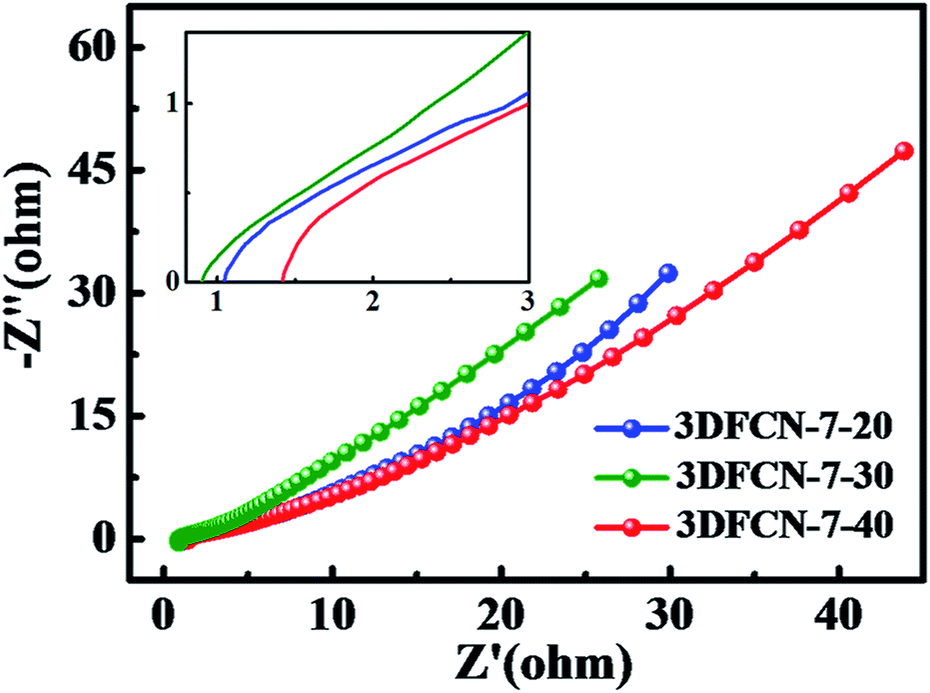 | ||
| Fig. 7 EIS presented as Nyquist plot of 3DFCN with different template contents. The inset is the enlarged view of the high frequency region. | ||
3.3 Deionization performance
To explore the deionization performance of the above 3DFCN electrodes, CDI measurements were evaluated in 500 mg L−1 NaCl solution under 1.4 V. The salt adsorption capacity (SAC) vs. time under the external voltage of 1.4 V is depicted in Fig. 8a. As can be seen, the SAC of 3DFCN increased sharply at the initial stage of CDI process, then increases slowly and even achieves stable with the time going by. At first, the electrodes have sufficient SSA for ions adsorption and accumulation; the electrostatic repulsion is weak, leading to quicker ion adsorption. As the time increased, the adsorption became slower due to the electrosorption equilibrium at the electrode surface. The obviously different performance of the 3DFCN electrodes can be clearly seen. The ascent rate of SAC for 3DFCN-7-30 electrode is always higher than that of 3DFCN-7-20 and 3DFCN-7-40, indicating a better adsorption ability of 3DFCN-7-30 electrode. As calculated, the 3DFCN-7-30 yields a significantly higher SAC (17.5 mg g−1) than 3DFCN-7-20 (13.4 mg g−1) and 3DFCN-7-40 (8.62 mg g−1). The SAC of 3DFCN-7-30 is also higher than that of 3DFCN-12-30 (16.5 mg g−1) and 3DFCN-16-30 (11.1 mg g−1) (Fig. S10†). Furthermore, the 3DFCN-7-30 electrode presents higher SAC than other carbon materials reported in recent literatures under the similar testing conditions (Table S1†). In addition, the charge efficiency of 3DFCN-7-30 is 0.54, demonstrating lower energy consumption during the deionization process. The value less than 1.0 can be elaborated by the co-ion repulsion effect, the weak adhesion between the electrodes and current collector, as well as the blocking effect of the binder (Fig. S11†).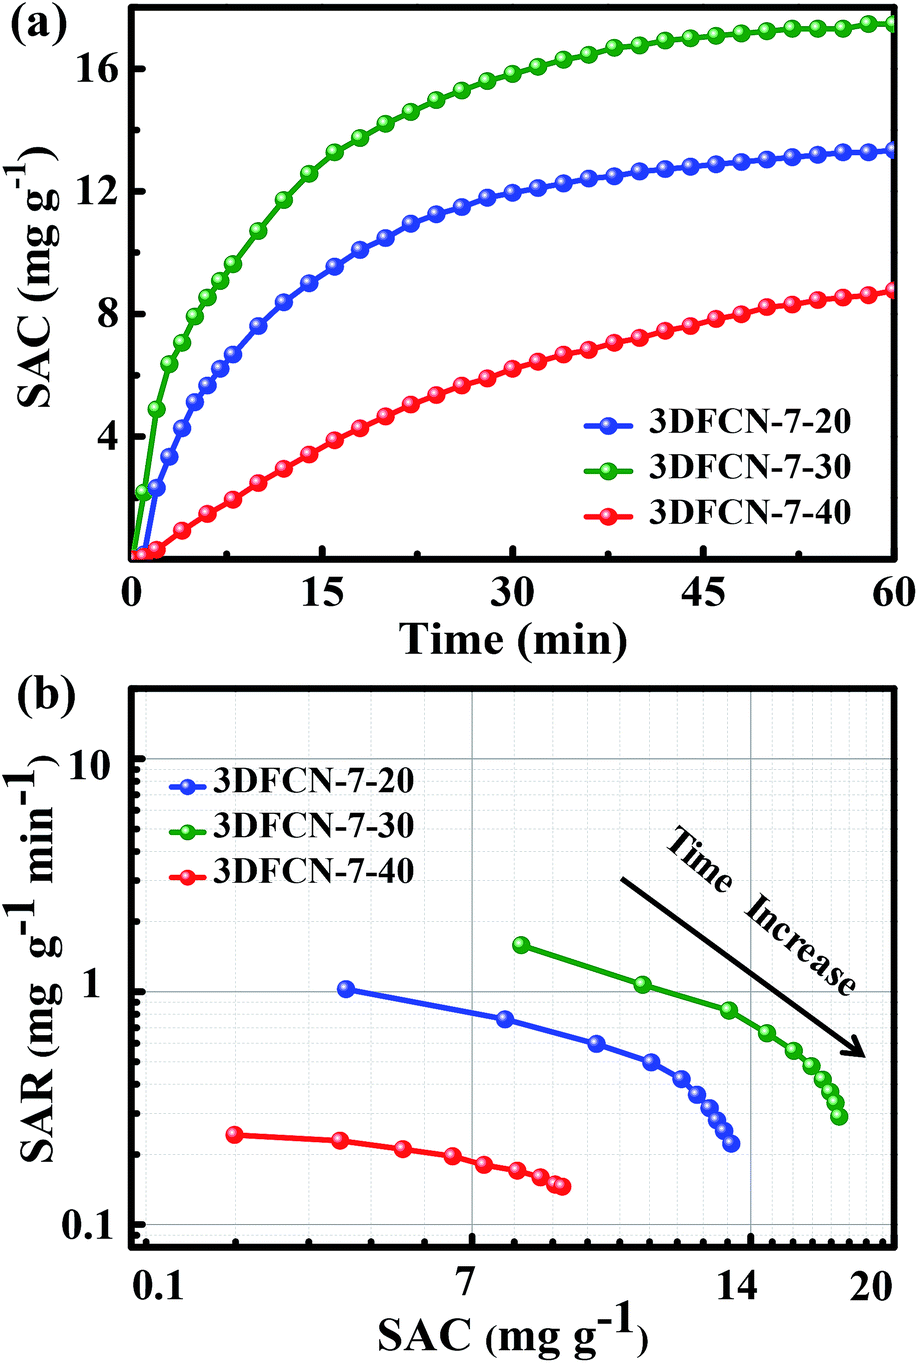 | ||
| Fig. 8 (a) Plots of SAC vs. time and (b) Ragone plots of SAR vs. SAC for the 3DFCN with different template contents in a 500 mg L−1 NaCl solution at 1.4 V. | ||
Ragone plot was a functional method to estimate the overall CDI performance of a system, in which the salt adsorption rate (SAR) vs. SAC is plotted.62 The SAR, as a new rate performance indicator of salt adsorption, is calculated according to the eqn (3). The corresponding Ragone plots of 3DFCN depicted in Fig. 8b present an appreciable change trend. Apparently, 3DFCN-7-30 always has a higher rate and a larger SAC (a shift to the upper and righter region) than that of 3DFCN-7-20 and 3DFCN-7-40. Furthermore, for the two-stage desalination process, the SAR of 3DFCN-7-30 is also higher than that of salt desorption rate (SDR) (Fig. S12†). That's to say, the 3DFCN-7-30 is a better option for rapid deionization with large capacity and high rate. The higher deionization capacity and rate of the 3DFCN-7-30 can be elaborated by the following aspects: (i) the 3D interconnected foam-like nanostructures are well formed, which provide ion transport shortcuts between neighboring pores and reduces the contact resistance; (ii) the ultrathin walls can not only supply minimal resistance of ion diffusion on the electrode interface but also facilitate ion transmission by shortening the diffusive pathways; (iii) the foam-like structures provide much larger available surface area and pore volume, which ensure more accessible adsorption surface for the rapid ion adsorption; (iv) the mesopores of 7 nm provide smooth pathways for ion transportation and enormous available surface to adsorb and storage ions; (v) lower inner resistance of 3DFCN-7-30 can also propel the transportation of ions across the 3D porous networks. Therefore, in combination with the 3D interconnected open structures, the ultrathin walls, high available surface area, the mesoporous structures and low resistance, the 3DFCN-7-30 shows great advantages in CDI application.
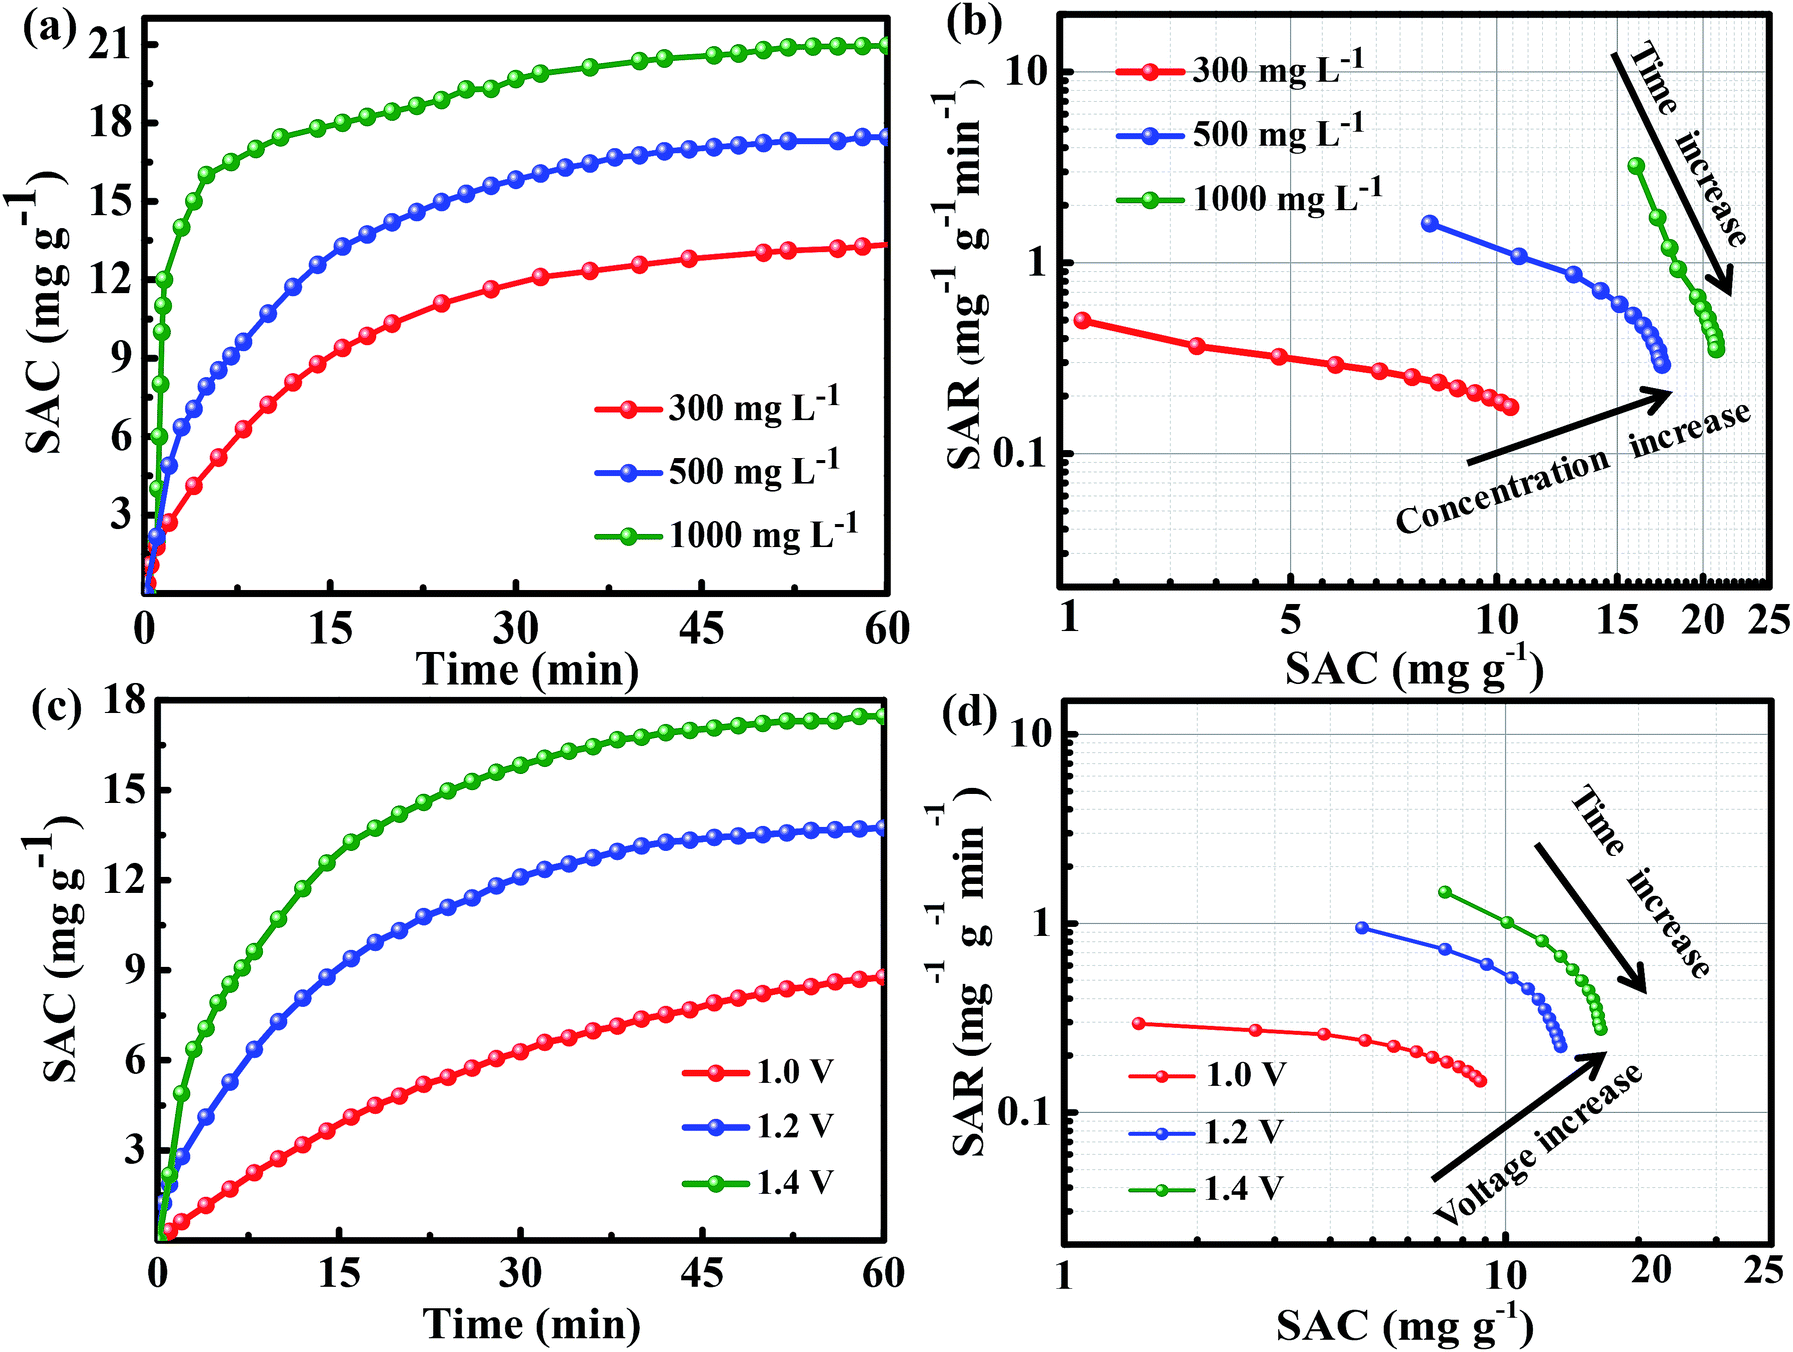
To evaluate the performance of 3DFCN-7-30, a series of CDI measurements were conducted under different salt concentration. The corresponding results are plotted in Fig. 9a. For initial NaCl solution of 300, 500 and 1000 mg L−1, the SAC increases significantly when the external voltage is introduced, then after around 60 min, the adsorption equilibrium can be achieved. The upward trend of SAC at a higher salt concentration is more obvious, demonstrating that more ions are electroabsorbed by the 3DFCN-7-30 electrode. It can be noted that the SAC significantly increased to 20.9 mg g−1 when the concentration increased to 1000 mg L−1. The corresponding Ragone plots are depicted in Fig. 9b. It could be noted that a higher concentration of NaCl solution shifted the Ragone plot to the upper and righter range, suggesting faster SAR and higher SAC. The increase in capacity is mainly because of the formation of compact EDL and the subsequent increase in capacitance in higher concentration.63 In addition, the increased SAR can be simply interpreted by the conductivity enhancement of the influent solution with higher concentration, accelerating swifter transport of ions into the electrodes. In this regard, a higher concentration of salt solution is favorable due to the accessible fast desalination in comparison with a lower salt concentration.
 | ||
| Fig. 9 (a) Plots of SAC vs. time and (b) Ragone plots of SAR vs. SAC for the 3DFCN-7-30 under different concentration of NaCl solution. (c) Plots of SAC vs. time and (d) Ragone plots of SAR vs. SAC for the 3DFCN-7-30 under different external voltages. | ||
The impact of applied voltage on deionization performance was also carefully examined. Fig. 9c depicted the corresponding SAC vs. time plots conducted in 500 mg L−1 NaCl solution under external voltage ranging from 1.0 to 1.4 V. As can be seen, the SAC increases as the time increasing, but the upward tendency of SAC is more apparent at a higher external voltage. It can be noted that the SAC increased from 8.76 to 17.5 mg g−1 when the external voltage ranging from 1.0 to 1.4 V. In Fig. 9d, it can be seen that the corresponding Ragone plot was shifted to upward and righter range when enhancing the external voltage, indicating better desalination capacity and rate. The results demonstrated that at higher applied voltage, the faster desalination and easier ionic adsorption can be conducted due to the stronger coulombic interaction between electrode and charged ions. In this work, at the external applied voltage of 1.4 V, no bubbles were observed due to the intrinsic resistance of the electrodes and solutions, which permits an overvoltage.64,65
The regeneration ability of CDI electrodes is very significant for the practical application. Fig. 10 manifests the long-time adsorption–desorption performance of the 3DFCN-7-30, which are carried out by repeating adsorption (1.4 V) and desorption (0 V) procedure in a NaCl solution with a starting concentration of 100 mg L−1. A direct voltage was applied on the electrodes in the electrosorption charge process while a short-circuit was utilized to desorb the ions. It is obvious that the CDI process was perfectly reproducible. Furthermore, no apparent declination of SAC was observed after 10 cycles, indicating an excellent regeneration performance. This can be attributed to rapid ion transport and shorter diffusion distance in the interconnected open porous structures of 3DFCN-7-30. The superior regeneration performance of the electrodes further verified that the 3DFCN-7-30 is a promising candidate for CDI applications.
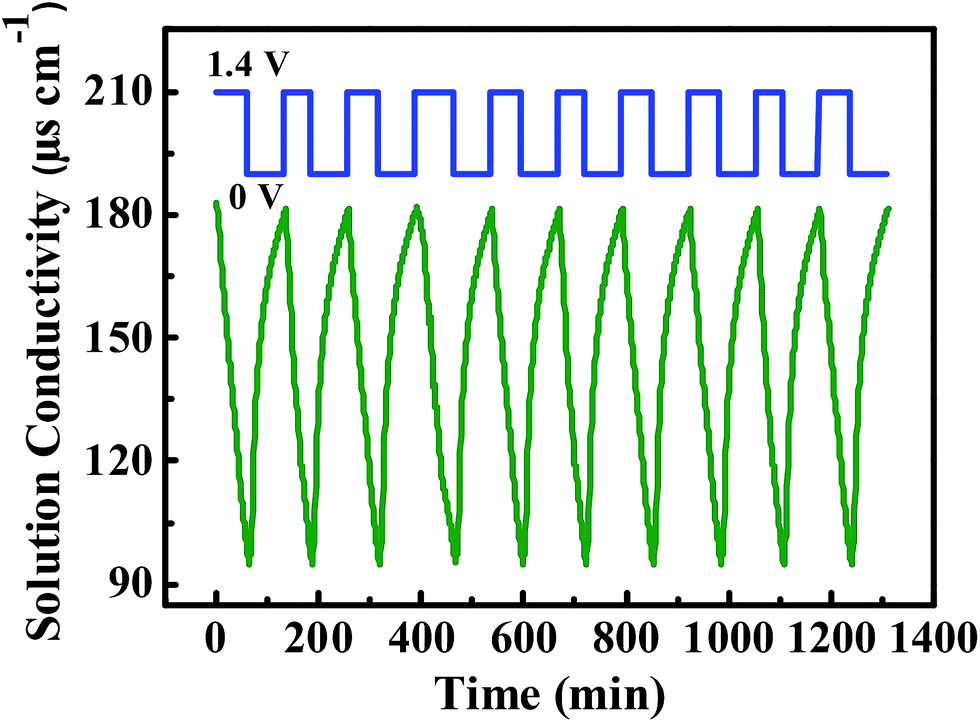 | ||
| Fig. 10 Long-time adsorption–desorption curves of the 3DFCN-7-30 in a 100 mg L−1 NaCl solution at 1.4 V. | ||
4. Conclusions
In this work, pore size-tunable 3D foam-like carbon nanoarchitectures are originally and rapidly fabricated under milder synthetic conditions through the photopolymerization strategy, which can be implemented in several seconds at room temperature to generate nanocomposites compared with conventional strategies. The colloidal silica was utilized to modulate mesopores. The resultant materials demonstrated 3D interconnected open porous structures, ultrathin pore walls, highly accessible SSA, easily adjustable pore size and low internal resistance. When 3DFCN were detected as electrodes for capacitive deionization, they presented higher capacitance, low inner resistance and good stability in the electrochemical measurements. Further, in the deionization tests, an increased adsorption capacity of 20.9 mg g−1 in 1000 mg L−1 was obtained, much higher than that of recently reported carbon materials. The 3DFCN also exhibited high electrosorption rate as well as excellent regeneration ability. Therefore, the rapid construction and intriguing performance of 3DFCN demonstrated that this strategy is potentially exciting in the widespread preparation of high-quality 3D carbon nanoarchitectures for CDI and other electrochemistry applications.Conflicts of interest
There are no conflicts of interest to declare.Acknowledgements
The authors gratefully acknowledge the State Key Research and Development Plan (2017YFB0102200), Science and Technology Commission of Shanghai Municipality (16JC1401700 and 16DZ1204300).References
- M. E. Suss, S. Porada, X. Sun, P. M. Biesheuvel, J. Yoon and V. Presser, Energy Environ. Sci., 2015, 8, 2296–2319 CAS.
- T. P. Barnett, J. C. Adam and D. P. Lettenmaier, Nature, 2005, 438, 303–309 CrossRef CAS PubMed.
- Y. Oren, Desalination, 2008, 228, 10–29 CrossRef CAS.
- S. Porada, L. Weinstein, R. Dash, D. W. A. Van, M. Bryjak, Y. Gogotsi and P. M. Biesheuvel, ACS Appl. Mater. Interfaces, 2012, 4, 1194–1199 CAS.
- F. A. AlMarzooqi, A. A. Al Ghaferi, I. Saadat and N. Hilal, Desalination, 2014, 342, 3–15 CrossRef CAS.
- H. Yin, S. Zhao, J. Wan, H. Tang, L. Chang, L. He, H. Zhao, Y. Gao and Z. Tang, Adv. Mater., 2013, 25, 6270–6276 CrossRef CAS PubMed.
- Y. Wang, Y. Song and Y. Xia, Chem. Soc. Rev., 2016, 45, 5925–5950 RSC.
- S. Porada, R. Zhao, A. van der Wal, V. Presser and P. M. Biesheuvel, Prog. Mater. Sci., 2013, 58, 1388–1442 CrossRef CAS.
- N. Pugazhenthiran, S. Sen Gupta, A. Prabhath, M. Manikandan, J. R. Swathy, V. K. Raman and T. Pradeep, ACS Appl. Mater. Interfaces, 2015, 7, 20156–20164 CAS.
- J. Benson, I. Kovalenko, S. Boukhalfa, D. Lashmore, M. Sanghadasa and G. Yushin, Adv. Mater., 2013, 25, 6625–6632 CrossRef CAS PubMed.
- Z. Xu, J. Wang, Z. Hu, R. Geng and L. Gan, Electrochim. Acta, 2017, 231, 601–608 CrossRef CAS.
- H. Li, L. Zou, L. Pan and Z. Sun, Environ. Sci. Technol., 2010, 44, 8692–8697 CrossRef CAS PubMed.
- Z. Wang, B. Dou, L. Zheng, G. Zhang, Z. Liu and Z. Hao, Desalination, 2012, 299, 96–102 CrossRef CAS.
- C. Nie, L. Pan, H. Li, T. Chen, T. Lu and Z. Sun, J. Electroanal. Chem., 2012, 666, 85–88 CrossRef CAS.
- L. Wang, M. Wang, Z.-H. Huang, T. Cui, X. Gui, F. Kang, K. Wang and D. Wu, J. Mater. Chem., 2011, 21, 18295–18299 RSC.
- M. Haro, G. Rasines, C. Macias and C. Ania, Carbon, 2011, 49, 3723–3730 CrossRef CAS.
- P. Xu, J. E. Drewes, D. Heil and G. Wang, Water Res., 2008, 42, 2605–2617 CrossRef CAS PubMed.
- M. Noked, E. Avraham, Y. Bohadana, A. Soffer and D. Aurbach, J. Phys. Chem. C, 2009, 113, 7316–7321 CAS.
- L. Chang, Y. Yu, X. Duan and W. Liu, Sep. Sci. Technol., 2012, 48, 359–365 CrossRef CAS.
- L. Li, L. Zou, H. Song and G. Morris, Carbon, 2009, 47, 775–781 CrossRef CAS.
- S. Porada, L. Borchardt, M. Oschatz, M. Bryjak, J. Atchison, K. Keesman, S. Kaskel, P. Biesheuvel and V. Presser, Energy Environ. Sci., 2013, 6, 3700–3712 CAS.
- L. Chang, J. Li, X. Duan and W. Liu, Electrochim. Acta, 2015, 176, 956–964 CrossRef CAS.
- Y. Wimalasiri and L. Zou, Carbon, 2013, 59, 464–471 CrossRef CAS.
- X. T. Xu, Y. Liu, T. Lu, Z. Sun, D. H. C. Chua and L. K. Pan, J. Mater. Chem. A, 2015, 3, 13418–13425 CAS.
- H. Wang, L. Shi, T. Yan, J. Zhang, Q. Zhong and D. Zhang, J. Mater. Chem. A, 2014, 2, 4739–4750 CAS.
- J. Lee, J. Kim and T. Hyeon, Adv. Mater., 2006, 18, 2073–2094 CrossRef CAS.
- A. Stein, Z. Wang and M. A. Fierke, Adv. Mater., 2009, 21, 265–293 CrossRef CAS.
- Y. Zhai, Y. Dou, D. Zhao, P. F. Fulvio, R. T. Mayes and S. Dai, Adv. Mater., 2011, 23, 4828–4850 CrossRef CAS PubMed.
- Y. Deng, Y. Cai, Z. Sun, J. Liu, C. Liu, J. Wei, W. Li, C. Liu, Y. Wang and D. Zhao, J. Am. Chem. Soc., 2010, 132, 8466–8473 CrossRef CAS PubMed.
- A. Dorjgotov, J. Ok, Y. K. Jeon, S. H. Yoon and Y. G. Shul, Appl. Catal., B, 2012, 93, 156–165 Search PubMed.
- G. P. Mane, S. N. Talapaneni, C. Anand, S. Varghese, H. Iwai, Q. Ji, K. Ariga, T. Mori and A. Vinu, Adv. Funct. Mater., 2012, 22, 3596–3604 CrossRef CAS.
- T. A. Silva, H. Zanin, P. W. May, E. J. Corat and O. Fatibellofilho, ACS Appl. Mater. Interfaces, 2014, 6, 21086–21092 CAS.
- K. Ariga, A. Vinu, Q. Ji, O. Ohmori, J. P. Hill, S. Acharya, J. Koike and S. Shiratori, Angew. Chem., Int. Ed., 2008, 47, 7254–7257 CrossRef CAS PubMed.
- J. Wei, D. Zhou, Z. Sun, Y. Deng, Y. Xia and D. Zhao, Adv. Funct. Mater., 2013, 23, 2322–2328 CrossRef CAS.
- J. Zhi, W. Zhao, X. Liu, A. Chen, Z. Liu and F. Huang, Adv. Funct. Mater., 2014, 24, 2013–2019 CrossRef CAS.
- L. Chao, Z. Liu, G. Zhang, X. Song, X. Lei, M. Noyong, U. Simon, Z. Chang and X. Sun, J. Mater. Chem. A, 2015, 3, 12730–12737 CAS.
- X. Wen, D. Zhang, L. Shi, T. Yan, H. Wang and J. Zhang, J. Mater. Chem., 2012, 22, 23835–23844 RSC.
- D. Zhang, X. Wen, L. Shi, T. Yan and J. Zhang, Nanoscale, 2012, 4, 5440–5446 RSC.
- H. Duan, T. Yan, G. Chen, J. Zhang, L. Shi and D. Zhang, Chem. Commun., 2017, 53, 7465–7468 RSC.
- P. Chen, L.-K. Wang, G. Wang, M.-R. Gao, J. Ge, W.-J. Yuan, Y.-H. Shen, A.-J. Xie and S.-H. Yu, Energy Environ. Sci., 2014, 7, 4095–4103 CAS.
- C. Liang, Z. Li and S. Dai, Angew. Chem., Int. Ed., 2008, 47, 3696–3717 CrossRef CAS PubMed.
- H. W. Liang, X. Zhuang, S. Bruller, X. Feng and K. Mullen, Nat. Commun., 2014, 5, 4973–4979 CrossRef CAS PubMed.
- Y. Deng, J. Wei, Z. Sun and D. Zhao, Chem. Soc. Rev., 2013, 42, 4054–4070 RSC.
- S. M. Alatalo, K. Qiu, K. Preuss, A. Marinovic, M. Sevilla, M. Sillanpää, X. Guo and M. M. Titirici, Carbon, 2016, 96, 622–630 CrossRef CAS.
- M. Graglia, J. Pampel, T. Hantke, T. P. Fellinger and D. Esposito, ACS Nano, 2016, 10, 4364–4371 CrossRef CAS PubMed.
- G. Wang, Y. Sun, D. Li, H. W. Liang, R. Dong, X. Feng and K. Mullen, Angew. Chem., 2015, 127, 15406–15411 CrossRef.
- J. Wei, Q. Yue, Z. Sun, Y. Deng and D. Zhao, Angew. Chem., 2012, 124, 6253–6257 CrossRef.
- R. Liu, Y. Shi, Y. Wan, Y. Meng, F. Zhang, D. Gu, Z. Chen, B. Tu and D. Zhao, J. Am. Chem. Soc., 2006, 128, 11652–11662 CrossRef CAS PubMed.
- X. Wu, L. Jiang, C. Long and Z. Fan, Nano Energy, 2015, 13, 527–536 CrossRef CAS.
- C. C. Jianhua Hou, F. Idrees and X. Ma, ACS Nano, 2015, 9, 2556–2564 CrossRef PubMed.
- J. Schuster, G. He, B. Mandlmeier, T. Yim, K. T. Lee, T. Bein and L. F. Nazar, Angew. Chem., Int. Ed., 2012, 51, 3591–3595 CrossRef CAS PubMed.
- D. Zhou, Y. Cui, P. W. Xiao, M. Y. Jiang and B. H. Han, Nat. Commun., 2014, 5, 4716–4722 CrossRef CAS PubMed.
- M. Liu, X. Ma, L. Gan, Z. Xu, D. Zhu and L. Chen, J. Mater. Chem. A, 2014, 2, 17107–17114 CAS.
- L. Miao, H. Duan, M. Liu, W. Lu, D. Zhu, T. Chen, L. Li and L. Gan, Chem. Eng. J., 2017, 317, 651–659 CrossRef CAS.
- Z.-L. Wang, D. Xu, H.-G. Wang, Z. Wu and X.-B. Zhang, ACS Nano, 2013, 7, 2422–2430 CrossRef CAS PubMed.
- Z. Lei, N. Christov and X. S. Zhao, Energy Environ. Sci., 2011, 4, 1866–1873 CAS.
- W. Kong, X. Duan, Y. Ge, H. Liu, J. Hu and X. Duan, Nano Res., 2016, 9, 2458–2466 CrossRef CAS.
- C. Tsouris, R. Mayes, J. Kiggans, K. Sharma, S. Yiacoumi, D. DePaoli and S. Dai, Environ. Sci. Technol., 2011, 45, 10243–10249 CrossRef CAS PubMed.
- H. Wang, L. Zhi, K. Liu, L. Dang, Z. Liu, Z. Lei, C. Yu and J. Qiu, Adv. Funct. Mater., 2015, 25, 5420–5427 CrossRef CAS.
- Y. Liu, T. Chen, T. Lu, Z. Sun, D. H. C. Chua and L. Pan, Electrochim. Acta, 2015, 158, 403–409 CrossRef CAS.
- Y. Xu, Z. Lin, X. Zhong, X. Huang, N. O. Weiss, Y. Huang and X. Duan, Nat. Commun., 2014, 5, 4554–4561 CAS.
- R. Zhao, O. Satpradit, H. Rijnaarts, P. Biesheuvel and A. Van der Wal, Water Res., 2013, 47, 1941–1952 CrossRef CAS PubMed.
- X. Xu, Y. Liu, M. Wang, C. Zhu, T. Lu, R. Zhao and L. Pan, Electrochim. Acta, 2016, 193, 88–95 CrossRef CAS.
- H. Lei, T. Yan, H. Wang, L. Shi, J. Zhang and D. Zhang, J. Mater. Chem. A, 2015, 3, 5934–5941 CAS.
- P. Długołęcki and A. V. D. Wal, Environ. Sci. Technol., 2013, 47, 4904–4910 CrossRef PubMed.
Footnotes |
| † Electronic supplementary information (ESI) available: The details of additional photograph and TG for nanocomposites; TEM of 3DFCN-12 and 3DFCN-16 with different template content; TEM and N2 adsorption–desorption isotherms of 3DFCN from other precursors; CV and GCD curves of 3DFCN with different pore size; cycling stability of 3DFCN-7-30; plots of SAC vs. time of 3DFCN with different pore size; current transient plots of 3DFCN-7-30; plots of SAR vs. time and salt desorption rate (SDR) vs. time for the 3DFCN-7-30; the comparison of the salt adsorption capacity among various carbon electrode materials from the literature. See DOI: 10.1039/c7ra04613h |
| ‡ These authors contributed equally to this work. |
| This journal is © The Royal Society of Chemistry 2017 |