 Open Access Article
Creative Commons Attribution 3.0 Unported Licence
Sol–gel-processed amorphous inorganic lithium ion electrolyte thin films: sol chemistry
Zhangfeng Zhenga,
Yubin Zhanga,
Shidong Songb and
Yan Wang *a
*a
aDepartment of Mechanical Engineering, Worcester Polytechnic Institute, 100 Institute Road, Worcester, MA 01609, USA. E-mail: yanwang@wpi.edu; Fax: +1-508-831-5178; Tel: +1-508-831-5453
bSchool of Environment & Chemical Engineering, Tianjin Polytechnic University, Tianjin 300387, China
First published on 12th June 2017
Abstract
Amorphous lithium lanthanum titanium oxide (LLTO) is a promising inorganic solid electrolyte for all-solid-state lithium ion batteries. Preparation of amorphous LLTO using a sol–gel process has been reported. Sol chemistry is vital. In this study, two different sol synthetic strategies, all-alkoxide and acetate–alkoxide routes, were employed to prepare amorphous LLTO thin films. XRD and TEM results show that thin films derived from these two routes are amorphous. SEM results indicate that these thin films are dense and crack-free, but there are differences in their surface morphology. The ionic transport properties of the thin films were measured. The ionic conductivity of the thin film from the all-alkoxide route is almost two orders higher than that from the acetate–alkoxide route. This striking difference results from different sol chemistries. The value 0.36 eV was determined as the activation energy of lithium ion conduction in the thin film from the all-alkoxide route in the temperature range 30–90 °C.
1. Introduction
All-solid-state lithium ion batteries are recognized as next-generation high-energy batteries because of their improved safety and reliability, high energy density, very long cycle life and excellent storage stability.1,2 Inorganic solid electrolytes replace liquid ones, reducing, if not eliminating, the fire (or explosion) risk associated with flammable organic liquid electrolytes. Currently, lithium phosphorus oxy-nitride (LiPON) based solid-state thin film batteries are commercialized.3 However, LiPON has quite low ionic conductivity (∼10−6 S cm−1).4 The major challenge for all-solid-state lithium ion batteries still is to develop inorganic solid electrolytes with high ionic conductivity and good stability against both electrodes, especially metallic lithium. Among all possible anode materials, lithium is the most attractive because of its favorable thermodynamic electrode potential and high specific capacity.Perovskite Li3xLa2/3−xTiO3 (LLTO) is a promising inorganic solid electrolyte due to its high bulk ionic conductivity (10−3 S cm−1 at room temperature), negligible electronic conductivity, non-hygroscopic feature.5 However, crystalline LLTO is unstable in contact with lithium metal. LLTO undergoes lithium insertion and Ti4+ reduce to Ti3+, resulting in high electronic conductivity.6,7 Eventually crystalline LLTO turns into an electronic conductor. Furthermore, perovskite LLTO has relative high grain boundary resistance, lowering the effective ionic conductivity (less than 1 × 10⁻⁴ S cm−1).5,6,8
To overcome these two issues, amorphous LLTO was investigated. Fortunately, it shows advantages over its crystalline counterpart. Amorphous LLTO is compatible with lithium metal, which makes lithium as anode possible.9 Although Ti4+ to Ti3+ reduction still accompanies lithium insertion into amorphous LLTO, its local atomic disorder is considered to localize the electronic states. Amorphous LLTO thin film prepared by pulsed laser deposition (PLD) exhibits higher ionic conductivity (8.94 × 10⁻⁴ S cm−1) than the crystalline counterpart.10 Moreover, amorphous LLTO has a wide electrochemical stability window because of its open disordered structure,9 opening a pathway for high-voltage cathode materials, such as LiNi0.5Mn1.5O4 (LNMO) spinel.11
Amorphous LLTO thin films have been prepared by vacuum-based methods, such as PLD, e-beam evaporation, and RF magnetron sputtering.12–15 Recently, we successfully prepared amorphous LLTO thin films by sol–gel process.16,17 Preparation of thin film by sol–gel process includes following five steps: synthesizing an appropriate sol, coating the sol onto a substrate, drying wet gel film, firing the dried gel film to completely remove organic components, and annealing the fired film to obtain a desired thin film. The desired film is either amorphous or crystalline, depending on the annealing temperature and time.17 The crucial part in the sol–gel process is the synthesis of an appropriate sol. Metallo-organic compounds, such as metal carboxylates and alkoxides, are usually used as precursors because their solubility in polar or non-polar solvents can be tuned by modifying the organic part of the molecule, and the organic moiety burns out in oxidizing ambient atmosphere without residue.18 Sol chemistry is vital because the physicochemical properties of the sol significantly affect the microstructure and properties of sol–gel processed thin films.19–21
So far, many different synthetic routes to prepare sols have been employed, such as all-alkoxide, acetate–alkoxide, nitride, and pechini routes.22–26 However, only all-alkoxide route was used to prepare amorphous LLTO thin film. There is a pressing need for exploring other routes for sol–gel processed amorphous LLTO. Among various routes, the acetate–alkoxide one has been widely used. In this work, we employ two different sol chemistries to prepare amorphous LLTO thin films and characterize their ionic transport properties.
2. Experimental
Two different sol synthetic strategies, all-alkoxide and acetate–alkoxide routes, were used to prepare LLTO thin films with a nominal composition Li0.35La0.55TiO3. To compensate for lithium loss during heat treatment, 10 mol% excess lithium precursor was added. Both routes were described in the flow chart of Fig. 1. The first route is all-alkoxide, which was based on what developed in our previous work.16 Titanium isopropoxide (97%), and lithium isopropoxide (99.9%) were completely dissolved in lanthanum 2-methoxyethoxide (99.9%) solution with 2-methoxyethanol (99.5%) as solvent. The resultant solution was refluxed at 70 °C for 2 h in Ar atmosphere (H2O <0.1 ppm, and O2 <0.1 ppm). In the second route, only titanium precursor is alkoxide. Lithium acetate dehydrate (99%), lanthanum acetate hydrate (99.9%), and titanium isopropoxide were Li, La and Ti precursors, respectively. Li and La precursors was dissolved in a 1![[thin space (1/6-em)]](https://www.rsc.org/images/entities/char_2009.gif) :
:![[thin space (1/6-em)]](https://www.rsc.org/images/entities/char_2009.gif) 2 mixture of acetic and propionic acid (99%) at 50 °C. Titanium isopropoxide was chelated with acetic acid in Ar atmosphere to prevent oxidation of the Ti source. Then the two solutions were mixed and stirred for 2 h. The resulting sol was diluted with 2-propanol (99.5%) to a desired concentration. The concentrations of Li, La, and Ti precursors are same in the sols from two different routes.
2 mixture of acetic and propionic acid (99%) at 50 °C. Titanium isopropoxide was chelated with acetic acid in Ar atmosphere to prevent oxidation of the Ti source. Then the two solutions were mixed and stirred for 2 h. The resulting sol was diluted with 2-propanol (99.5%) to a desired concentration. The concentrations of Li, La, and Ti precursors are same in the sols from two different routes.
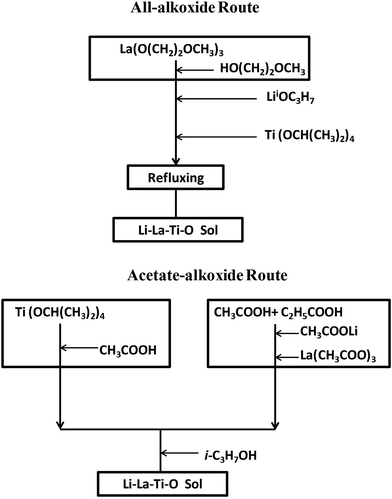 | ||
| Fig. 1 Two different synthetic strategies for the preparation of Li–La–Ti–O sol: all-alkoxide and acetate–alkoxide routes. | ||
R-Plane (1![[1 with combining macron]](https://www.rsc.org/images/entities/char_0031_0304.gif) 02) sapphire substrates (Valley design, USA) were used to prepare LLTO thin film. These substrates were cleaned in piranha solution (aq-H2SO4
02) sapphire substrates (Valley design, USA) were used to prepare LLTO thin film. These substrates were cleaned in piranha solution (aq-H2SO4![[thin space (1/6-em)]](https://www.rsc.org/images/entities/char_2009.gif) :
:![[thin space (1/6-em)]](https://www.rsc.org/images/entities/char_2009.gif) aq-H2O2 = 3
aq-H2O2 = 3![[thin space (1/6-em)]](https://www.rsc.org/images/entities/char_2009.gif) :
:![[thin space (1/6-em)]](https://www.rsc.org/images/entities/char_2009.gif) 1) for 1 h, then ultrasonically immersed into acetone for 0.5 h and subsequently rinsed with D.I. water for 0.5 h. The substrates were dried with Ar gas.
1) for 1 h, then ultrasonically immersed into acetone for 0.5 h and subsequently rinsed with D.I. water for 0.5 h. The substrates were dried with Ar gas.
LLTO wet gel films were deposited on sapphire substrates by spin coating at 3000 revolutions per minute (rpm) for 30 seconds in ambient air, and dried on a hot plate held at 80 °C for 15 minutes in air immediately. Subsequently, the gel films were fired at 350 °C and then annealed at higher temperatures in a furnace. In order to obtain the desired thickness, the whole process, including coating, drying and firing, was repeated multiple times. Film thickness and morphology of the LLTO thin films were characterized with JEOL JSM-7000F field emission scanning electron microscope (SEM) equipped with energy dispersive X-ray spectroscopy in both plane and cross-section views.
X-ray diffraction (XRD) measurements were carried out with X'Pert PRO system (PANalytical, Germany) to determine the microstructure of LLTO thin films. It was operated in the 2θ range of 20–80 degree. A X'Celerator detector (PANalytical Germany) with a Ni filter was employed in Bragg–Brentano geometry with Cu Kα radiation. For TEM examination, the sample was prepared by coating amorphous LLTO thin film on a carbon-coated copper grid. The sample was analyzed by JEOL 2010 transmission electron microscope (TEM).
Amorphous LLTO thin film samples were dissolved in hot hydrochloric acid with a small amount of hydrogen peroxide. Compositions of the thin film were determined by an inductively coupled plasma spectroscopy (ICP) and an atomic absorption spectroscopy (AAS). ICP was used for lanthanum and titanium concentrations, and lithium concentration was determined by AAS.
The ionic conductivities of LLTO thin films were characterized with electrochemical impedance spectroscopy (EIS) in Ar atmosphere. For EIS measurements, Au electrodes were sputtered on LLTO thin films through a mask with two slits parallel to each other by a vacuum deposition method. The details of the experimental setup were described elsewhere.16 The samples were put into a specialized air-tight sample container to make sure that no moisture absorption could take place and hence affect the data reproducibility. The impedance measurements were carried out at a temperature range by a galvanostat/potentiostat/impedance analyzer (Bio-logic VMP3) with a low current board from 0.1 Hz to 200 kHz using a 100 mV ac signal. Impedance data evaluation and simulation were performed with Z fit.
3. Results and discussions
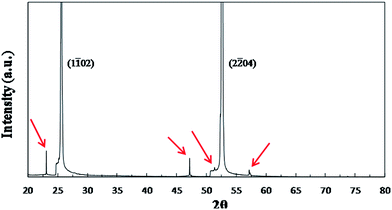
Thin films were successfully prepared by dispensing sols from two different synthetic routes through 0.2 μm filters and spin-coating it onto the sapphire substrates, drying, firing, and annealing at 500 °C for 10 min. For annealing, rapid heating and quenching were employed to avoid film crystallization during heating and cooling. These thin films were examined by XRD and TEM. The thin films made from the two routes have the same XRD pattern as shown in Fig. 2. There are two very strong peaks in the pattern, which correspond to (1![[1 with combining macron]](https://www.rsc.org/images/entities/char_0031_0304.gif) 02)sapphire and (2
02)sapphire and (2![[2 with combining macron]](https://www.rsc.org/images/entities/char_0032_0304.gif) 04)sapphire reflections in agreement with the results obtained by other researchers.27 Moreover, when the pattern is zoomed in, four much less intense peaks marked by red arrows are observed. These four peaks also correspond to sapphire's reflections. The XRD results confirmed that these thin films are amorphous, consistent with our previous results.16
04)sapphire reflections in agreement with the results obtained by other researchers.27 Moreover, when the pattern is zoomed in, four much less intense peaks marked by red arrows are observed. These four peaks also correspond to sapphire's reflections. The XRD results confirmed that these thin films are amorphous, consistent with our previous results.16
To further investigate the microstructure of the thin films, TEM examination was conducted. The TEM images of the thin films from the two routes are quite similar. Fig. 3 shows the image. In the TEM image, there is only featureless microstructure, random atomic structure. A fast Fourier transform pattern of the thin films is inset in the upper-right corner, which only has several rings. There is no ordered domain in the films. So, these thin films are confirmed to be amorphous in nature, in agreement with the XRD results.
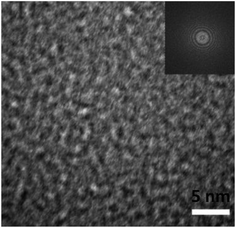 | ||
| Fig. 3 TEM image of the thin films. The fast Fourier transform pattern for the thin films is shown in the upper right inset. | ||
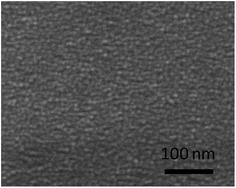
The surface morphology of the amorphous thin films derived from the two sol chemistries was examined by SEM. The SEM images of the thin films were shown in Fig. 4. Although these thin films are dense and crack-free, there are evident differences in the surface observation. The amorphous thin film made from the all-alkoxide route looks smoother than that from the acetate–alkoxide one. Given that the final four steps (coating, drying, firing and annealing) in the sol–gel process are the same, the differences are likely to related to the sols prepared by the different routes. For the all-alkoxide route, a key reaction is the alcohol exchange reaction which takes places between titanium isopropoxide (lithium isopropoxide) and the solvent 2-methoxyethanol, resulting in a decrease in the hydrolysis sensitivity of these starting materials. In general, the alcohol exchange reactions are incomplete, i.e. 2-methoxyethoxy group cannot completely substitute isopropoxy group. Another key reaction is that the species in solution form oligomers upon refluxing because alkoxy groups can bridge different metal atoms via ether elimination, formation of heteroalkoxides. The oligomers in the sol are alkoxides in nature. SEM images of dried gel films show that the size of these oligomers is a few nanometers as shown in Fig. 5. The dried gel films, xerogels, were formed as the solvent rapidly evaporated from the wet gel film during drying, resulting in collapse of gel three-dimension network structure which the oligomers interconnected to form. For the acetate–alkoxide route, titanium isopropoxide reacts with acetic acid to form oligomers. This chelation reaction also serves to decrease the hydrolysis sensitivity of titanium isopropoxide. Lithium acetate and lanthanum acetate either incorporate into the oligomers by the reaction of ether-elimination between lithium acetate (lanthanum acetate) and titanium isopropoxide,28 or are absorbed into the Ti-oligomers.18 The oligomers in the sol from the acetate–alkoxide route are iso-propylacetate, different from those in the sol from the all-alkoxide route. The difference in the sol chemistry may significantly affect the microstructure and thus properties of the thin films because evolution of the dried gel film during the heat treatment is separate from each other.
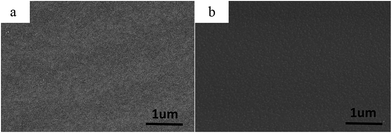 | ||
| Fig. 4 Surface morphology of LLTO thin films from the two different routes observed by SEM. (a) From the all-alkoxide route; (b) from the acetate–alkoxide route. | ||
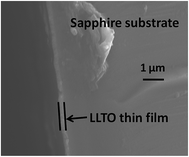
SEM was employed to determine the thickness of the amorphous thin films from the all-alkoxide and acetate–alkoxide routes. There are no significant differences in the SEM cross-sectional views of the films. Both films have thickness of ∼0.25 μm. Fig. 6 shows a representative SEM cross-sectional view of a thin film. The thin films were prepared by repeating the coating, drying and firing 5 times.
The Li, La, and Ti contents in the samples are quite similar based on ICP and AAS results, from which the calculated compositions of the samples from the two different routes may be expressed as Li0.32La0.51TiO2.93. Given that sols from two different routes have the same concentrations in Li, La, and Ti precursor, and the films undergo the same heat treatments, it is reasonable that the contents of Li, La, and Ti are quite similar in the LLTO samples.
Fig. 7 shows representative Nyquist plots of complex impedance for the amorphous thin films from the two different routes measured at 30 °C. The spectra consist of only a part of one semicircle. As discussed in our previous work,16 the arc in the low-frequency side is associated with the electrode-film interfacial properties, while the arc in the high frequency region is attributed to the lithium ionic conduction in the thin film. To determine the dc conductivities of the amorphous thin films, the impedance response was modeled with a fitting equivalent circuit, as shown in Fig. 8. The thin film response (the high frequency semicircle) was modeled by using a resistor (R) in parallel with a constant phase element (CPE). A Warburg element was used to describe the electrode related contributions for the impedance spectra. The experimental data was fitted with the mentioned circuit by Z fit. The dc ionic conductivities were calculated from these resistances. The ionic conductivities of the amorphous LLTO thin film were obtained by the classical equation:
 | (1) |
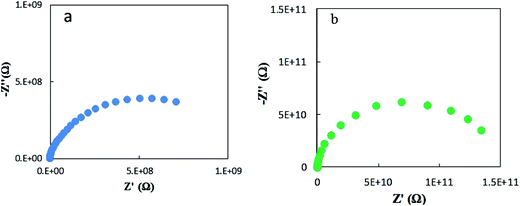 | ||
| Fig. 7 Typical Nyquist plots for amorphous thin films from the two different routes at 30 °C. (a) From the all-alkoxide route; (b) from the acetate–alkoxide route. | ||
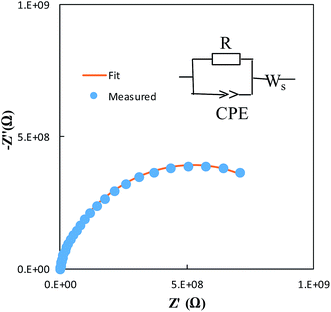 | ||
| Fig. 8 Modeled fit for the Nyquist plot of the amorphous thin film from the all-alkoxide route in comparison with experimental data. | ||
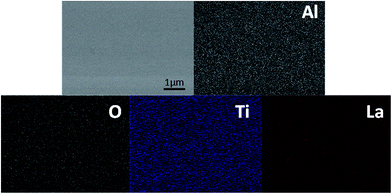
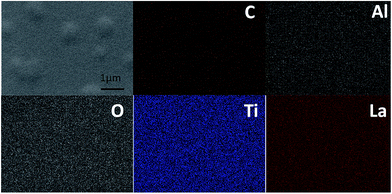
The ionic conductivity of the thin film from the all-alkoxide route is almost two orders higher than from the acetate–alkoxide route. The striking difference in the ionic conductivities is related to decomposition and rearrangement of two dried gel films during the heat treatment. As shown in Fig. 5, the dried gel films from all-alkoxide and acetate–alkoxide routes are composed of oligomers, and very dense. As discussed above, the oligomers in the sol from all-alkoxide route are alkoxide, while those in the sol from the acetate are iso-propylacetate. The thermal decomposition mechanism of alkoxide compounds is different from that of acetate ones. It is widely accepted that alkoxides undergo one-step decomposition mechanism, whereas acetates two-step one.18 The decomposition of acetate precursors leads to carbonate and acetone, followed by decomposition of carbonate to oxide and carbon dioxide.29 Therefore, after firing, the fired thin films from the all-alkoxide route are amorphous oxide phase. For the films from the acetate–alkoxide route, amorphous carbonate intermediate phase was obtained. Elemental mapping obtained with energy dispersive X-ray spectroscopy (EDS) were employed for confirmation. Fig. 9 depicts an example of the fired thin film derived from all-alkoxide route. Ti, La, Al and O elements are detected. The EDS detector cannot detect presence of elements with atomic number less than 5. Therefore, Li element cannot be detected. Al element is attributed to the sapphire substrate. No carbon is detected. However, carbon is detected in the fired thin film processed from acetate–alkoxide route as shown in Fig. 10. This suggests that the thin film from the acetate–alkoxide route is not pure amorphous oxide phase, containing carbonate species.
The fired thin films were annealed at 500 °C for 10 min. Elemental mapping was also conducted for both annealed thin films. The results are similar as fired thin films. Carbon is still detected in the thin film from the acetate–alkoxide route. This shows that when annealed, the intermediate phase cannot be decomposed, and thus pure amorphous oxide phase is not obtained. Therefore, after annealed, the annealed films prepared from the all-alkoxide route are amorphous oxide phase, while the films made from the acetate–alkoxide route are amorphous intermediate phase. The different phases in the films from the two routes could be attributed to the striking difference in ionic conductivities. The acetate–alkoxide route may not be suitable for preparation of amorphous LLTO.
Impedance spectra were collected over the temperature range of 30 °C to 90 °C in 20 °C increments for the sample from the all-alkoxide route to assess the temperature dependence of conductivity. Individual impedance spectra were modeled to fit the equivalent circuit described above to determine the conductivities. The temperature dependence of dc conductivity for various temperatures is shown in Fig. 11. The temperature dependence of conductivity was found to follow an Arrhenius equation:
 | (2) |
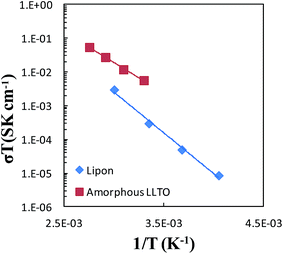 | ||
| Fig. 11 Arrhenius plot for the lithium-ion conductivity of amorphous LLTO compared with data for LiPON.4 | ||
Temperature-dependent ionic conductivities of LiPON solid electrolyte are also shown in Fig. 11. The performance of the amorphous LLTO thin film electrolyte compares favorably with LiPON, with substantially greater conductivities than LiPON.
4. Conclusion
Two different synthetic strategies, all-alkoxide and acetate–alkoxide routes, were employed to prepare amorphous LLTO thin films. XRD and TEM results confirmed that the resultant thin films made from the two routes are amorphous. SEM images showed that although they are dense and crack-free, the films prepared from the two routes have different surface morphologies which are related to different sol chemistries. The oligomers in the sol from all-alkoxide are alkoxides in nature, while those in the sol from the acetate–alkoxide route are iso-propylacetate. The ionic conductivity of the amorphous LLTO thin film made from the all-alkoxide route is 1.78 × 10⁻⁵ S cm−1 at 30 °C, while that of the film prepared from the acetate–alkoxide route is 1.86 × 10⁻⁷ S cm−1. The striking difference in the ionic conductivities is probably attributed to different thermal decomposition mechanisms, resulting in different phases in the amorphous films from the two routes. The alkoxides undergo one-step decomposition mechanism, whereas the acetates two-step one via carbonate formation. The acetate–alkoxide route is not suitable for preparation of amorphous LLTO because only amorphous intermediate phase with high carbonate content is obtained. The value 0.36 eV was determined as the activation energy of lithium ion conduction in the amorphous LLTO thin film prepared from the all-alkoxide route in the temperature range 30–90 °C.Acknowledgements
This work is financially supported by National Science Foundation (NSF) Division of Materials Research (DMR)-1608398.References
- J. N. Mrgudich, J. Electrochem. Soc., 1960, 107, 475–479 CrossRef CAS.
- B. B. Owens and P. M. Skarstad, Solid State Ionics, 1992, 53–56, 665–672 CrossRef CAS.
- J. Li, C. Ma, M. Chi, C. Liang and N. J. Dudney, Adv. Energy Mater., 2015, 5, 1401408 CrossRef.
- X. Yu, J. B. Bates, G. E. Jellison and F. X. Hart, J. Electrochem. Soc., 1997, 144, 524–532 CrossRef CAS.
- Y. Inaguma, L. Chen, M. Itoh and T. Nakamura, Solid State Commun., 1993, 86, 689–693 CrossRef CAS.
- Y. Inaguma, Y. Matsui, Y. J. Shan, M. Itoh and T. Nakamura, Solid State Ionics, 1995, 79, 91–97 CrossRef CAS.
- C. Chen and K. Amine, Solid State Ionics, 2001, 144, 51–57 CrossRef CAS.
- A. Mei, X. L. Wang, Y. C. Feng, S. J. Zhao, G. J. Li, H. X. Geng, Y. H. Lin and C. W. Nan, Solid State Ionics, 2008, 179, 2255–2259 CrossRef CAS.
- Z. Zheng, H. Fang, Z. Liu and Y. Wang, J. Electrochem. Soc., 2015, 162, A244–A248 CrossRef CAS.
- S. Furusawa, H. Tabuchi, T. Sugiyama, S. Tao and J. T. Irvine, Solid State Ionics, 2005, 176, 553–558 CrossRef CAS.
- J. Z. Lee, Z. Wang, H. L. Xin, T. A. Wynn and Y. S. Meng, J. Electrochem. Soc., 2017, 164, A6268–A6273 CrossRef CAS.
- J. K. Ahn and S. G. Yoon, Electrochim. Acta, 2004, 50, 371–374 CrossRef CAS.
- O. Maqueda, F. Sauvage, L. Laffont, M. Martínez-Sarrión, L. Mestres and E. Baudrin, Thin Solid Films, 2008, 516, 1651–1655 CrossRef CAS.
- C. L. Li, B. Zhang and Z. W. Fu, Thin Solid Films, 2006, 515, 1886–1892 CrossRef CAS.
- Y. Xiong, H. Tao, J. Zhao, H. Cheng and X. Zhao, J. Alloys Compd., 2011, 509, 1910–1914 CrossRef CAS.
- Z. Zheng, H. Fang, F. Yang, Z. Liu and Y. Wang, J. Electrochem. Soc., 2014, 161, A473–A479 CrossRef CAS.
- Z. Zheng, S. Song and Y. Wang, Solid State Ionics, 2016, 287, 60–70 CrossRef CAS.
- R. W. Schwartz, T. Schneller and R. Waser, C. R. Chim., 2004, 7, 433–463 CrossRef CAS.
- A. H. Carim, B. A. Tuttle, D. H. Doughty and S. L. Martinez, J. Am. Ceram. Soc., 1991, 74, 1455–1458 CrossRef CAS.
- S. J. Lockwood, R. W. Schwartz, B. A. Tuttle and E. V. Thomas, Mater. Res. Soc. Symp. Proc., 1993, 310, 275–300 CrossRef CAS.
- Y. Shimizu, K. Udayakumar and L. E. Cross, J. Am. Ceram. Soc., 1991, 74, 3023–3027 CrossRef CAS.
- B. Antoniassi, A. H. M. González, S. L. Fernandes and C. F. O. Graeff, Mater. Chem. Phys., 2011, 127, 51–55 CrossRef CAS.
- C. Bohnke, B. Regrag, F. Le Berre, J. L. Fourquet and N. Randrianantoandro, Solid State Ionics, 2005, 176, 73–80 CrossRef CAS.
- S. Kobylyanskaya, O. Gavrilenko and A. Belous, Russ. J. Inorg. Chem., 2013, 58, 637–643 CrossRef CAS.
- I. C. Popovici, E. Chirila, V. Popescu, V. Ciupina and G. Prodan, J. Mater. Sci., 2007, 42, 3373–3377 CrossRef.
- K. Kitaoka, H. Kozuka, T. Hashimoto and T. Yoko, J. Mater. Sci., 1997, 32, 2063–2270 CrossRef CAS.
- H. Gao, F. Yan, Y. Zhang, J. Li, Y. Zeng and J. Wang, Appl. Surf. Sci., 2009, 255, 3664–3668 CrossRef CAS.
- Y. Hayashi and J. B. Blum, J. Mater. Sci., 1987, 22, 2655–2660 CrossRef CAS.
- R. W. Schwartz and M. Narayanan, in Chemical Solution Deposition of Functional Oxide Thin Films, ed. T. Schneller, R. Waser, M. Kosec and D. Payne, Springer, Vienna, 2013, vol. 15, pp. 343–382 Search PubMed.
| This journal is © The Royal Society of Chemistry 2017 |

