 Open Access Article
Creative Commons Attribution 3.0 Unported Licence
Ultrasonic-assisted modification of a novel silkworm-excrement-based porous carbon with various Lewis acid metal ions for the sustained release of the pesticide thiamethoxam†
Yannan Wei,
Yuxiang Wu,
Qing Chang,
Meixuan Xie,
Xinhui Wang,
Jinwen Mo,
Xuekun He,
Zhenxia Zhao* and
Zhongxing Zhao *
*
Guangxi Key Laboratory of Petrochemical Resource Processing and Process Intensification Technology, School of Chemistry and Chemical Engineering, Guangxi University, Nanning 530004, China. E-mail: zhaozhenxia@gxu.edu.cn; zzxx@gxu.edu.cn
First published on 9th June 2017
Abstract
The ultrasonic-assisted modification of novel silkworm-excrement-based porous carbon (PCSE) with various Lewis acid metal ions (LAMIs) was prepared and applied for the sustained release of the pesticide thiamethoxam (TM). The effects of the LAMIs on the TM adsorption and release mechanism were analyzed and investigated using hard and soft acid–base theory (HSAB). The results showed that the prepared PCSE showed a micro/mesoporous structure and its adsorption capacity for TM reached 616.8 mg g−1 at 298 K. The LAMIs were coordinated with acid oxygen groups on the PCSE and were loaded as the corresponding metal oxides with a lower valence under an ultrasonic field. The low valence of the LAMIs significantly decreased the interaction between TM (hard base, χ = 4.08) and the LAMI-modified PCSEs due to the decrease in the local acidity of the PCSE. Thus, the release amount and release rate of TM from the LAMI-modified PCSEs was successfully enhanced in the order of Fe3+/Fe2+ < Cu2+/Cu+ < Ag+/Ag. As a result, the obtained PCSEs modified by LAMIs showed a sustained release rate of 17.7–19.7 mg (g−1 day−1) for the first 10 days and a slow release rate of 2.2–2.3 mg (g−1 day−1) within the next 30 days. According to actual TM usage conditions for some crops (1.0–2.0 mg m−2), only 0.50 g of TM-loaded PCSE can efficiently control the main pest of crops per square metre and can last for over 40 days.
Introduction
Thiamethoxam (TM) is a typical representative of alkaline pesticide1,2 and has been widely used for pest control in foliar, soil and seed treatments.3,4 However, exposure to TM pesticide delivery is more likely to cause not only a short effective time for pests control but also low utilization of pesticide, resulting in a large amount of TM residues on crops, and in the soil and water. These pesticide residues represent pollution to plants, animals and the natural environment, especially in terms of groundwater contamination.5–7 Moreover, some research8–10 has shown that TM in crops and groundwater is highly toxic nature towards honey bees, causing a serious ecological problem. Hence, it is necessary to enhance the effectiveness and persistency of TM pesticides to decrease the environmental pollution and ecological damage.With the growth in requirement for reducing the applications and increasing the efficiency of pesticides, controlled-release technology has received increasing attention over the last two to three decades.11–13 In this case, the design and development of controlled-release materials of pesticides are the key points of this technology, where the controlled-release materials used for this purpose include capsules,14 polymers15 and porous materials.16 Among these materials, porous materials are one kind of attractive material for pesticide delivery due to their tunable pore size and surface properties. For example, Cao and co-workers17 employed mesoporous silica nanoparticles as pesticide carriers for the controlled release of pyraclostrobin. Their adsorption capacity for pyraclostrobin reached 267 mg g−1 with higher release amounts (72%) of pyraclostrobin within 120 min. Shang18 reported a controlled-release formula of avermectin prepared using an abamectin-loaded porous acrylic resin as a carrier to decrease the release rate, with the result that the release process lasted for up to 15 days but with a very low adsorption capacity of 18 mg g−1. From these reports, it can be seen that very few controlled-release materials yet possess a high adsorption capacity and sustainable-released for a long period simultaneously. Moreover, the synergistic effect mechanism of the surface property as well as the pore structure in pesticide delivery from porous materials has still not been clearly investigated. Thus, it remains a challenge to develop ideal controlled-release materials with the advantages of a high adsorption capacity and sustained release acting to a certain amount for a long time.
In this work, porous carbon derived from one kind of natural waste, namely silkworm excrement, was selected as a carrier for TM pesticide. Through calcination and KOH chemical activation, a hierarchical pore texture with a high surface area was obtained, forming a controlled-release material with a high adsorption capacity of the pesticide. We used an ultrasonic-assisted modification method to modulate the surface acidity of the porous carbon silkworm excrement (PCSE) with different Lewis acid metal ions (LAMIs). The adsorption isotherms, adsorption kinetics and controlled-release kinetics from the modified samples were systemically measured. The hard and soft acid–base (HSAB) theory19,20 was used to calculate the TM base hardness, and to explain the corresponding effects of the surface acid properties on the interaction between TM and PCSEs, and then the release rate of TM from the LAMI-modified PCSEs was also investigated.
Experimental
Reagents
Silkworm excrement was purchased from a farmer's market (Yi Zhou, China). TM (95.0%) was supplied by Guangxi Tian Yuan Biochemistry Co. Ltd. (Nanning, China). Fe(NO3)3·6H2O (AR, 99.0%), Cu(NO3)3·2H2O (AR, 99.0%) and AgNO3 (AR, 99.0%) were supplied by Aladdin Industrial Co. Ltd (Shanghai, China). Methanol for HPLC analysis was supplied by Thermo Fisher Scientific Co., Ltd. (USA). All the starting materials were commercially available reagents of analytical grade and used without further purification.Synthesis of PCSE
The silkworm excrement (SE) was first washed with deionized water, filtered and dried at 110 °C overnight. Then, the SE was crushed to uniform distribution of particle sizes in the range of 1–2 mm. After drying, the resulting powder was heated to 850 °C at a rate of 5 °C min−1 and maintained at this temperature for 2 h under a nitrogen atmosphere. The obtained sample was cooled down to room temperature and denoted as CSE. Next, the obtained carbon CSE was mixed with KOH at a weight ratio of 1![[thin space (1/6-em)]](https://www.rsc.org/images/entities/char_2009.gif) :
:![[thin space (1/6-em)]](https://www.rsc.org/images/entities/char_2009.gif) 6 (w/w), followed by thermal treatment at 800 °C for 2 h in N2 at a rate of 5 °C min−1. The porous CSE (PCSE) was washed with 1.0 M HCl and 10 wt% HF at room temperature under stirring for 12 h to remove the residual KOH and silicon dioxide. After centrifugation and washing with water several times, the PCSE was dried and stored for further characterization.
6 (w/w), followed by thermal treatment at 800 °C for 2 h in N2 at a rate of 5 °C min−1. The porous CSE (PCSE) was washed with 1.0 M HCl and 10 wt% HF at room temperature under stirring for 12 h to remove the residual KOH and silicon dioxide. After centrifugation and washing with water several times, the PCSE was dried and stored for further characterization.
PCSE modification with various Lewis acid metal ions
Several metal nitrates as Lewis acid metal ions (LAMIs) were chosen to modify the PCSE samples via an ultrasonic-assisted immersion method. The modification procedure was as follows: 1.00 g of PCSE was added into 0.1 M of metal nitrates solution to be treated by using ultrasonic-assisted impregnation for 1 h (Ultrasonic Cell Crusher, XO-1000D, 500 W, 24 kHz). The above mixed solution continued to be stirred moderately for 16 h at 30 °C, and was then dried in an oven at 200 °C for 6 h. The corresponding surface-modified PCSE samples were designated as FN-PCSE, CN-PCSE and AN-PCSE by using 0.1 M Fe(NO3)3, Cu(NO3)2 and AgNO3.Thiamethoxam analytical method
TM was detected with a ZORBAX SB C18 column and a diode array detector (DAD) at 250 nm by RP-HPLC (Agilent 1260, USA). The mobile phase composed of water![[thin space (1/6-em)]](https://www.rsc.org/images/entities/char_2009.gif) :
:![[thin space (1/6-em)]](https://www.rsc.org/images/entities/char_2009.gif) methanol (75
methanol (75![[thin space (1/6-em)]](https://www.rsc.org/images/entities/char_2009.gif) :
:![[thin space (1/6-em)]](https://www.rsc.org/images/entities/char_2009.gif) 25 v/v) was pumped by isocratic elution at 1.00 mL min−1 for 20 min. The separation was carried out at 30 °C. Linear regression of the TM concentration (y, μg) and absorbance (x, mAU) was performed to obtain a standard curve by using eqn (1):
25 v/v) was pumped by isocratic elution at 1.00 mL min−1 for 20 min. The separation was carried out at 30 °C. Linear regression of the TM concentration (y, μg) and absorbance (x, mAU) was performed to obtain a standard curve by using eqn (1):| y = 36.969x − 1.738 (R2 = 0.9999). | (1) |
Measurements of the adsorption isotherms and kinetics of TM
The adsorption equilibrium curves of TM onto the PCSE and LAMI-modified PCSEs were obtained in a set of 100 mL Erlenmeyer flasks. 50 mg samples were added into 50.0 mL of TM aqueous solution with various initial concentrations (10.0–600.0 mg L−1). The obtained suspension was magnetically stirred at 30 °C for 48 h to reach adsorption/desorption equilibrium. The adsorption kinetics of TM onto the above samples was determined under the same conditions as that of the adsorption equilibrium measurements, except for withdrawing solution at regular intervals (0.25 mL). The withdrawing solution was centrifuged and filtered for HPLC measurement.The adsorption uptake of TM by the above samples was calculated as follows:
 | (2) |
 | (3) |
Thiamethoxam release kinetics from the PCSE and LAMI-modified PCSEs
The TM-release kinetics performance was tested according to a previous test method reported in the literature.21,22 Before measurement, the TM adsorbed the PCSE and LAMI-modified PCSEs samples were dried in a vacuum oven at 40 °C for 5 h. Then, the above samples were weighed and placed in a dialysis bag with 20.0 mL water. The dialysis bag was put in a 250 mL conical flask filled with 100.0 mL water. After that, it was kept in an isothermal water bath shaker with stirring at 30 °C for 24 h. Finally, the concentration of TM was analyzed by HPLC using the method described above.Characterization of the PCSE and LAMI-modified PCSEs
The porosity of the PCSE and its LAMI-modified samples was determined using a Micromeritics ASAP 2460 analyzer. Prior to the adsorption measurements, the samples were activated at 150 °C for 8 h under a vacuum of 26.6 kPa. The specific surface areas and the micropore size distribution were calculated by using the Brunauer–Emmett–Teller (BET) and the Horvath–Kawazoe (H–K) methods, respectively. The mesopore size distribution as well as the mesopore volume were determined by using the Barret–Joyner–Hallender (BJH) model.The surface morphology of the PCSE and LAMI-modified samples was observed by using the Hitach S-3400N type scanning electron microscopy (SEM) system equipped with an energy dispersive X-ray spectrometer (EDX, Tokyo, Japan). The crystal structure was obtained by X-ray diffraction (RIGAKU, Japan) using a monochromatized X-ray beam with nickel-filtered Cu Kα radiation and a 2° min−1 scan rate.
The surface element components of the PCSE and its LAMI-modified samples were analyzed by X-ray photoelectron spectroscopy (XPS) on a PHI 5000C ESCA (PHI, USA) at high voltage 14.0 kV, 300 W and 93.9 eV. The surface functional groups of LAMI-modified PCSEs were quantitative analyzed by Boehm titration (SI Analytics-SCHOTT TitroLine Easy).23,24
Results and discussion
SEM images and EDX mapping of SE, CSE, PCSE and LAMI-modified PCSEs
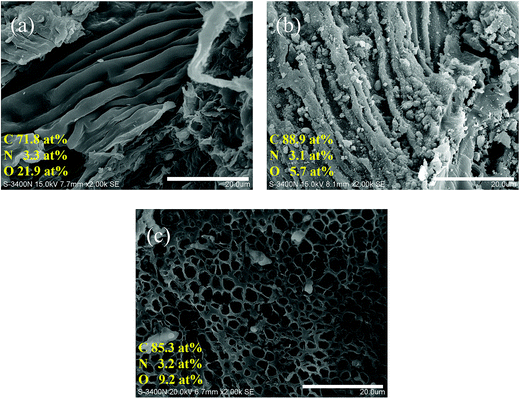
Fig. 1 shows the SEM images and elemental composition of SE, CSE and PCSE. As seen, the original SE had a very smooth surface with a wrinkled structure (Fig. 1a). After being heated at high temperature, the SE suffered an incomplete carbonization to become CSE. The morphology of the surface wrinkles on the CSE sample showed a strong contraction (Fig. 1b). Unlike SE, some small cracks and fine particles appeared on the CSE surface. After being activated by KOH, the morphology of CSE dramatically changed. As shown in Fig. 1c, the wrinkles on the surface have disappeared on the PCSE, while a honeycomb-like surface with a large number of tiny holes have appeared over the entire part. This indicated that KOH had destroyed the smooth and wrinkled surface through the activation and pyrolysis process.Also, EDX analysis was used to measure the changes of the elements of the above samples (SE, CSE and PCSE), whose results are listed in the corresponding SEM images. From the elemental analysis in Fig. 1, it can be seen that the original SE was rich in carbon, nitrogen and oxygen functional groups, like other natural biomass materials. During the calcination process, a large amount of oxygen groups was removed from the CSE substrate, resulting in C element enrichment in the CSE sample. The O content presents a slight increase after being activated by KOH. The KOH activation process can generate oxygen-containing groups on the carbon surfaces, thus resulting in an increasing O content in the activated samples.
Fig. 2 shows the elemental mapping images of Fe, Cu and Ag on the corresponding surface LAMI-modified PCSEs (FN-PCSE, CN-PCSE and AN-PCSE), respectively. The SEM images of FN-PCSE, CN-PCSE and AN-PCSE display a honeycomb-like surface with a large number of tiny holes, similar to the morphology of the PCSE sample. As can be seen from this figure, elements of Fe, Cu and Ag were dispersed into the carbon matrix homogeneously and their contents in all the samples were approximately in the range of 0.62–0.77 at%.
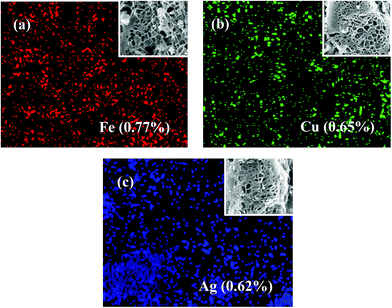 | ||
| Fig. 2 EDX mapping and the corresponding SEM images of the LAMI-modified PCSE samples: (a) FN-PCSE, (b) CN-PCSE and (c) AN-PCSE. | ||
PXRD analysis
The PXRD patterns of the original SE, calcined CSE and activated PCSE are depicted in Fig. 3a. Four sharp diffraction peaks in the SE samples were observed at 15.23/24.65° and 26.79/29.32°, which represent the CaCO3 and SiO2 crystals appearing in the SE sample. After being calcined at high temperature, CaCO3 was first decomposed into CaO and then removed by H2O. Thus, almost no CaCO3 was detected in the CSE sample. Meanwhile, two broad peaks located at 23° and 43° appeared in the CSE samples, which correspond to the (002) and (100) crystal planes of a typical graphitic structure. The PXRD pattern of PCSE was found to be almost identical to that of the CSE, except for the absence of SiO2 crystal peaks. This means that the graphitic carbon structure in CSE was not damaged after the KOH activation and HF washing. Fig. 3b shows the PXRD patterns of PCSE modified with and without LAMIs (FN-PCSE, CN-PCSE, AN-PCSE and PCSE). No other obvious diffraction peaks of these samples were detected in the samples being modified by different ions. As far as we know, the smaller the crystallite size is, the weaker is the diffraction peak intensity of the crystallite.25 When the crystallite size is small enough, the diffraction peak intensity of the crystallite would become too weak to be detected. Therefore, it was deduced that metal ions were dispersed uniformly into the PCSE with a very small crystallite size through the ultrasonic-assisted impregnation. This could also be evidenced by the EDX results.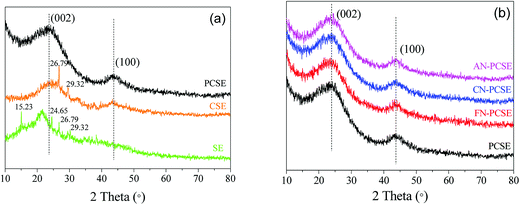 | ||
| Fig. 3 (a) PXRD patterns of SE, CSE and PCSE, (b) PXRD patterns of PCSE, FN-PCSE, CN-PCSE and AN-PCSE. | ||
XPS analysis
To better understand the formation species of the LAMI-modified PCSEs, we next employed X-ray photoelectron spectroscopy (XPS) analysis to investigate coordination position and the mode of the metal ion centre. Fig. 4 shows the metal XPS spectrum (Fe 2p, Cu 2p and Ag 3d) of FN-PCSE, CN-PCSE and AN-PCSE, respectively. The Fe 2p XPS spectrum of FN-PCSE was curve-fitted into three peaks with binding energies at 710.7 (Fe3+), 714.3 (Fe3+) and 724.4 eV (Fe2+) in Fig. 4a. The fitting calculation shows that the reduced Fe2+ species hold about 26.2% of the whole Fe species. This means that Ferric iron was partly reduced during Fe anchoring on the carbon surface. This phenomenon also happened on the other two samples (CN-PCSE and AN-PCSE). As shown in Fig. 4b and c, Cu(II) and Ag(I) species were also reduced to Cu+ (931.6 and 951.5 eV) and metallic Ag (374.2 eV). Their proportions were 25.2% and 44.8% for Cu+ and metallic Ag, respectively. This is relatively rare in the solvent immersion method involving metal ions with low-temperature drying. However, with the ultrasonic-assisted irradiation, the metal ions were partly reduced in the ultrasonic loading process due to the cavitation, the mechanical function and the thermal effects.26 The lower valence state would lead to the surface shifting to softer acids based from HSAB theory.27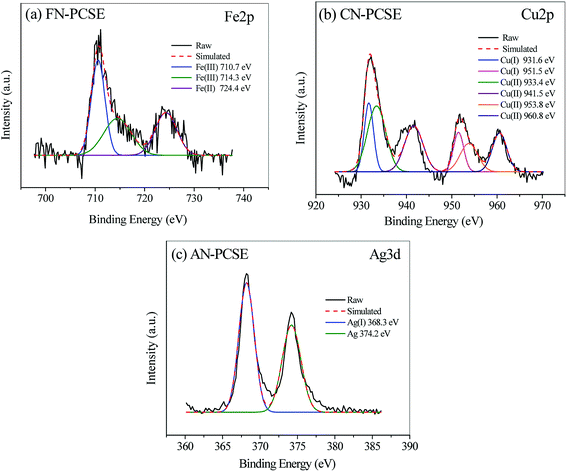 | ||
| Fig. 4 XPS spectra and their deconvolution profiles of (a) Fe 2p spectrum of FN-PCSE, (b) Cu 2p spectrum of CN-PCSE and (c) Ag 3d spectrum of AN-PCSE. | ||
Also, the C component in the LAMI-modified PCSEs was measured by using XPS analysis, and the results are shown in Fig. 5. All of the samples show three C 1s peaks in their XPS spectra, and their atomic concentrations for each bond are listed in Table 1. As shown in Fig. 5, sp3C, C–O and O–C![[double bond, length as m-dash]](https://www.rsc.org/images/entities/char_e001.gif) O bonds were all detected in the LAMI-modified PCSEs with various contents. This can be probably attributed to the variation of covalent coordination of the different metal ions; among which, Fe(II/III) has the strongest capability of coordination in the form of sexadentate (Table 1). Thus, it shows the lowest proportion of the hydroxyl (phenol or aliphatic, 14.8%) and carboxyl groups (5.9%) in the FN-PCSE sample (Fig. 5a and Table 1), while the hydroxyl (phenol or aliphatic, 14.8%) and carboxyl groups (5.9%) in the CN-PCSE sample are the middle, as shown in Fig. 5b. On the contrary, Ag(I) has the weakest capability of coordination with oxygen groups. Besides, part of Ag(I) was converted to metallic silver. After metal coordination, the oxygen groups were combusted and probably transformed to corresponding metal oxides (Fig. 5c and Table 1). Therefore, the LAMI's modification cannot only affect the surface acidity and basicity, but can also change the oxygen species and content in the samples.
O bonds were all detected in the LAMI-modified PCSEs with various contents. This can be probably attributed to the variation of covalent coordination of the different metal ions; among which, Fe(II/III) has the strongest capability of coordination in the form of sexadentate (Table 1). Thus, it shows the lowest proportion of the hydroxyl (phenol or aliphatic, 14.8%) and carboxyl groups (5.9%) in the FN-PCSE sample (Fig. 5a and Table 1), while the hydroxyl (phenol or aliphatic, 14.8%) and carboxyl groups (5.9%) in the CN-PCSE sample are the middle, as shown in Fig. 5b. On the contrary, Ag(I) has the weakest capability of coordination with oxygen groups. Besides, part of Ag(I) was converted to metallic silver. After metal coordination, the oxygen groups were combusted and probably transformed to corresponding metal oxides (Fig. 5c and Table 1). Therefore, the LAMI's modification cannot only affect the surface acidity and basicity, but can also change the oxygen species and content in the samples.
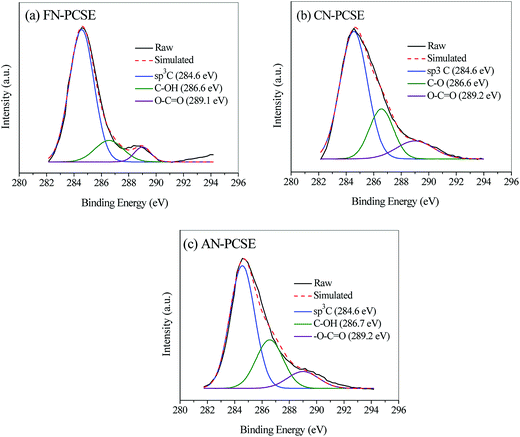 | ||
| Fig. 5 XPS spectra and their deconvolution profiles of C 1s spectra: (a) FN-PCSE, (b) CN-PCSE and (c) AN-PCSE. | ||
![[double bond, length as m-dash]](https://www.rsc.org/images/entities/char_e001.gif) O bonds in the XPS C 1s peaks of the modified PCSE samples
O bonds in the XPS C 1s peaks of the modified PCSE samples
N2 adsorption/desorption isotherms of PCSE, FN-PCSE, CN-PCSE and AN-PCSE
N2 adsorption/desorption isotherms and the textural properties of PCSE, FN-PCSE, CN-PCSE and AN-PCSE are displayed in Fig. 6a and Table 2, respectively. As shown, the N2 isotherm of the PCSE sample shows a type IV isotherm with an hysteresis loop (H4),28 suggesting that PCSE possessed a hierarchical micro/mesoporous structure. Its BET surface areas and total volume were calculated to be 1214.1 m2 g−1 and 0.670 cm3 g−1, respectively. Its micropore area and micropore volume were 635.4 m2 g−1 and 0.292 cm3 g−1. The H4 hysteresis loop was indicative of the existence of some slit-shaped mesopores in this PCSE matrix.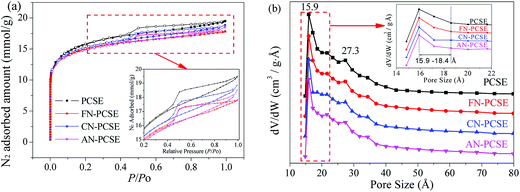 | ||
| Fig. 6 (a) Isotherms of nitrogen adsorption and (b) the pore size distributions for PCSE, FN-PCSE, CN-PCSE and AN-PCSE. | ||
| Sample | BET surface area (m2 g−1) | Micropore surface area (m2 g−1) | Total pore volume (cm3 g−1) | Micropore volume (cm3 g−1) | Pore size (Å) |
|---|---|---|---|---|---|
| PCSE | 1214.1 | 635.4 | 0.670 | 0.292 | 2.21 |
| FN-PCSE | 1146.8 | 670.6 | 0.615 | 0.310 | 2.14 |
| CN-PCSE | 1099.9 | 656.3 | 0.638 | 0.343 | 2.37 |
| AC-PCSE | 1070.2 | 643.2 | 0.622 | 0.324 | 2.38 |
After being modified by the LAMIs, the samples showed a little decrease in their surface area, but almost no changes in their pore sizes (Fig. 6a and b). The LAMImodified PCSEs generally lost appropriately 6–12% of their surface area in comparison with the original PCSE sample. This was mainly due to the occupation of pore space by loading the metal species. However, the high dispersion and no serious aggregations of metal species did not cause a severe blockage of the pore structure. The values of their BET surface area were in the order of PCSE > FN-PCSE > CN-PCSE > AN-PCSE. Among which, AN-PCSE declined the most with a 12% drop in surface area. The possible reason for this was that the reduced metallic silver appeared on the surface of AN-PCSE sample, which aggregated into relatively larger particles and blocked some pores. However, it is worth mentioning that the micropore volume and micropore surface area for the LAMI-modified samples (Table 2) were higher than for PCSE before modification. These new generated micropores may probably come from the partly blocked mesopores by the metal species. As a result, the total pore volume decreased, while the microporous volume increased slightly.
The DFT pore size distributions of these samples before and after modification are also shown in Fig. 6b. It can be seen that PCSE, FN-PCSE, CN-PCSE and AN-PCSE show a very similar profile, having two peaks at 15.9 and 27.3 Å, respectively. However, there was a much narrower microporosity in the range of 15.9–18.4 Å for the LAMI-modified samples, which would be helpful to adsorb and control TM release.
Boehm titration analysis
The amounts of acid oxygen functional groups on PCSE and the LAMI-modified PCSEs surface detected by Boehm titration are listed in Table 3. The acid oxygen functional groups on the LAMI-modified PCSE samples surface, mainly including carboxylic and phenolic groups, showed a dramatic decrease in content compared to the PCSE sample following the order of AN-PCSE > CN-PCSE > FN-PCSE. The decline of the acid oxygen groups in the LAMI-modified samples was attributed to the oxygen consumption by metal ions coordination. In this case, some acid oxygen groups were coordinated with metal ions, and then transformed into metal–oxygen clusters. Besides, the stronger coordination capability of the metal ion, the lower acid O group content is left. Among these metal ions, Fe(II/III) possessed the strongest coordination towards oxygen groups on the carbon surface. Hence, FN-PCSE was left with the least acid O group content on its surface (Table 3), which was consistent with the XPS results.Local acid–base hardness of TM
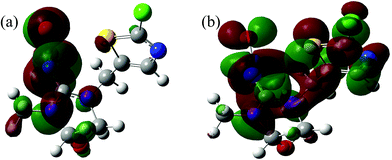
The adsorbate properties, including molecular size/shape, polarity and acid–base hardness, are crucial to affect the adsorption capacity and release rate on/from adsorbents, respectively.29–31 In this work, we tried to use density functional theory (DFT) to evaluate the molecular 3D structure, the absolute hardness and the electronegativity of TM. The calculation formula used is as follows:32
 | (4) |
| I = −EHOMO | (5) |
| A = −ELUMO | (6) |
Inserting eqn (5) and (6) into eqn (4), we get:
 | (7) |
 | (8) |
| Molecule | EHOMO (eV) | ELUMO (eV) | η (eV) | χ (eV) |
|---|---|---|---|---|
| TM | −6.710 | −1.441 | 2.635 | 4.076 |
Adsorption isotherms of TM
Fig. 8a shows the isotherms of TM on the PCSE and LAMI-modified PCSEs. All of the isotherms are of a type I shape, suggesting a strong adsorption interaction between TM and PCSEs at very low concentration levels of TM solution. As shown, the adsorption capacities of TM reached up to 616.8 mg g−1 at 298 K. After being LAMI-modified, their adsorption capacities were slightly decreased. The probable reasons for this were attributed to the decrease of the sample specific surface area and the change in sample surface properties (oxygen groups and metal sites).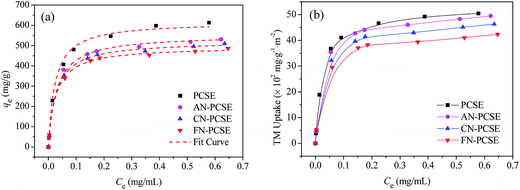 | ||
| Fig. 8 Adsorption isotherm curves of TM on PCSE and LAMI-modified PCSEs based on (a) the unit mass and fitted by using the Langmuir equation and (b) based on the unit surface area and unit mass. | ||
In order to find out the extent that these two factors have on TM adsorption, the adsorption capacity was recalculated based on the per unit surface area and unit mass instead of the per unit mass of the four adsorbents, with the results shown in Fig. 8b. In the figure, it still shows a similar adsorption trend as Fig. 8a regardless of their changes in surface area. Obviously, the decrease of surface area by modification was not a crucial factor in the decline of the adsorption capacity. As seen in Fig. 8b, the TM adsorption capacity in TM uptake per unit surface area and unit mass decreased in the order of AN-PCSE (528.3 mg g−1) > CN-PCSE (509.9 mg g−1) > FN-PCSE (485.6 mg g−1), which was very consistent with the decreasing trend of acid oxygen content in the samples estimated by the Boehm titration measurements. Thus, based on the similar content of metal on the LAMI-modified PCSEs (from EDX results), the acid oxygen groups on the LAMI-modified PCSEs had a greater impact on the adsorption capacity of hard base TM. In our case, a higher content of oxygen groups means more adsorption sites exist on the LAMI-modified PCSEs towards TM.
To describe the adsorption behaviour of TM, Langmuir and Freundlich equations were separately applied to fit the experimental isotherm data of TM adsorption on the PCSE and LAMI-modified PCSEs.
The Langmuir and Freundlich isotherms35–37 are given by eqn (9) and (10):
 | (9) |
 | (10) |
The non-linear curve fits of the adsorption isotherms data of TM on the PCSE and LAMI-modified PCSEs were performed, and all of the constants and correlation coefficients gained from the two above isotherm models are summarized in Table 5. Clearly, the Langmuir isotherm yielded a better fit with higher R2 values (higher than 0.997) than the Freundlich isotherm, indicating that the Langmuir isotherm is more suitable for describing the TM adsorption of PCSE and LAMI-modified PCSEs. This implied that monolayer adsorption happened on the PCSEs surface with no interaction or very weak interaction between the TM molecules themselves. This means that the increase of adsorption ability in Langmuir model obviously depends on the surface properties and microspore of PCSE and LAMI-modified PCSEs. From Table 5, the value of KL decreased in the order of PCSE > FN-PCSE > CN-PCSE > AN-PCSE, suggesting a declining trend for the adsorption intensity from FN-PCSE to AN-PCSE. According to the “hard and soft acid–base theory” (HSAB) of R. G. Pearson,38 the hardness of Lewis acids on PCSEs decreased in the order of PCSE > FN-PCSE > CN-PCSE > AN-PCSE, which was similar to the trend of their KL towards TM molecules. This suggests that TM molecules can form strong interaction with a surface having a high hardness of acids. With the decrease in hardness acids, the interaction between TM and PCSEs showed a declining trend. This is entirely consistent with the “hard and soft acid–base theory”.
| Materials | Langmuir | Freundlich | ||||
|---|---|---|---|---|---|---|
| KL (mL mg−1) | Qm (mg g−1) | R2 | KF (mg g−1 (L mg−1)1/n) | n | R2 | |
| PCSE | 42.68 | 632.38 | 0.9996 | 772.53 | 3.80 | 0.9384 |
| AN-PCSE | 33.87 | 555.63 | 0.9977 | 642.18 | 4.26 | 0.9124 |
| CN-PCSE | 36.72 | 522.50 | 0.9991 | 611.16 | 4.23 | 0.9206 |
| FN-PCSE | 38.89 | 495.03 | 0.9990 | 579.54 | 4.27 | 0.9200 |
Adsorption kinetics
Fig. 9a shows the TM adsorption uptake on PCSE and LAMI-modified PCSEs at 303 K. It can also be found that the TM equilibrium adsorption amount decreases in the order of PCSE > AN-PCSE > CN-PCSE > FN-PCSE. TM exhibited a fast adsorption rate on all of the PCSE samples. About 50% of TM saturated adsorption was achieved after only 40 min oscillation (designated as fast adsorption stage), and they could reach absorption equilibrium within 1000 min.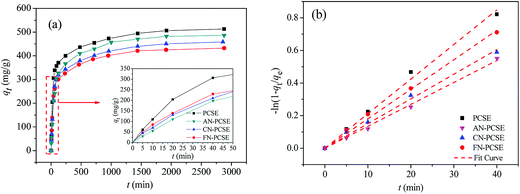 | ||
| Fig. 9 (a) TM transient adsorption uptakes on the PCSE and LAMI-modified PCSEs at 303 K. (b) Dependence of −ln(1 − qt/qe) of TM adsorption on time for the PCSE and LAMI-modified PCSEs at 303 K. | ||
To further show the effects of LAMIs modification on the TM diffusion rate, the pseudo-first-order formula in eqn (11) was utilized to fit the data of the fast adsorption stage on PCSE and LAMI-modified PCSEs. The uptake curves are plotted as the fractional uptake  versus adsorption time (t < 40 min) in Fig. 9b, and the fitting parameters are shown in Table 6.
 | (11) |
| Materials | qe (mg g−1) | K1 (g mg−1 min−1) × 102 | R2 |
|---|---|---|---|
| PCSE | 546.61 | 2.12 | 0.9932 |
| FN-PCSE | 452.12 | 1.81 | 0.9955 |
| CN-PCSE | 472.98 | 1.51 | 0.9937 |
| AN-PCSE | 494.15 | 1.34 | 0.9966 |
It can be seen from Fig. 9b that eqn (11) fitted the experimental data reasonably well. The R2 value of pseudo-first-order kinetic model in Table 6 was about 0.99 and the calculated qe was very close to the experimental data. Thus, the kinetics data fits well with the pseudo-first-order kinetic model. Parameter k1 represents the adsorption rate, which was thought to be mainly governed by the microporous and surface diffusion. As seen above in Fig. 6b, these PCSE samples possessed very similar micropore size distribution. It could thus be deduced that k1 was mostly affected by the surface properties of the PCSEs. Clearly, the LAMI-modified PCSEs had a decreasing value of k1 (slop) for TM adsorption compared to the original PCSE (Table 6). Among these modified samples, AN-PCSE (Ag modified sample) possessed the smallest value of k1. In our case, the low value of k1 represented a weak interaction between TM and the adsorbents. Hence, it means that the interaction between TM and PCSEs decreased with the hardness acid of LAMIs. After being modified by LAMIs, a portion of the acid oxygen groups were coordinated with metal ions, thereby leading to a decrease in the total acidity on the surface. Moreover, the interaction between TM and the LAMI-modified PCSEs decreased with the surface-acidic hardness of the loading metal species. As a result, the k1 values of the PCSE and LAMI-modified PCSEs were given in a descending order as: PCSE > AN-PCSE > CN-PCSE > FN-PCSE.
TM controlled-release kinetics
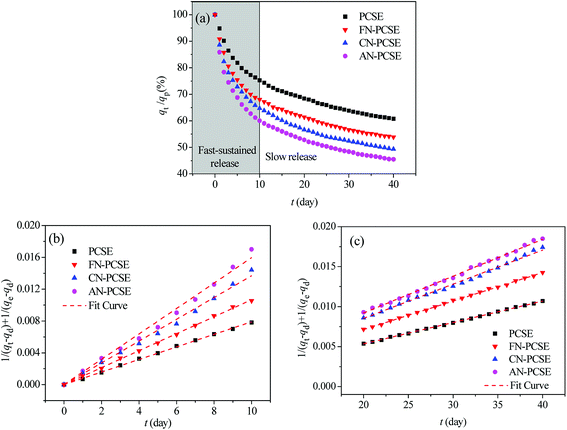
Fig. 10a shows the controlled-release kinetics of TM on PCSE and LAMI-modified PCSEs. It can be seen that TM was released from the PCSEs at a much slower speed than the adsorption kinetics. The total controlled-release process for TM could be divided into two stages: a fast-sustained release stage and a slow release stage. For fast-sustained release stage, 40–50% adsorbed TM on the four samples was released into water within 10 days. And then, it took at least 25–30 days to release another 10–20% of the adsorbed TM during a slow release stage.In order to value or compare the TM-release behaviour of the PCSE before and after LAMIs modification, we first used a pseudo-second-order model to describe the total release process and to determine their release rates. The released rate, kd, was assumed to follow pseudo-second-order kinetics with the following equation used to describe this:39
 | (12) |
Fig. S2† shows the dependence of 1/(qt − qd) + 1/(qe − qd) of TM controlled-release on the time for the PCSE and LAMI-modified PCSEs, and the fitting parameters are summarized in Table S1.† The TM-release behaviour did not conform to the pseudo-second-order model for the entire release process on PCSEs, and the obtained correlation coefficients were only about 0.95–0.98.
Next, we used the pseudo-second-order model to describe the fast-sustained release stage (t < 10 days) and slow release stage (t > 20 days) and to determine their release rates, respectively. The fitting curves are shown in Fig. 10b and c. From the slopes of these lines, the release rate constants of TM were obtained and are listed in Table 7. The separate fitting results show very high correlation coefficients (>0.995) for both release processes, indicating that the fast-sustained release kinetics and slow release kinetics can be governed by a pseudo-second-order model, separately. From the obtained release rate constants in Table 7, the values of kd1 were in the range of 0.79–1.60 × 10⁻³ g (mg−1 day−1), which was 1.7–3.5 times more than that of kd2. It can be deduced that all four PCSE samples had a heterogonous surface property: strong adsorption sites and weak adsorption sites, corresponding to slow release and fast-sustained release.
| Materials | Fast-sustained release | Slow release | ||||||
|---|---|---|---|---|---|---|---|---|
| qd1 (mg g−1) | (qe − qd1)/qe | kd1 (g mg−1 day−1) × 103 | R2 | qd2 (mg g−1) | (qd1 − qd2)/qe | kd2 (g mg−1 day−1) × 104 | R2 | |
| PCSE | 331.39 | 0.394 | 0.79 | 0.9990 | 261.79 | 0.127 | 2.67 | 0.9991 |
| FN-PCSE | 269.54 | 0.455 | 1.07 | 0.9993 | 209.80 | 0.121 | 3.56 | 0.9993 |
| CN-PCSE | 253.35 | 0.464 | 1.37 | 0.9980 | 185.61 | 0.143 | 4.26 | 0.9963 |
| AN-PCSE | 224.77 | 0.503 | 1.60 | 0.9958 | 160.11 | 0.143 | 4.60 | 0.9974 |
For the fast-sustained release stage, the extreme limit of the releasing proportion was only about 39.4% of TM saturated uptake on the PCSE sample. This value was obviously lower than that on the LAMI-modified PCSE samples, suggesting a weak adsorption interaction with TM and thus a higher release amount of TM from the LAMI-modified PCSEs. The values of kd1 increased for the LAMI-modified PCSEs in the order of FN-PCSE < CN-PCSE < AN-PCSE, indicating a release rate of TM representing the following order of AN-PCSE > CN-PCSE > FN-PCSE. This order was opposed to the adsorption interaction of TM and PCSEs.
Clearly, the surface acidity of the PCSE became decreased after sample loading with metal species. In terms of the Pearson hard-soft base classification, Fe3+ belongs to a hard acid, while Fe2+ and Cu2+ belong to borderline/inter acids and Cu+, Ag+ and metallic Ag belong to soft acids.40 Combined with the results of the XPS characterization, the acid hardness of these metal species shows a decreasing order of Fe3+ > Fe2+ > Cu2+ > Cu+ > Ag+ > Ag. Thus, it brought about a decreasing acidic hardness of PCSE > FN-PCSE > CN-PCSE > AN-PCSE. It is known that the interaction between species whose hardnesses are approximately equal is energetically favoured, relative to the interaction between species whose hardnesses are very different from each other.41
TM, as a typical hard base molecule, is preferentially attracted to a surface with hard acidic sites but not to a surface with soft and intermediate acidic sites. Thus, it can be predicted that the AN-PCSE loading of metallic Ag/Ag+ would form the weakest interaction towards TM molecules among the four PCSE samples. As a result, AN-PCSE possessed the fastest release rate and largest release amount of TM in the fast-sustained release stage. In addition, it is worth pointing out that the total release amount of TM was significantly increased, but a discrepancy in the release rates in the two stages gradually diminished with the decrease in adsorbent–TM interaction. The above results indicated that the decrease in the local hard acidity of the surfaces can weaken the interaction between TM and the surfaces, and thus can lead to an increase in the release rate and total release amount of TM from PCSEs adsorbents. This was in accordance with the variation trend of the adsorption and release kinetics data, as shown in Tables 6 and 7. Besides, this trend was also found in the slow release stage.
On average, the obtained modified PCSEs by LAMIs showed a fast-sustained release rate of 17.7–19.7 mg (g−1 day−1) for the first 10 days and a slow release rate of 2.2–2.3 mg (g−1 day−1) within the next 20–25 days. According to the actual application dosage of TM pesticide for some crops (1.0–2.0 mg m−2),42,43 only 0.50 g of TM-loaded PCSE can efficiently control the main pest of crops per square metre and can last for over 40 days.
Conclusions
Porous carbon derive from silkworm excrement (PCSE) was obtained and modified with Lewis acid metal ions for TM pesticide controlled release. PCSE had a hierarchical pore structure and high surface area (1214.1 m2 g−1) after being treated with two-step silkworm excrement calcination and KOH activation. The effects of loading Fe3+, Cu2+ and Ag+ in PCSE on the interaction of TM with carbon surfaces and its release rate from PCSEs were investigated systematically. From the discussion, the following conclusions may be drawn: (1) PCSE possessed a very high adsorption capacity of TM at 298 K. Ultrasonic-assisted impregnation facilitated loading “soft/intermediate acid” metal sites and enhanced their dispersion in carbon hosts. The contents of acidic oxygen groups (carboxylic and phenolic) showed a significant decline after LAMIs modification. (2) The TM molecule has an absolute electronegativity (χ) of 4.08 and was thus classified as a typical hard base. (3) The loading of acid ion Fe3+/Fe2+, Cu2+/Cu+ or Ag+/Ag on the PCSEs decreases the local acid sites and weakens the interaction towards “hard-base” TM. (4) The total controlled-release process of TM from PCSEs could be divided into two stages: a fast-sustained release stage (first 10 days) and a slow release stage (20–35 days). Both stages can be matched to the pseudo-second-order model. Moreover, the TM-release rate from PCSE and LAMI-modified PCSEs showed a decreasing order of AN-PCSE (Ag) > CN-PCSE (Cu) > FN-PCSE (Fe) > PCSE, which was opposed to the adsorption interaction between TM and PCSEs. As a conclusion and in summary, it was proven that surface treatment with low valence states of metal ions (soft-intermediate acids) can efficiently weaken the interaction towards hard base TM, and enhance the release rate and total release amount of TM from carbon porous adsorbents.Acknowledgements
This work was financially supported by National Natural Science Foundation of China (No. 31401629, 21666004, 21676059 and 21376090), Natural Science Foundation of Guangxi Zhuang Autonomous Region, China (No. 2016JJA120072), Scientific Research Foundation of Guangxi University (Grant No. XGZ130963) and Innovation and Entrepreneurship Training Program of Guangxi Zhuang Autonomous Region (No. 201610593169).References
- R. Karmakar, S. B. Singh and G. Kulshrestha, J. Environ. Sci. Health, Part B, 2009, 44, 435–441 CrossRef CAS PubMed.
- C. Chen, F. M. Liu, T. F. Fan and Q. R. Peng, RSC Adv., 2016, 6, 58106–58112 RSC.
- N. Prabhaker, S. J. Castle, S. E. Naranjo, N. C. Toscano and J. G. Morse, J. Econ. Entomol., 2001, 104, 773–781 CrossRef.
- R. Nauen, U. Ebbinghaus-Kintscher, V. L. Salgado and M. Kaussmann, Pestic. Biochem. Physiol., 2003, 76, 55–69 CrossRef CAS.
- Y. Xiang, N. Wang, J. Song, D. Cai and Z. Wu, J. Agric. Food Chem., 2013, 61, 5215–5219 CrossRef CAS PubMed.
- D. Cai, L. Wang, G. Zhang, X. Zhang and Z. Wu, ACS Appl. Mater. Interfaces, 2013, 5, 9212–9216 CAS.
- W. X. Zhang, J. Nanopart. Res., 2003, 5, 323–332 CrossRef CAS.
- M. Henry, M. Beguin, F. Requier, O. Rollin, J. Odoux, P. Aupinel, J. Aptel, S. Tchamitchian and A. Decourtye, Science, 2012, 336, 348–350 CrossRef CAS PubMed.
- D. Guez, Front. Physiol., 2013, 4, 1–3 Search PubMed.
- M. Henry, M. Beguin, F. Requier, O. Rollin, J. Odoux, P. Aupinel, J. Aptel, S. Tchamitchian and A. Decourtye, Science, 2012, 337, 1453b CrossRef.
- A. R. Kulkarni, K. S. Soppimath, T. M. Aminabhavi, A. M. Dave and M. H. Mehta, J. Controlled Release, 2000, 63, 97–105 CrossRef CAS PubMed.
- J. Hill, E. Nelson, D. Tilman, S. Polasky and D. Tiffany, Proc. Natl. Acad. Sci. U. S. A., 2006, 103, 11206–11210 CrossRef CAS PubMed.
- J. Lehmann, M. C. Rillig, J. Thies, C. A. Masiello, W. C. Hockaday and D. Crowley, Soil Biol. Biochem., 2011, 43, 1812–1836 CrossRef CAS.
- P. G. Shukla, B. Kalidhass, A. Shah and D. V. Palaskar, J. Microencapsulation, 2002, 19, 293–304 CrossRef CAS PubMed.
- I. Ferrer, F. Lanza, A. Tolokan, V. Horvath, B. Sellergren, G. Horvai and D. Barcelo, Anal. Chem., 2000, 72, 3934–3941 CrossRef CAS PubMed.
- P. Kinnari, E. Makila, T. Heikkila, J. Salonen, J. Hirvonen and H. A. Santos, Int. J. Pharm., 2011, 414, 148–156 CrossRef CAS PubMed.
- L. Cao, H. Zhang, C. Cao, J. Zhang, F. Li and Q. Huang, J. Nanomater., 2016, 6, 1–13 CrossRef.
- Q. Shang, T. Zheng, Y. Zhang, J. Yin, Y. Shi and J. Iran, Polymer, 2012, 21, 731–738 CAS.
- P. W. Ayers, R. G. Parr and R. G. Pearson, J. Chem. Phys., 2006, 124, 1–9 Search PubMed.
- R. G. Pearson, J. Chem. Sci., 2005, 117, 369–377 CrossRef CAS.
- H. Chen, Y. Lin, H. Zhou, X. Zhou, S. Gong and H. Xu, J. Agric. Food Chem., 2016, 64, 8095–8102 CrossRef CAS PubMed.
- S. T. Kurwadkar, D. Dewinne, R. Wheat, D. G. Mcgahan and F. L. Mitchell, J. Environ. Sci. Health, Part B, 2013, 48, 237–242 CrossRef CAS PubMed.
- G. M. S. ElShafei, I. M. A. ElSherbiny, A. S. Darwish and C. A. Philip, Chem. Eng. Res. Des., 2014, 92, 461–470 CrossRef CAS.
- J. Zhang, Y. Duan, Q. Zhou, C. Zhu, M. She and W. Ding, Chem. Eng. J., 2016, 294, 281–289 CrossRef CAS.
- X. Li, L. Wang, Q. Xia, Z. Liu and Z. Li, Catal. Commun., 2011, 14, 15–19 CrossRef CAS.
- J. Xiao, G. Bian, W. Zhang and Z. Li, J. Chem. Eng. Data, 2010, 55, 5818–5823 CrossRef CAS.
- Q. Xia, Z. Li, L. Xiao, Z. Zhang and H. Xi, J. Hazard. Mater., 2010, 179, 790–794 CrossRef CAS PubMed.
- S. J. Gregg and K. S. W. Sing, J. Phys. Chem. C, 1951, 55, 592–597 CrossRef CAS.
- R. Q. Long and R. T. Yang, J. Am. Chem. Soc., 2001, 123, 2058–2059 CrossRef CAS PubMed.
- K. Zhang, W. H. Cheung and M. Valix, Chemosphere, 2005, 60, 1129–1140 CrossRef CAS PubMed.
- X. Li, Z. Li, Q. Xia, H. Xi and Z. Zhao, Adsorpt. Sci. Technol., 2006, 24, 363–374 CrossRef CAS.
- Q. Xia, Z. Li, L. Xiao, Z. Zhang and H. Xi, J. Hazard. Mater., 2010, 179, 790–794 CrossRef CAS PubMed.
- A. Alfarra, E. Frackowiak and F. Beguin, Appl. Surf. Sci., 2004, 228, 84–92 CrossRef CAS.
- R. G. Pearson, J. - Am. Water Works Assoc., 1963, 85, 3533–3539 CAS.
- T. Liu, Y. Li, Q. Du, J. Sun, Y. Jiao, G. Yang, Z. Wang, Y. Xia, W. Zhang, K. Wang, H. Zhu and D. Wu, Colloids Surf., B, 2012, 90, 197–203 CrossRef CAS PubMed.
- S. H. Wang, H. Y. Niu and T. Zeng, CrystEngComm, 2014, 16, 5598–5607 RSC.
- X. Rong, F. Qiu, C. Zhang, L. Fu, Y. Wang and D. Yang, Powder Technol., 2015, 275, 322–328 CrossRef CAS.
- R. G. Pearson and E. O. Afoakwa, J. Am. Chem. Soc., 1983, 105, 7512–7516 CrossRef.
- S. Shakoor and A. Nasar, J. Taiwan Inst. Chem. Eng., 2016, 66, 154–163 CrossRef CAS.
- R. G. Pearson, Science, 1966, 151, 172–177 CAS.
- J. L. Gazquez, J. Phys. Chem. A, 1997, 101, 4657–4659 CrossRef CAS.
- M. Tomizawa and J. E. Casida, Annu. Rev. Entomol., 2005, 45, 247–268 CAS.
- M. Tomizawa and J. E. Casida, Annu. Rev. Entomol., 2003, 48, 339–364 CrossRef CAS PubMed.
Footnote |
| † Electronic supplementary information (ESI) available: The molecular size and 3D structure of TM and kinetics of TM controlled-release from PCSEs. See DOI: 10.1039/c7ra04595f |
| This journal is © The Royal Society of Chemistry 2017 |

