 Open Access Article
Creative Commons Attribution 3.0 Unported Licence
Development of a hollow carbon sphere absorber displaying the multiple-reflection effect to attenuate electromagnetic waves
Dong-Ping Liac,
Yan-Chun Sunb,
Xuan Wang *a,
Song Wub,
Shi-Cheng Han*b and
Ying Yangc
aState Key Laboratory Breeding Base of Heilongjiang Provincial Dielectrics Engineering, Harbin University of Science & Technology, Harbin 150080, P. R. China. E-mail: hrbustwx@sina.com; Fax: +86-0451-86391668; Tel: +86-0451-86391668
bHeilongjiang River Fisheries Research Institute of Chinese Academy of Fishery Sciences/Laboratory of Quality & Safety Risk Assessment for Aquatic Products (Harbin), Ministry of Agriculture, Harbin 150070, P. R. China. E-mail: hljhsc@126.com; Tel: +86-0451-87930949
cCollege of Chemical and Environmental Engineering, Harbin University of Science & Technology, Harbin 150080, P. R. China
First published on 1st August 2017
Abstract
The development and use of hollow amorphous carbon spheres has been considered to be an efficient strategy to combat severe electromagnetic interference. In the current work, hollow carbon spheres were treated at various high temperatures to improve their graphitization levels and conductivity loss abilities in an attempt to best eliminate the unwanted electromagnetic wave. Of the various samples tested, the hollow carbon spheres obtained at 900 °C showed the best and excellent electromagnetic absorption, with a reflection loss value (RLmin) of up to −23.0 dB and the ability to effectively absorb frequencies spanning a range of 4.4 GHz, when using a sample layer with a thickness of only 1.5 mm. A mechanism for the electromagnetic absorption was proposed. Besides the strong conductivity, the occurrence of multiple reflections of electromagnetic waves in the interior void was indicated to strengthen the attenuation of the electromagnetic wave.
1. Introduction
Amorphous carbon displays advantages such as having a very large storage capacity and being easy and inexpensive to produce, and hence is widely applied in areas such as energy storage, Li batteries, catalysis, and electromagnetic fields.1–4 To the best of our knowledge, the conductivity level of amorphous carbon is easy to tune, which can be accomplished by adjusting the carbonization temperature.5 In this regard, the graphitization level of amorphous carbon is different at different temperatures, and changes in this level lead to changes of its conductivity.5 Overall, the conductivity of amorphous carbon is moderate as compared to other carbon materials like graphene, graphite etc.6–8 Based on this consideration, amorphous carbon has a huge potential for combating the serious electromagnetic interference issue (EMI) if serving as an electromagnetic absorber.9 In recent years, the rapid development of electronic, wireless communication techniques has resulted in increasing levels of electromagnetic pollution.10–12 Finding materials that can eliminate these unwanted electromagnetic waves has been of general interest. Amorphous carbon has been selected as an electromagnetic absorber due to its moderate conductivity, which can balance its impedance matching and electromagnetic attenuation ability and thus lead to its displaying high-performance absorption properties.13,14Current research in this area is actually primarily focused on amorphous carbon composites, in which the amorphous carbon is usually combined with metal oxides or alloys (like FeCu).15,16 For example, an absorber with a core–shell structure was produced by Du et al.; here, the shells were made of amorphous carbon and the cores were Fe3O4 nanospheres. The reported minimum reflection loss value (RLmin) was as high as −20.6 dB.17 A carbon sphere@Fe@Fe3O4 composite was prepared by Lv et al. and the best RLmin value obtained was −40 dB.18 A CoFe@C product was synthesized by carrying out the thermal decomposition method as described by Zeng, and an RLmin of −43.5 dB was attained.19 These carbon composites showed good electromagnetic absorption properties. However, since amorphous carbon is generally combined with metal oxides or metals, it is difficult to have its integral density satisfy the requirements of commercial applications, especially in aircrafts and missiles.20 For this reason and because amorphous carbon usually suffers from dielectric loss,21,22 synthesizing amorphous carbon with high-performance electromagnetic absorption properties, while important, remains a challenge. Recent reports revealed electromagnetic absorbers with unique structures such as hollow structures, polyhedrons, etc. to display strong electromagnetic absorption properties due to the multiple-reflection effect. Until now, absorbers such as 12-faced Fe have been introduced.23 Based on this consideration, in the current work we designed and produced hollow carbon spheres by applying a classic template approach. This hollow carbon sphere was treated at a relatively high temperature to decrease its dielectric loss. Also, the electromagnetic absorption properties of our product were investigated.
2. Experimental section
2.1 Chemical reagents
We used tetraethylorthosilicate (TEOS), absolute ethanol, ammonia (NH4OH) (∼30 wt%), phenolic resin (PR) and formaldehyde of analytic grade.2.2 Preparation of silica template
The SiO2 template was prepared according to the modified Stober method.24 In a typical synthesis process, 50 mg of silica particles with an average diameter of ~200 nm and 2 mL of ammonia were added into a mixture containing 4 mL TEOS, 24 mL of distilled water, and 60 mL absolute ethanol. The resulting mixture was magnetically stirred at room temperature for 2 h, and the products of this stirring were washed and dried in air.2.3 Synthesis of hollow carbon spheres
Typically, a mass of 50 mg of the SiO2 spheres was dispersed into a solution made of ethanol (36 mL), distilled water (18 mL) and NH3 (0.84 mL). Then, 0.18 g phenolic resin and 0.16 mL formaldehyde were added into the mixture, which was then stirred for 2 h. The products were washed with distilled water and dried in air for 24 h. To remove the SiO2 template from these products, they were placed into an NaOH solution (1 M) for 24 h and then subjected to centrifugation to collect the SiO2-free forms of the products. Subsequent carbonizations at temperatures between 700 and 1000 °C for 30 min yielded hollow carbon spheres. In these processes, the temperature was raised at a rate of 1 °C min−1. The products obtained at 700, 800, 900 and 1000 °C are denoted below as S-700, S-800, S-900, S-1000, respectively.2.4 Characterizations
Powder X-ray diffraction (XRD) patterns were acquired to detect the amorphous state of the carbon spheres. These patterns were acquired using a Bruker D8 ADVANCE X-ray diffractometer with Cu Kα radiation (λ = 0.154178 nm with 40 kV scanning voltage, 40 mA scanning current and scanning range from 20° to 70°). The morphology of the hollow carbon sphere was also determined by performing transmission electron microscopy (TEM) with a JEM JEOL 2100.The graphitization levels of these carbon spheres were determined by acquiring their Raman spectra (HORIBA Jobin Yvon Co., Ltd). The electromagnetic absorption properties of these carbon spheres were evaluated by using the coaxial-line method as follows: the sample was homogeneously mixed the paraffin wax (filled ratio = 20 wt%) and then pressed into a cylindrically shaped ring with an outer diameter of 7.0 mm and an inner diameter of 3.04 mm; subsequently, a vector network tester analyzer (Anritsu 37269D) was applied to determine the values of the scattering parameters of the absorber.
The electromagnetic parameter S (ε′, ε′′, μ′, μ′′) values were then determined. Lastly, the RL curves were acquired by inputting these electromagnetic parameters into eqn (1) and (2).25
Zin = Zo(μr/εr)1/2![[thin space (1/6-em)]](https://www.rsc.org/images/entities/char_2009.gif) tanh[j(2πfd(μrεr)1/2/c)] tanh[j(2πfd(μrεr)1/2/c)]
| (1) |
RL (dB) = 20![[thin space (1/6-em)]](https://www.rsc.org/images/entities/char_2009.gif) log|(Zin − Zo)/(Zin + Zo)| log|(Zin − Zo)/(Zin + Zo)|
| (2) |
3. Results and discussion
Fig. 1a describes the process used to form the hollow carbon spheres. The SiO2 nanospheres with an average diameter of ∼200 nm were prepared at an early stage of this process by following the Stober method. The second step was to prepare the SiO2@C composite via the liquid-phase approach. Then, an NaOH solution was applied to remove the SiO2 template and form a hollow structure. Finally, the hollow carbon spheres (HCSs) were thermally decomposed, at various temperatures, to increase their conductivity values.27 Fig. 1b and c show low-resolution TEM images of the S-700 product; hollow structures were observed in these images. The average diameter of the voids of the carbon spheres was equal to the average diameter of the silicon particles, and the average thickness of their shells was observed to be about 25 nm. The powder XRD patterns of the hollow carbon spheres (Fig. 1d) were acquired to analyze their phase structures.28 A diffraction peak at ∼21.6° was observed for each product, and this peak corresponded to the (002) crystal plane. In each case, this peak was broad and no other diffraction peak was observed, and these results suggested the amorphous state for each hollow carbon sphere product.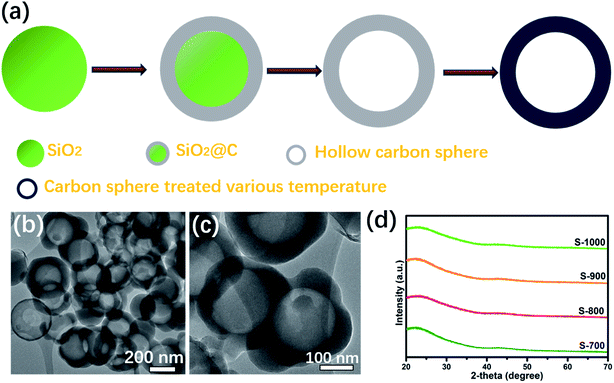 | ||
| Fig. 1 (a) Schematic illustration of the synthesis of the hollow carbon sphere. (b and c) TEM images of the carbon spheres treated at 700 °C. | ||
An efficient way to determine the graphitization levels of such products is to acquire their Raman spectra. Generally, a Raman spectrum of a carbon material shows two peaks, at 1350 and 1590 cm−1, corresponding to the D and G bands, respectively.29–31 Commonly, the ratio of the intensity of the D band (ID) to that of the G band (IG) represents the graphitization level. A low ID/IG ratio value is indicative of good levels of graphitization and conductivity.32 A more conductive electromagnetic absorber material shows more dielectric loss due to stronger conductivity loss behavior. As shown in Fig. 2a and d–g bands were found for the hollow products, indicating the presence of carbon materials. The calculated ID/IG values are shown in Fig. 2b. These ratios were calculated to be 1.02, 0.97, 0.85 and 0.77 for the S-700, S-800, S-900, S-1000 products, respectively. These results confirmed the greater degree of graphitization resulting from the higher carbonization temperature.
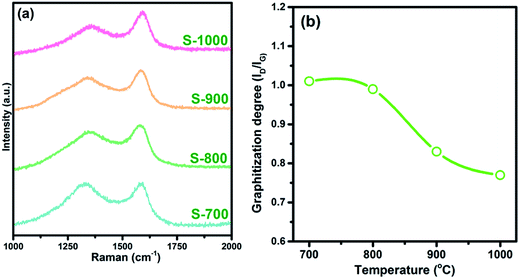 | ||
| Fig. 2 (a) Raman spectra and (b) calculated ID/IG ratio values of the hollow carbon spheres treated at 700–1000 °C. | ||
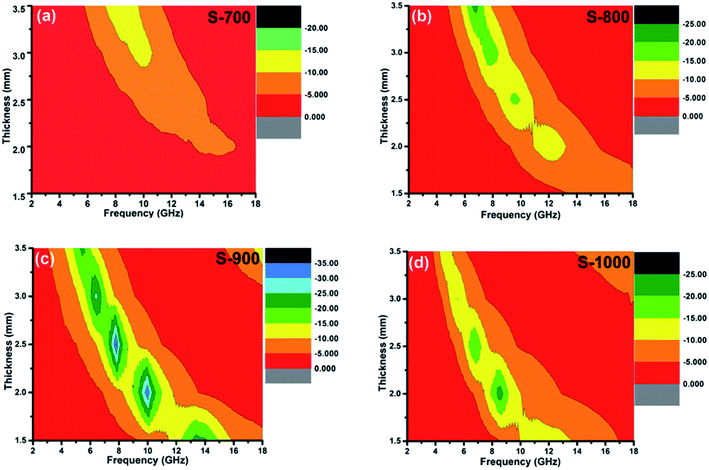
The electromagnetic absorption properties of these hollow carbon spheres are shown in Fig. 3. Usually, a good electromagnetic absorber effectively absorbs electromagnetic radiation of a broad range of frequencies. At this frequency region, the RL value is smaller than −10 dB, corresponding to a 90% attenuation of incident electromagnetic waves. Electromagnetic absorption is related to the thickness of the absorption layer, with very thick layers aggravating the burden. Thus, it is important to produce relatively thin absorption layers that absorb a broad range of frequencies.33 Fig. 3a shows the electromagnetic absorption properties of the S-700 sample. No effective absorption was observed for an absorption layer thinner than 3.0 mm, and only a narrow frequency region, less than 2.0 GHz, was observed when the sample thickness was 3.0 mm. The S-800 sample showed better absorption of electromagnetic radiation, with effective absorption even for thin layers: at thicknesses of 2.0 mm 2.5 mm, it effectively absorbed radiation spanning 1.5 GHz and 2.0 GHz, respectively (Fig. 3b). Of the four samples, that prepared at 900 °C showed the best electromagnetic absorption properties: at a thickness of only 1.5 mm, S-900 effectively absorbed radiation spanning 4.4 GHz (Fig. 3c), much better than that of similar carbon absorbers (Table 1).34–40 Further increasing the carbonization temperature decreased the span of frequencies that was effectively absorbed: at a thickness of 1.5 mm, S-1000 effectively absorbed radiation spanning only 3.2 GHz (Fig. 3d).
| Sample | fE (GHz) | RLmin (dB) | Thickness (mm) | Filling fraction | Adhesive matrix | Ref. |
|---|---|---|---|---|---|---|
| HCS | 4.8 | −50.8 | 1.9 | 20 wt% | Paraffin wax | 34 |
| N-Graphene | 0 | −6.9 | N.A. | N.A. | Paraffin wax | 35 |
| Carbon fiber | ∼3.0 | −12 | 3.0 | 1 | Paraffin wax | 36 |
| Co/porous carbon | 4.4 | −40.19 | 1.8 | 30 wt% | Paraffin wax | 37 |
| Porous carbon sphere | 4.8 | −84 | 3.9 | 20 wt% | Paraffin wax | 38 |
| C/ZnO | ∼4.0 GHz | −52 | 1.75 | 40 wt% | Paraffin wax | 39 |
| Solid carbon sphere | 0 | ∼9.0 | 1.5 | 10 wt% | Paraffin wax | 40 |
| Hollow carbon sphere | 4.4 | −23.0 | 1.5 | 20 wt% | Paraffin wax | This work |
As for the dielectric loss material, the dielectric parameters including the real and imaginary parts of the permittivity values (ε′/ε′′) determine the final electromagnetic absorption properties, and are thus provided in Fig. 4 to better understand the electromagnetic absorption mechanism.41,42 As shown in Fig. 4a, S-1000 achieved the greatest ε′ values (15.7–14.6) while S-700 achieved the lowest (7.4–6.6); note that ε′ is influenced by the graphitization level. The ε′′ values of the samples (Fig. 4b) followed the same trend as did the ε′ values. But in contrast to ε′, ε′′ is related to the dielectric loss, which results from a synergistic effect of conductivity and polarization.43 Generally speaking, if the dielectric loss of an absorber results from a loss in conductivity, its ε′′ deceases with increasing frequency. But if the polarization effect happens at the absorber, the ε′′ value generally peaks at a certain point corresponding to the polarization effect.44 In the frequency range tested, no peak in the ε′′ value was observed for any of the samples of the current work, indicating a weak polarization effect. A good understanding of the polarization process can also be attained by investigating the presence of a Cole–Cole semicircle. In detail, the relative complex permittivity can be plotted by applying the above equations.45,46
 | (3) |
 | (4) |
 | (5) |
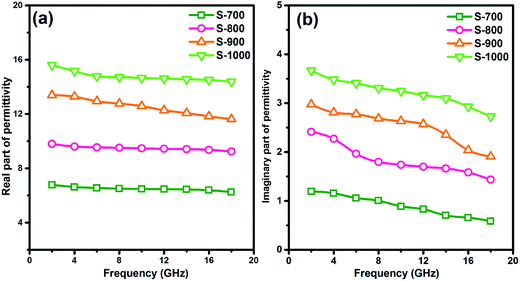 | ||
| Fig. 4 The (a) real and (b) imaginary parts of the permittivity values of the hollow carbon spheres. | ||
Based on the eqn (4) and (5), ε′ − ε′′ can be expressed as above.
| (ε′ − ε∞)2 + (ε′′)2 = (εS − ε∞)2 | (6) |
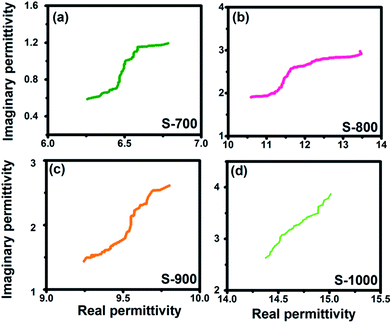
If a plot of ε′ − ε′′ resembles a semicircle, it is called a Cole–Cole semicircle. Each Cole–Cole semicircle represents one Debye relaxation process. As seen in Fig. 5a–d, these hollow carbon spheres did not yield any Cole–Cole semicircle, and thus the polarization effect for these spheres can be ignored. Thus, the loss in conductivity was attributed primarily to dielectric loss. According to calculations using the free electron theory, the S-1000 samples achieved the greatest conductivity values while S700 showed the lowest values (Fig. 6a).47–49 While for the nonmagnetic material (μr = 1), a larger εr value damages the impedance matching value, as seen in Fig. 6b. Thus we found that S-1000, having the largest εr value, still suffered from poor impedance matching and showed poorer electromagnetic absorption than did the optimal S-900 sample.47
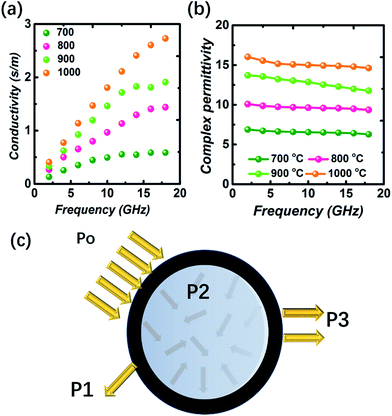 | ||
| Fig. 6 (a) The conductivity values and (b) complex permittivity values of the four products. (c) A proposed model for how the hollow carbon sphere may attenuate an electromagnetic wave. | ||
Additionally, the unique hollow structure of the spheres we made also contributed to their electromagnetic attenuation by displaying the electromagnetic wave multiple-reflection effect.50 To gain a better understanding of this electromagnetic scattering effect, the routes taken by the incident electromagnetic wave should be known (see Fig. 6c). The incident electromagnetic wave (denoted as P0) can be separated into a few parts by the spheres. One part of the electromagnetic wave can be indirectly reflected from the surface of the absorption layer (P1). The impedance matching behavior determines the intensity of this reflection loss. The remaining electromagnetic wave enters the absorption layer and becomes partially attenuated due to the dielectric loss ability of the absorber (P2). Any unattenuated electromagnetic wave can be transmitted through the absorption layer or reflected from the surface (P3). An absorber with a hollow structure may be expected to have more multiple reflections and fewer transmissions or reflections of electromagnetic waves.
To demonstrate this multiple-reflection effect, a control experiment was conducted by producing a solid carbon sphere with the same carbonization temperature (900 °C). A TEM image of this product (Fig. 7a) confirmed its solid spherical nature, and a broad diffraction peak seen in its XRD (Fig. 7b) indicated its amorphous state. The calculated span of frequencies that a 1.5 mm-thick layer of this sample effectively absorbed was only 2.7 GHz, much smaller than that of the corresponding hollow structure (Fig. 7c). Both the ε′′ and ε′′ values were found to be not greater than those of the hollow structure (Fig. 7d). These results taken together indicated better electromagnetic absorption by the hollow structure than by the solid structure, which was attributed to the multiple reflections possible only in the hollow structure.
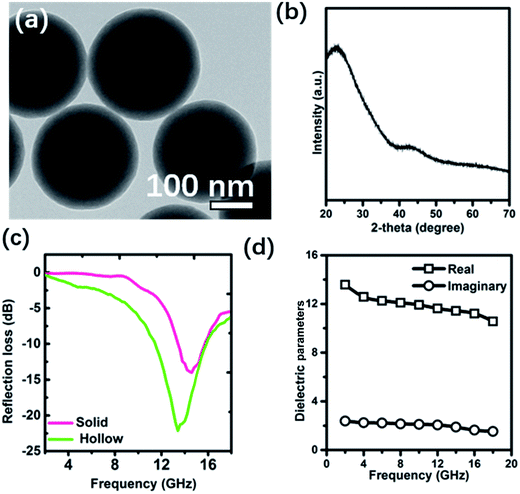 | ||
| Fig. 7 (a) TEM image, (b) XRD pattern, (c) reflection loss curves (d = 1.5 mm), and (d) dielectric parameters of the solid carbon spheres (900 °C). | ||
4. Conclusions
In the current research, a hollow amorphous carbon sphere was produced using the template method in which SiO2 served as the template. Hollow carbon spheres treated at various temperatures resulted in different graphitization levels and conductivity loss abilities. The hollow carbon spheres treated at 900 °C yielded the best RLmin value, at −23.0 dB, and effectively absorbed the widest range of frequencies, specifically 4.4 GHz, at a coating thickness of only 1.5 mm. A mechanism of this electromagnetic absorption was proposed, and the excellent absorption of the hollow spheres was attributed to their conductivity loss and multiple-reflection effect.Acknowledgements
This work was supported by the National Basic Research Program of China under project No. 2012CB723308 and the Special Scientific Research Funds for Central Non-profit Institutes, Heilongjiang River Fishery Research Institute (HSY201402).References
- N. Jayaprakash, J. Shen, S. S. Moganty, A. Corona and L. A. Archer, Angew. Chem., Int. Ed., 2011, 123, 6026–6030 CrossRef.
- T. TesfuZeru, M. Sakthivel and J. F. Drillet, Appl. Catal., B, 2017, 204, 173–184 CrossRef CAS.
- K. X. Wang, H. L. Niu and J. S. Chen, Appl. Surf. Sci., 2017, 4040, 138–145 CrossRef.
- L. Kong, X. W. Yin, M. K. Han, X. Y. Yuan, Z. X. Hou, F. Ye, L. T. Zhang, L. F. Cheng, Z. W. Xu and J. F. Huang, Carbon, 2017, 111, 94–102 CrossRef CAS.
- H. L. Lv, Y. H. Guo, Z. H. Yang, Y. Cheng, L. Y. P. Wang, B. S. Zhang, Y. Zhao, Z. C. J. Xu and G. B. Ji, J. Mater. Chem. C, 2017, 5, 491–512 RSC.
- L. W. Jiang, Z. H. Wang and D. Y. Geng, J. Phys. Chem. C, 2016, 49, 28320–28329 Search PubMed.
- M. K. Han, X. W. Yin, X. L. Li, B. Anasori, L. T. Zhang, L. F. Cheng and Y. Gogotsi, ACS Appl. Mater. Interfaces, 2017, 9, 20038–20045 CAS.
- O. Balci, E. O. Polat, N. Kakenov and C. Kocabas, Nat. Commun., 2015, 6, 6628–6636 CrossRef CAS PubMed.
- Z. G. Xiang, D. Wang, Y. H. Xue, L. Dai, J. F. Chen and D. P. Cao, Sci. Rep., 2015, 5, 8307–8314 CrossRef CAS PubMed.
- C. Zhou, S. Geng, X. Xu, T. H. Wang, L. Q. Zhang, X. J. Tian, F. Yang, H. T. Yang and Y. F. Li, Carbon, 2016, 108, 234–241 CrossRef CAS.
- M. Najim, G. Modi, Y. K. Mishra, R. Adelung, D. Singh and V. Agarwala, Phys. Chem. Chem. Phys., 2015, 17, 22923–22933 RSC.
- Y. Yong, Y. Yang, X. Wen and D. Jun, J. Appl. Phys., 2014, 115, 17A521–17A528 CrossRef.
- X. Liu, L. S. Wang, Y. Ma, H. F. Zheng, L. Lin, Q. F. Zhang, Y. Z. Chen, Y. L. Qiu and D. L. Peng, ACS Appl. Mater. Interfaces, 2017, 9, 7601–7610 CAS.
- Z. G. An and J. J. Zhang, Dalton Trans., 2016, 2881–2887 RSC.
- F. Meng, W. Wei, X. N. Chen, X. L. Xu, M. Jiang, L. Jun, Y. Wang and Z. W. Zhou, Phys. Chem. Chem. Phys., 2016, 18, 2510–2516 RSC.
- J. S. Deng, Y. H. Lei, S. M. Wen and Z. X. Chen, Int. J. Miner. Process., 2015, 140, 43–49 CrossRef CAS.
- Y. C. Du, W. W. Liu, R. Qiang, Y. Wang, X. J. Han, J. Ma and P. Xu, ACS Appl. Mater. Interfaces, 2014, 6, 12997–13006 CAS.
- H. L. Lv, G. B. Ji, W. Liu, H. Q. Zhang and Y. W. Du, J. Mater. Chem. C, 2015, 3, 10232–10241 RSC.
- X. J. Zeng, B. Yang, L. Y. Zhu, H. Z. Yang and R. H. Yu, RSC Adv., 2016, 6, 105644–105652 RSC.
- T. Wu, Y. Liu, X. Zeng, T. T. Cui, Y. T. Zhao, Y. N. Li and G. X. Tong, ACS Appl. Mater. Interfaces, 2016, 8, 7370–7380 CAS.
- S. Qiu, H. L. Lv, J. R. Liu, Y. Z. Liu, N. N. Wu and W. Liu, ACS Appl. Mater. Interfaces, 2016, 8, 20258–20266 CAS.
- X. S. Qi, J. L. Xu, W. Zhong and Y. W. Du, RSC Adv., 2015, 5, 16010–16016 RSC.
- H. L. Lv, H. Q. Zhang, J. Zhao, G. B. Ji and Y. W. Du, Nano Res., 2016, 11, 5974–5983 Search PubMed.
- C. Xia and H. N. Alshareef, Chem. Mater., 2015, 27, 4661–4668 CrossRef CAS.
- H. L. Lv, X. H. Liang, G. B. Ji, H. Q. Zhang and Y. W. Du, ACS Appl. Mater. Interfaces, 2015, 7, 9776–9783 CAS.
- H. L. Lv, X. H. Liang, Y. Cheng, H. Q. Zhang, D. M. Tang, B. S. Zhang, G. B. Ji and Y. W. Du, ACS Appl. Mater. Interfaces, 2015, 7, 4744–4750 CAS.
- Y. Ito, Y. Tanabe, J. H. Han, T. Fujita, K. Tanigaki and M. W. Chen, Adv. Mater., 2015, 27, 4302–4307 CrossRef CAS PubMed.
- J. S. Deng, S. M. Wen, Y. J. Xian, J. Liu and S. J. Bai, Trans. Nonferrous Met. Soc., 2014, 24, 3955–3963 CrossRef CAS.
- H. L. Lv, Y. H. Guo, G. L. Wu, G. B. Ji, Y. Zhao and Z. C. J. Xu, ACS Appl. Mater. Interfaces, 2017, 9, 5660–5668 CAS.
- H. Shan, X. F. Li, Y. H. Cui, D. B. Xiong, B. Yan, D. J. Li, A. Lushington and X. L. Sun, Electrochim. Acta, 2016, 205, 188–197 CrossRef CAS.
- C. Q. Song, X. W. Yin, M. K. Han, X. L. Li, Z. X. Hou, L. T. Zhang and L. F. Cheng, Carbon, 2017, 116, 50–58 CrossRef CAS.
- J. S. Deng, S. M. Wen, M. X. Chen, Y. J. Xian and D. D. Wu, Metall. Mater. Trans. A, 2014, 45, 2445–2452 CrossRef CAS.
- T. Liu, X. B. Xie, Y. Pang and S. Kobayashi, J. Mater. Chem. C, 2016, 4, 1727 RSC.
- C. Zhou, S. Geng, X. W. Xu, T. H. Wang, L. Q. Zhang, X. J. Tian, F. Yang, H. T. Yang and Y. F. Li, Carbon, 2016, 108, 234 CrossRef CAS.
- C. Wang, X. J. Han, P. Xu, X. L. Zhang, Y. C. Du and S. R. Hu, App. Phys. Lett., 2011, 09, 072906–072910 CrossRef.
- W. Xie, H. Cheng, Z. Chu, Z. Chen and C. Long, Ceram. Int., 2011, 37, 1947–1951 CrossRef CAS.
- Q. Lian, L. D. Wang, H. J. Wu and H. Wu, J. Mater. Chem. C, 2015, 3, 5056–5064 RSC.
- H. L. Xu, X. W. Yin, M. Zhu, M. K. Han, Z. X. Hou, X. L. Li and L. T. Zhang, ACS Appl. Mater. Interfaces, 2017, 9, 6332–6341 CAS.
- M. K. Han, X. W. Yin, S. Ren, W. Y. Duan, L. T. Zhang and L. F. Cheng, RSC Adv., 2016, 6, 6467–6474 RSC.
- H. L. Lv, Y. H. Guo, Y. Zhao, H. Q. Zhang, B. S. Zhang, G. B. Ji and Z. C. J. Xu, Carbon, 2016, 110, 130–137 CrossRef CAS.
- W. L. Song, M. S. Cao, L. Z. Fan, M. M. Lu, Y. Li, C. Y. Wang and H. F. Ju, Carbon, 2014, 77, 130–142 CrossRef CAS.
- M. S. Cao, W. L. Song, Z. L. Hou, B. Wen and J. Yuan, Carbon, 2010, 48, 788–796 CrossRef CAS.
- X. J. Zhang, G. S. Wang, W. Q. Cao, Y. Z. Wei, J. F. Liang, L. Guo and M. S. Cao, ACS Appl. Mater. Interfaces, 2014, 6, 7471–7478 CAS.
- T. Liu, P. H. Zhou, J. L. Xie and L. J. Deng, J. Appl. Phys., 2012, 111, 093905–093910 CrossRef.
- L. Zhang, X. H. Zhang, G. J. Zhang, Z. Zhang, S. Liu, P. F. Li, Q. L. Liao, Y. G. Zhao and Y. Zhang, RSC Adv., 2015, 5, 10197–10203 RSC.
- J. S. Deng, Q. B. Wang, Y. Y. Zhou, B. Zhao and R. Zhang, RSC Adv., 2017, 7, 9294–9302 RSC.
- Z. Wang and G. L. Zhao, J. Mater. Chem. C, 2014, 2, 9406–9411 RSC.
- M. S. Cao, W. L. Song, B. Wen and J. Yuan, Carbon, 2010, 788, 796 Search PubMed.
- H. L. Lv, G. B. Ji, X. H. Liang, H. Q. Zhang and Y. W. Du, J. Mater. Chem. C, 2015, 3, 5056–5064 RSC.
- M. K. Han, X. W. Yin, L. Kong, M. Li, W. Y. Duan, L. T. Zhang and L. F. Cheng, J. Mater. Chem. A, 2014, 2, 16403–16409 CAS.
| This journal is © The Royal Society of Chemistry 2017 |

