DOI:
10.1039/C7RA04540A
(Paper)
RSC Adv., 2017,
7, 33627-33634
Kinetics and mechanistic investigation into the degradation of naproxen by a UV/chlorine process†
Received
23rd April 2017
, Accepted 28th June 2017
First published on 3rd July 2017
Abstract
In this study, UV irradiation combined with chlorine (UV/chlorine) was used to degrade naproxen (NPX), a typical non-steroidal anti-inflammatory drug (NSAID) widely used for the treatment of symptoms associated with inflammation, in water. Compared with UV irradiation alone and direct chlorination, the UV/chlorine process shows a synergistic effect on NPX degradation. The effects of different factors, including the chlorine dose, solution pH, and the presence of Cl−, HCO3− or humic acid (HA), on NPX degradation in the UV/chlorine process were investigated. The results indicated that the degradation of NPX followed pseudo-first-order kinetics in all cases, and the rate constant increased as the chlorine dose increased and decreased as the pH increased. The effects of the water matrix on UV/chlorine treatment were species-dependent. The NPX degradation rate was inhibited by the presence of HCO3− and HA but significantly improved by Cl−. LC/MS/MS analysis indicated that NPX decomposition in the UV/chlorine process was associated with decarboxylation, demethylation and hydroxylation. These results indicate that the UV/chlorine process is a promising technology for the treatment of water polluted by emerging contaminants, such as NPX. However, UV/chlorine can notably enhance the formation of disinfection by-products compared to direct chlorination, which should be carefully considered when integrating this process into drinking water treatment schemes.
1. Introduction
In recent years, pharmaceutical and personal care products (PPCPs) have been the subject of increasing concern around the world as emerging contaminants. PPCPs are widely used as veterinary therapeutic drugs to prevent and treat human and animal diseases and improve the quality of life of humans.1 Many PPCPs can be easily transported and distributed in water bodies due to their high polarity and low volatility.2 Because of their extensive applications and poor removal in conventional wastewater treatment plants, PPCPs are ubiquitous in aquatic environments.3 PPCPs are commonly detected in waters at concentrations ranging from ng L−1 to low μg L−1. Even these trace levels are enough to cause hazardous effects on human health and ecosystems.4,5 As a typical PPCP, naproxen belongs to the class of non-steroidal anti-inflammatory drugs (NSAIDs) and is widely used in the treatment of arthritis, ankylosing spondylitis, acute muscle pain, and other symptoms associated with inflammation. Most of these drugs are usually partly metabolized or simply pass through human body. NPX is frequently detected in WWTFs, surface water, or even groundwater.6–8 It has been reported that naproxen can impair the lipid peroxidation system of bivalves and change microbial community structures to yield antibiotic resistance.9 Like most other PPCPs, naproxen seems to be resistant to conventional wastewater treatment. According to Carballa et al., the overall removal efficiency of NPX in a sewage treatment plant was approximately 40–55%.10 Therefore, it is important to make use of technologies that focus on removing such drugs from points of discharge.
Advanced oxidation processes (AOPs) have often gained recognition as a promising approach towards removing recalcitrant organic pollutants in water. The hydroxyl radicals (˙OH) formed during AOPs, with a high reduction potential of 2.9 V in AOPs, are capable of destroying or mineralizing most organic compounds with high reaction rate constants.11 The combination of UV irradiation and chlorine (UV/chlorine) has recently been examined as an effective AOP for PPCPs removal from water.12 Several reactive species, including ˙OH and reactive chlorine species (RSC) such as ˙Cl and Cl2˙−, can be formed through reactions occurring in the UV/chlorine system (eqn (1)–(5)).13 ˙Cl and Cl2˙− have reduction potentials of 2.4 V and 2.0 V, respectively, which are comparable to that of ˙OH, and can degrade the target contaminants.12
| | |
HOCl + hv → ˙OH + ˙Cl
| (2) |
| | |
OCl− + hv → ˙Cl + ˙O−
| (3) |
| | |
˙O− + H2O ↔ ˙OH + OH−
| (4) |
In general, the UV/chlorine process combines the advantages of UV/H2O2 and chlorination processes, which is an economical, efficient, and easy to operate AOP. The UV/chlorine process is more efficient than UV photolysis or chlorination in the degradation of atrazine (ATZ), and the degradation efficiency of ATZ is sensitive to the solution pH, as well as common anions in real waters.14 There is a clear synergistic effect between UV and chlorine on the degradation of carbamazepine during the UV/chlorine process, and the initial oxidation products of CBZ resulted from hydroxylation, carboxylation and hydrogen atom abstraction by ˙OH and ˙Cl.15 Wu et al. compared the change in the acute toxicity of a trimethoprim solution at different reaction times in the chlorination and UV/chlorine processes, and found that the acute toxicity resulting from UV/chlorine was lower than that from direct chlorination, with the same removal rate of trimethoprim.16 Additionally, UV irradiation can effectively inactive chlorine-tolerant pathogenic microorganisms (e.g., Cryptosporidium parvum and Giardia lamblia) and is often used in conjunction with chlorine in a complementary manner.17 However, as a chlorine-derivate treatment, this process runs the risk of forming chlorinated products during degradation. It has been reported that more disinfection by-products (DBPs) precursors were formed during the UV/chlorine process than during UV irradiation or direct chlorination, which is of concern in water treatment processes.18
Therefore, the aim of this study is to evaluate the removal efficiency of NPX by the UV/chlorine process, along with the influence of factors such as chlorine doses, solution pH, Cl−, HCO3− and humic acid (HA) on NPX removal in water. Moreover, the degradation pathways of NPX during UV/chlorine were proposed according to LC/MS/MS analysis. Finally, we compare the disinfection by-products (DBPs) formation during the treatment of NPX by direct chlorination and UV/chlorine processes.
2. Materials and methods
2.1. Materials and reagents
Naproxen was purchased from Sigma-Aldrich (USA). Sodium hypochlorite (NaOCl) containing 5% free chlorine was obtained from Sinopharm Chemical Reagent Co., Ltd. (Shanghai, China). HPLC-grade acetonitrile used as the mobile phase was obtained from J. T. Baker (USA). DBPs standard solutions were also purchased from Sigma-Aldrich. All other chemicals were at least of analytical grade and were used without further purification. All solutions were prepared with ultrapure water produced from a Milli-Q water purification system (Millipore, USA).
2.2. Experimental procedures
All experiments were conducted in a collimated beam apparatus (Fig. S1†).19 The equipment consists of a low-pressure UV Hg lamp (UV-C, 75 W, Philips, Netherlands), a lampshade used to parallel the light, two reaction dishes, two magnetic stirrers, and two rest pier. The average irradiation strength on the solution was calculated to be approximately 261 μW cm−2, using atrazine chemical actinometry.20 Before each experiment, the lamp was turned on for at least 30 min to stabilize the lamp output. The degradation of NPX by UV/chlorine process was conducted by spiking specific amounts of chlorine into a 100 mL testing solution containing 25 μM NPX and 10 mM phosphate buffer to give an initial chlorine dosage of 125–375 μM and pH of 5–9, and oxidation was initiated once the Petri dishes were moved under the collimated beam apparatus. UV photolysis alone and direct chlorination of NPX were conducted without spiking with chlorine solution and UV irradiation, respectively. At each determined time, 0.8 mL of sample was collected into an HPLC vial containing excess Na2S2O3 to quench the residual chlorine. And the samples were immediately analyzed by HPLC for NPX concentration and LC/MS/MS for degradation products. In addition, 10 mL or 40 mL of reaction solution was transferred into a glass volumetric bottle for TOC or DBPs analysis, respectively.
2.3. Analytical methods
The concentration of NPX was measured by using a high performance liquid chromatography (HPLC) (Waters e2695, USA) equipped with a symmetry C18 column (4.6 mm × 250 mm, 5 μm, Waters, USA) by an UV detector wavelength of 230 nm. The mobile phase for naproxen consisted of 70%/30% (v/v) acetonitrile and 0.1% formic acid in Milli-Q water at a flow rate of 0.8 mL min−1. The sample injection volume was 10 μL. The evolution of the reaction mixtures was also monitored using a TU-19 UV-vis spectrophotometer (Puxi, Beijing, China).
A stock solution of free chlorine was prepared from 5% liquid sodium hypochlorite and standardized by the DPD (N,N-diethyl-p-phenylenediamine, Sigma, >99%) colorimetric method.
The intermediate products of NPX formed during UV/chlorine process were analyzed by LC/MS/MS, which consisted of an HPLC system (Waters 2010, USA) and a TSQ Quantum mass spectrometer (ESI source, Thermo Scientific Inc., USA) with a Hypersil Gold C18 column (2.1 × 150 mm, 5 μm). The sample injection volume was 10 μL. The A and B mobile phases were 0.1% formic acid in Milli-Q water and acetonitrile, respectively, at a flow rate of 0.25 mL min−1. The elution started at 5% B, then linearly increased to 95% B over 15 min and was kept at 95% B for 5 min. After that, the elution was decreased to 95% B in the following 1 min and kept at 95% B for 4 min. The ESI conditions were as follows: spray voltage = 4500 V, sheath gas pressure = 20 au, aux gas pressure = 5 au, capillary temperature = 320 °C. MS chromatograms were obtained in both total ion current (TIC) mode, using full scans (m/z 50–400) for mass spectra acquisition, and selected ion monitoring (SIM) mode.
The degree of NPX mineralization was quantified by measurement of the reduction in the total organic carbon (TOC) in water. TOC analysis was measured using a TOC analyzer (Shimadzu TOC 5050A) equipped with an ASI5000 auto-sampler.
DBPs were quantified using a purge and trap sample concentrator (Eclipse 4660, OI, USA) and gas chromatography/mass spectrometry (GC/MS) (QP2010, Shimadzu, Japan). Details on the analysis of DBPs are available elsewhere.21
3. Results and discussion
3.1. Preliminary studies
The results of NPX degradation by UV alone, direct chlorination and the UV/chlorine process are shown in Fig. 1.
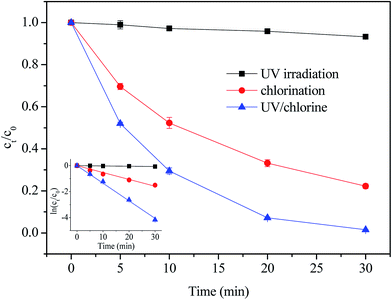 |
| | Fig. 1 Degradation of NPX by UV irradiation alone, direct chlorination and UV/chlorine process. Conditions: [NPX]0 = 25 μM, [chlorine]0 = 250 μM, pH = 7. | |
Generally, the degradation of NPX by UV irradiation alone was negligible, resulting in the removal of 6.5% in 30 min. The corresponding pseudo-first-order rate constant was 0.00223 min−1. In contrast, it seems that NPX is vulnerable to both chlorination and the UV/chlorine processes, as 77.8% and 98.5% of NPX was removed after 30 min by direct chlorination and UV/chlorine, respectively. The degradation of NPX by direct chlorination and UV/chlorine also followed pseudo-first-order kinetics, and the corresponding rate constants were 0.053 min−1 and 0.135 min−1, respectively.
Although the molar absorptivity of NPX at 254 nm can reach 4900 M−1 cm−1, the low efficiency photolysis of NPX attributes to its low quantum yield of 0.0093 mol per einstein.22 It has been demonstrated that chlorine oxidation can readily transform NPX into intermediates.23 In addition, the synergistic effect was clear in the UV/chlorine process, as the degradation rate of NPX increased by 1.54 times in the UV/chlorine process, compared to that in direct chlorination. The combination of UV and chlorine results in a stronger oxidation than direct chlorination due to the formation of highly reactive radical species, such as hydroxyl radicals (˙OH) and chlorine atoms (˙Cl), which have a stronger oxidation ability than free chlorine.12 An additional experiment was conducted to confirm the role of radicals in NPX degradation. As shown in Fig. S2,† various concentrations of tert-butanol (TBA) inhibited NPX degradation to different extent during the UV/chlorine process. As seen, the rate constant decreased from 0.135 min−1 to 0.058 min−1, respectively, with the addition of TBA increased from 0 mM to 25 mM ([TBA]0/[chlorine]0 = 0–100). And the rate constant almost kept constant with further increased in TBA concentration. The reported reaction rate constants for TBA with ˙OH and ˙Cl are 6 × 10⁸ M−1 s−1 and 3 × 10⁸ M−1 s−1, respectively, and thus, TBA may compete for ˙OH and ˙Cl, resulting in a decrease in the NPX degradation rate.24,25 Moreover, it seems that the addition of 25 mM TBA ([TBA]0/[chlorine]0 = 100) can enough inhibited the NPX degradation by ˙OH and ˙Cl. The above results indicated that both direct chlorination and radical oxidation contributed to the degradation of NPX by UV/chlorine oxidation.
3.2. Effect of chlorine dose
Semi-logarithmic graphs of [NPX]t/[NPX]0 with different chlorine doses as a function of time are shown in Fig. 2.
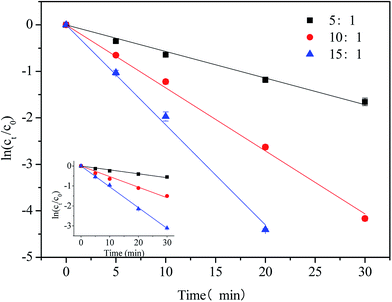 |
| | Fig. 2 Effect of [chlorine]0/[NPX]0 on the degradation of NPX by direct chlorination and UV/chlorine process. Conditions: [NPX]0 = 25 μM, [chlorine]0/[NPX]0 = 5![[thin space (1/6-em)]](https://www.rsc.org/images/entities/char_2009.gif) : :![[thin space (1/6-em)]](https://www.rsc.org/images/entities/char_2009.gif) 1, 10 1, 10![[thin space (1/6-em)]](https://www.rsc.org/images/entities/char_2009.gif) : :![[thin space (1/6-em)]](https://www.rsc.org/images/entities/char_2009.gif) 1, and 15 1, and 15![[thin space (1/6-em)]](https://www.rsc.org/images/entities/char_2009.gif) : :![[thin space (1/6-em)]](https://www.rsc.org/images/entities/char_2009.gif) 1, pH = 7. 1, pH = 7. | |
NPX degradation by both direct chlorination and UV/chlorine under different doses of chlorine is well fit by pseudo-first-order kinetics. With chlorine only, the degradation rate of NPX increased from 0.020 to 0.104 min−1 as the ratio of [chlorine]0/[NPX]0 increased from 5 to 15. Since direct chlorination plays an important role in the degradation of NPX, an increased concentration of chlorine will accelerate NPX degradation. In addition, the degradation rate of NPX by UV/chlorine also increased from 0.057 to 0.215 min−1 upon increasing the ratio of [chlorine]0/[NPX]0 from 5 to 15. The reactive radicals, including ˙OH and ˙Cl, increased as the free chlorine increased, which strengthened the oxidation in the UV/chlorine process. Moreover, the degradation rate constant of NPX in the UV/chlorine process exhibited a linear tread as a function of chlorine dose (k = 0.631[chlorine]0−0.0221, R2 = 0.99). Previous studies reported that an increase in the initial chlorine dose did not continuously ensure an increase in the degradation rate of NPX due to the scavenging of the reactive species by excess free chlorine.12,14 However, the inhibitory effect of excess chlorine was not observed, probably because the chlorine dose did not reach the critical level at which NPX degradation begins to slow. Considering that the effect of chlorine dose on the UV photolysis of NPX can be neglected, we determined that the contribution of the radical oxidation pathway slightly decreased from 61% to 50% as the ratio of [chlorine]0/[NPX]0 increased from 5 to 15.
3.3. Effect of pH
Semi-logarithmic graphs of [NPX]t/[NPX]0 at varies solution pH as a function of time are shown in Fig. 3.
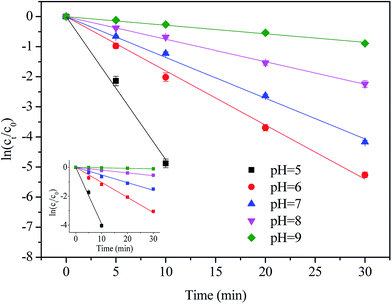 |
| | Fig. 3 Effect of solution pH on the degradation of NPX by direct chlorination and UV/chlorine process. Conditions: [NPX]0 = 25 μM, [chlorine]0 = 250 μM, pH = 5, 6, 7, 8 and 9. | |
As seen, the degradation rate of NPX in both direct chlorination and the UV/chlorine process is highly pH-dependent. As the solution pH increased from 5 to 9, the pseudo-first-order rate constant of direct chlorination decreased from 0.392 to 0.003 min−1, while that of the UV/chlorine process decreased from 0.475 to 0.028 min−1, respectively.
Because the ratio of chlorine dissociation products (HOCl and OCl−) is susceptible to the solution pH (pKa,HOCl = 7.5), chlorine exists mainly as HOCl at lower pH, and HOCl gradually transformed into OCl− as the solution pH increased; therefore, less HOCl is available for NPX oxidation.26 It has been reported that the oxidation capacity of OCl− towards drugs is weak compared with that of HOCl.27 Moreover, naproxen is a weak acid with a pKa of 4.15, and thus, the deprotonation of NPX increased as the pH increased.28 Therefore, the reaction between the two anionic forms at higher pH is less efficient than that at lower pH. During the UV/chlorine process, despite the fact that both HOCl and OCl− photolysis can produce ˙OH radicals, showing quantum yields at 254 nm of 1.4 and 0.97, respectively, the formation of ˙OH and ˙Cl was reduced at higher pH as determined by the decreased quantum yield.12 Of note, both HOCl and OCl− are also ˙OH and ˙Cl scavengers, and the rate constants of HOCl with ˙OH and ˙Cl are lower than that of OCl− (eqn (6)–(9)).12,29
| | |
˙OH + HOCl → H2O + ˙ClO, k = 8.46 × 10⁴ M−1 s−1
| (6) |
| | |
˙OH + OCl− → OH + ˙ClO, k = 9.0 × 10⁹ M−1 s−1
| (7) |
| | |
˙Cl + HOCl → H+ + Cl− + ˙ClO, k = 3.0 × 10⁹ M−1 s−1
| (8) |
| | |
˙Cl + OCl− → Cl− + ˙ClO, k = 8.2 × 10⁹ M−1 s−1
| (9) |
As a result, UV/chlorine achieves a higher removal efficiency at lower pH. In addition, the contribution of the radical oxidation pathway increased from 17.0% to 81.3% as the solution pH increased from 5 to 9.
3.4. Effect of aqueous matrix species
The Cl− anions, inorganic carbon (HCO3−/CO32−) and humic acid (HA) are common constituents in natural water, which have been demonstrated to have different impacts on the degradation of targeted pollutants by radical-based AOPs, it is necessary to evaluate the effect of these constituents.15 Semi-logarithmic graphs of [NPX]t/[NPX]0 under different matrix species (Cl−, HCO3− and HA) as a function of time are shown in Fig. 4. As seen, their effects on NPX decomposition were different. In the presence of 5 mM Cl−, the NPX degradation rate increased by 169.8% and 49.6% in the direct chlorination and UV/chlorine processes, respectively. The result is due to the fact that Cl2 can be formed from HOCl and Cl−, according to eqn (10), and the presence of Cl− shifts the reaction to the right.30 Since Cl2 is more electrophilic than HOCl, its presence accelerates NPX degradation.| | |
HOCl + H+ + Cl− ↔ Cl2 + H2O
| (10) |
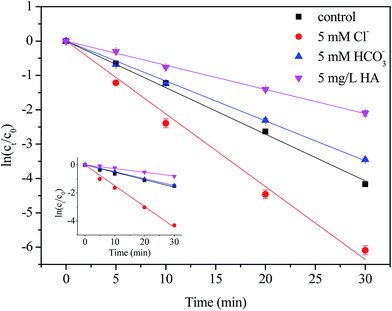 |
| | Fig. 4 Effect of matrix species on the degradation of NPX by direct chlorination and UV/chlorine process. Conditions: [NPX]0 = 25 μM, [chlorine]0 = 250 μM, pH = 7, [Cl−] = [HCO3−] = 5 mM, HA = 5 mg L−1. | |
On the other hand, ˙Cl and ˙OH produced during the UV/chlorine process reacts rapidly with Cl− to form ˙Cl2− and ClOH˙− separately, which are more selective and may affect the degradation efficiency of NPX (eqn (11)–(15)).12 Altogether, Cl− has a positive effect on NPX degradation in this study.
| | |
˙Cl + Cl− → Cl2˙−, k = 6.5 × 10⁹ M−1 s−1
| (11) |
| | |
Cl2˙− → ˙Cl + Cl−, k = 1.1 × 10⁵ s−1
| (12) |
| | |
˙OH + Cl− → ClOH˙−, k = 4.3 × 10⁹ M−1 s−1
| (13) |
| | |
ClOH˙− → ˙OH + Cl−, k = 6.1 × 10⁹ s−1
| (14) |
| | |
ClOH˙− → ˙Cl + OH−, k = 23 s−1
| (15) |
As for HCO3−, the degradation rate of NPX decreased by 29.6% during the UV/chlorine process and remained almost constant during direct chlorination. Once HCO3− was added to the solution, it would proceed to react, and the carbonate system would eventually reach equilibration. As the pKa values of H2CO3 are 6.35 and 10.33, at neutral pH, the primary compositions at equilibrium were 4.083 mM HCO3−/0.002 mM CO32− with a 5 mM initial concentration of HCO3−. Both HCO3− and CO32− compete with NPX for ˙OH and ˙Cl due to their high rate constants with ˙OH and ˙Cl, which reduces the degradation rate of NPX (eqn (16)–(18)).12,31
| | |
˙OH + HCO3− → H2O + CO3˙−, k = 8.5 × 10⁶ M−1 s−1
| (16) |
| | |
˙OH + CO32− → CO3˙− + OH−, k = 3.9 × 10⁸ M−1 s−1
| (17) |
| | |
˙Cl + HCO3− → H2O + CO3˙−, k = 2.2 × 10⁸ M−1 s−1
| (18) |
In the presence of 5 mg L−1 HA, the degradation rate of NPX decreased by 50.9% and 61.5% in the direct chlorination and UV/chlorine processes, respectively. Initially, HA competes with NPX for oxidants and ˙OH and ˙Cl. The reported rate constants between NOM and ˙OH and ˙Cl were 2.5 × 10⁴ (mg L−1) s−1 and 1.3 × 10⁴ (mg L−1) s−1, respectively.12,32 Furthermore, NOM can act as a UV inner filter, which reduces the rate at which chlorine photolysis produces ˙OH and ˙Cl.12 Finally, HA can also consume chlorine directly.
3.5. Degradation of NPX in natural water
The potential of the UV/chlorine process and direct chlorination in removing NPX was examined using natural water samples. The samples were collected from one waterworks in Yixin City, Jiangsu Province. As shown in Table 1, the performance of NPX degradation by direct chlorination and the UV/chlorine process was significantly inhibited when using natural water due to the strong scavenging effects of anions and/or NOM, as discussed earlier. In addition, the UV/chlorine process seems to be more efficient and tolerant than direct chlorination for removing NPX from natural water. UV/chlorine was also more suitable for the removal of NPX in natural water. EEO (kW h m−3 per order) was adopted to calculate the energy consumption by the UV/chlorine process (eqn (19)).33| |
 | (19) |
where P is the total electrical power, kW; t is the irradiation time, min; and V is the volume of the treated solution, L. The calculated EEO, which denotes the electricity cost, in ultrapure water, raw water and finished water was 213.20, 1370.57 and 654.14 kW h m−3, respectively.
Table 1 The water quality parameters and degradation rate constants of different samplesa,b
| |
pH |
Cl− mg L−1 |
HCO3− mg L−1 |
DOC mg L−1 |
k (min−1) |
| UV/chlorine |
Chlorination |
| [NPX]0 = 25 μM, [chlorine]0 = 250 μM, reaction time = 30 min. All the water samples are filtered through 0.45 μm hydrophilic polyethersulfone membrane. |
| Pure water |
7 |
0 |
0 |
≤0.02 |
0.135 |
0.053 |
| Raw water |
7.53 |
6 |
143 |
6.189 |
0.021 |
0.007 |
| Finished water |
7.66 |
10 |
137 |
4.311 |
0.044 |
0.012 |
3.6. Intermediate product analysis and degradation pathway
The UV-vis absorption spectra of the reaction mixtures as a function of time are shown in Fig. 5. NPX has a main absorption band centred at 230 nm, a second band centred around 270 nm, and a third band of lower intensity around 320 nm. It is obviously that the main absorption band of NPX decreased in intensity as the reaction proceeds, indicating the NPX disappeared quickly during UV/chlorine process, and the change of the absorbance in the 230–270 nm region cannot be described with a simple exponential curve, suggesting the formation of the intermediates.
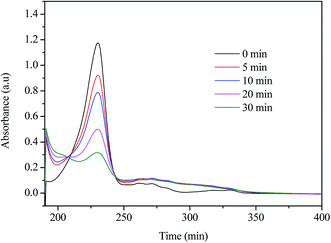 |
| | Fig. 5 The UV-vis spectra of the NPX degradation in UV/chlorine process. Conditions: [NPX]0 = 25 μM, [chlorine]0 = 250 μM, pH = 7. | |
Besides NPX, eight intermediate products at detectable levels were identified by LC/MS/MS analysis. Their tentative structures, chromatograms and mass spectra are provided in Table S1, Fig. S3 and S4.† The intermediate products of NPX were denoted as P246, P186, P184, P200, P204, P264, P299 and P134.
P246 corresponds to the hydroxylated products of NPX, which was attributable to ˙OH attack. In addition, P246 has structural isomers with different retention times. However, the MS data information cannot distinguish the exact position of hydroxylation. According to Dulova et al., the methyl and methoxyl groups on the naphthalene ring are two sites of the attack by ˙OH, and these two hydroxylated species can be further oxidized or demethylated to form P184 (2-methoxy-6-vinylnaphthalene) and 2-(6-hydroxy-2-naphthyl)propanoic acid.34 However, we did not observe 2-(6-hydroxy-2-naphthyl)propanoic acid probably due to its fast transformation rate in our system. P200 is a typical photoinduced product of NPX under UV irradiation.35 P200 is derived from the hydrogen abstraction of 1-(6-methoxy-2-naphthyl)ethanol, another photoinduced product that was not detected in our study; however, its oxidized precursor P187 was found. It has been demonstrated that decarboxylation is a main step in the degradation of NPX, and P187 corresponds to the decarboxylated product of NPX.36 Of note, P184 can also be formed by eliminating H2O molecule from 1-(6-methoxy-2-naphthyl)ethanol.37 ˙Cl is responsible for mono- and di-chloro NPX, corresponding to P264 and P299, respectively. In addition, two Cl-containing products can also be formed after electrophilic attack by chlorine on the naphthalene ring of NPX.38 P264 can then undergo decarboxylation, demethylation and hydrogen abstraction to yield P204, and P205 may also be derived directly from chlorine substitution in P184. In addition, P135 is attributed to a carboxylic acid, as the ultimate step in NPX mineralization.36 To conclude, these products in the UV/chlorine system reveal four main mechanisms, that is, hydroxylation, chlorine substitution of naphthalene, decarboxylation and demethylation. Based on the above discussion, the postulated degradation pathways of NPX during the UV/chlorine process are summarized in Fig. 6.
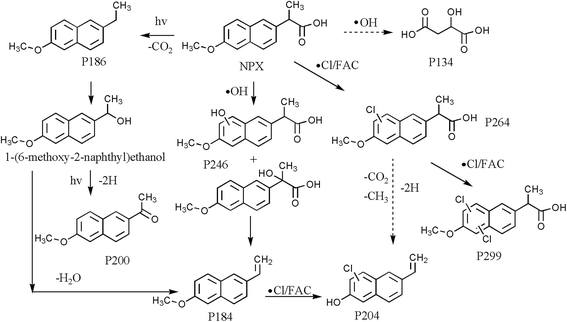 |
| | Fig. 6 Possible degradation pathways of NPX in UV/chlorine system. | |
3.7. Comparison of known DBPs formation during UV/chlorine and chlorination treatment
Fig. 7 displayed the formation of chlorinated DBPs during the degradation of NPX by UV/chlorine and direct chlorination processes. Four kinds of chlorinated DBPs, namely trichloromethane (TCM), chloral hydrate (CH), dichloropropanone (DCP) and trichloropropanone (TCP), were detected. As seen, the concentration of TCM and CH increased or kept stable (DCP and TCP) as treatment was extended. Obviously, the formation of TCM, CH, and TCP was enhanced in the UV/chlorine process compared to direct chlorination. Only 8.3% mineralization was achieved for the UV/chlorine process under the tested conditions (date not shown), which indicates that NPX may transform into intermediates that more easily form DBPs after UV/chlorine treatment.39,40 It has been reported that the addition of a hydroxy group on the aromatic structure can increase the reactivity of compounds with chlorine, which results in the formation of DBPs precursors.41 Similar results were also reported by Wu et al., the formation of four tested DBPs in their study, including TCM, CH, dichloroacetonitrile (DCAN) and trichloroacetonitrile (TCNM), were enhanced in the UV/chlorine process compared to chlorination process.16 Therefore, this potential effect should be carefully considered in the practical use of the UV/chlorine process.
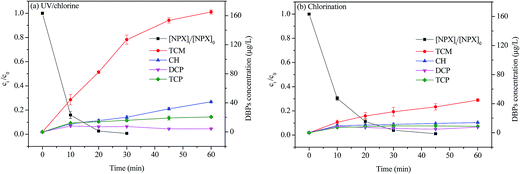 |
| | Fig. 7 The DBPs formation during NPX degradation by (a) UV/chlorine and (b) direct chlorination processes. Conditions: [NPX]0 = 50 μM, [chlorine]0 = 500 μM, pH = 7. | |
4. Conclusion
This study investigated the degradation of NPX under different experimental conditions by a UV/chlorine AOP. The UV/chlorine process showed synergistic effects on NPX degradation compared to UV alone or direct chlorination. Both chlorination and radical oxidation are responsible for the degradation of NPX in the UV/chlorine process. In a typical UV/chlorine process, the pseudo-first-order rate constant of NPX increased as the initial chlorine dose increased and decreased as the solution pH increased. The presence of Cl− improves NPX degradation, while an inhibitory effect was observed in the presence of HCO3− and NOM. Analysis of the intermediate products by LC/MS/MS revealed that NPX decomposition in the UV/chlorine process was associated with hydroxylation, chlorine substitution of naphthalene, decarboxylation and demethylation. The UV/chlorine process has a risk of enhancing the formation of chlorinated DBPs compared to direct chlorination. This study demonstrates that the UV/chlorine process is a promising technology for removing NPX from contaminated water.
Acknowledgements
This work was supported by the Foundation of Key Laboratory of Yangtze River Water Environment, Ministry of Education, Tongji University, China (YRWEF201601) and the National Major Project of Science & Technology Ministry of China (No. 2012ZX07403-001). We also thankful to the reviewers and editors for their valuable advice to improve this manuscript.
References
- Q. W. Bu, B. Wang, J. Huang, S. B. Deng and G. Yu, J. Hazard. Mater., 2013, 262, 189–211 CrossRef CAS PubMed.
- D. Q. Zhang, R. M. Gersberg, W. J. Ng and S. K. Tan, Environ. Pollut., 2014, 184, 620–639 CrossRef CAS PubMed.
- B. Kasprzyk-Hordern, R. M. Dinsdale and A. J. Guwy, Water Res., 2009, 43, 363–380 CrossRef CAS PubMed.
- A. B. Caracciolo, E. Topp and P. Grenni, J. Pharm. Biomed. Anal., 2015, 106, 25–36 CrossRef PubMed.
- K. Fent, A. A. Weston and D. Caminada, Aquat. Toxicol., 2006, 76, 122–159 CrossRef CAS PubMed.
- J. T. Yu, E. J. Bouwer and M. Coelhan, Agr. Water Manag., 2006, 86, 72–80 CrossRef.
- T. A. Ternes, Water Res., 1998, 32, 3245–3260 CrossRef CAS.
- D. J. Lapworth, N. Baran, M. E. Stuart and R. S. Ward, Environ. Pollut., 2012, 163, 287–303 CrossRef CAS PubMed.
- F. Gagné, C. Blaise, M. Fournier and P. D. Hansen, Comp. Biochem. Physiol., Part C: Toxicol. Pharmacol., 2006, 143, 179–186 CrossRef PubMed.
- M. Carballa, F. Omil, J. M. Lema, M. Llompart, C. García-Jares, I. Rodríguez, M. Gómez and T. Ternes, Water Res., 2004, 38, 2918–2926 CrossRef CAS PubMed.
- I. Sirés, E. Brillas, M. A. Qturan, M. A. Rodrigo and M. Panizza, Environ. Sci. Pollut. Res., 2014, 21, 8336–8367 CrossRef PubMed.
- J. Y. Fang, Y. Fu and C. Shang, Environ. Sci. Technol., 2014, 48, 1859–1868 CrossRef CAS PubMed.
- M. J. Watts and K. G. Linden, Water Res., 2007, 41, 2871–2878 CrossRef CAS PubMed.
- X. J. Kong, J. Jiang, J. Ma, Y. Yang, W. L. Liu and Y. L. Liu, Water Res., 2016, 90, 15–23 CrossRef CAS PubMed.
- W. L. Wang, Q. Y. Wu, N. Huang, T. Wang and H. Y. Hu, Water Res., 2016, 98, 190–198 CrossRef CAS PubMed.
- Z. H. Wu, J. Y. Fang, Y. Y. Xiang, C. Shang, X. C. Li, F. G. Meng and X. Yang, Water Res., 2016, 104, 272–282 CrossRef CAS PubMed.
- Y. Feng, D. W. Smith and J. R. Bolton, J. Environ. Eng. Sci., 2007, 6, 277–284 CrossRef CAS.
- Z. B. Guo, Y. L. Lin, B. Xu, H. Huang, T. Y. Zhang, F. X. Tian and N. Y. Gao, Chem. Eng. J., 2016, 283, 412–419 CrossRef CAS.
- W. H. Chu, T. F. Chu, E. D. Du, Y. Deng, Y. Q. Guo and N. Y. Gao, Ecotoxicol. Environ. Saf., 2016, 124, 147–154 CrossRef CAS PubMed.
- S. Canonica, L. Meunier and U. von Gunten, Water Res., 2008, 42, 121–128 CrossRef CAS PubMed.
- W. H. Chu, N. Y. Gao, S. W. Krasner, M. R. Templeton and D. Q. Yin, Environ. Pollut., 2012, 161, 8–14 CrossRef CAS PubMed.
- V. J. Pereira, H. S. Weinberg, K. G. Linden and P. C. Singer, Environ. Sci. Technol., 2007, 41, 1682–1688 CrossRef CAS PubMed.
- G. R. Boyd, S. Y. Zhang and D. A. Grimm, Water Res., 2005, 39, 668–676 CrossRef CAS PubMed.
- G. V. Buxton, C. L. Helman, W. P. Helman and A. B. Ross, J. Phys. Chem. Ref. Data, 1998, 17, 513–886 CrossRef.
- R. Mertens and C. von Sonntag, J. Photochem. Photobiol., A, 1995, 85, 1–9 CrossRef CAS.
- P. Wang, Y. L. He and C. H. Huang, Water Res., 2011, 45, 1838–1846 CrossRef CAS PubMed.
- M. Q. Cai, L. Q. Zhang, F. Qi and L. Feng, J. Environ. Sci., 2013, 25, 77–84 CrossRef CAS.
- R. A. Trenholm, B. J. Vanderford, J. C. Holady, D. J. Rexing and S. A. Snyder, Chemosphere, 2006, 65, 1990–1998 CrossRef CAS PubMed.
- D. Wang, J. R. Bolton and R. Hofmann, Water Res., 2012, 46, 4677–4686 CrossRef CAS PubMed.
- L. M. Rebenne, A. C. Gonzalez and T. M. Olson, Environ. Sci. Technol., 1996, 30, 2235–2242 CrossRef CAS.
- G. V. Buxton and A. J. Elliot, Radiat. Phys. Chem., 1986, 27, 241–243 CrossRef CAS.
- C. Lee, J. Yoon and U. von Gunten, Water Res., 2007, 41, 581–590 CrossRef CAS PubMed.
- J. R. Bolton, K. G. Bircher, W. Tumas and C. A. Tolman, Pure Appl. Chem., 2001, 73, 627–637 CrossRef CAS.
- N. Dulova, E. Kattel and M. Trapido, Chem. Eng. J., 2017, 318, 254–263 CrossRef CAS.
- R. Marotta, D. Spasiano, I. Di Somma and R. Andreozzi, Water Res., 2013, 47, 373–383 CrossRef CAS PubMed.
- D. Kanakaraju, C. A. Motti, B. D. Glass and M. Oelgemöller, Chemosphere, 2015, 139, 579–588 CrossRef CAS PubMed.
- T. K. Kim, B. R. Moon, T. Kim, M. K. Kim and K. D. Zoh, Chemosphere, 2016, 162, 157–164 CrossRef CAS PubMed.
- J. B. Quintana, R. Rodil, P. López-Mahía, S. Muniategui-Lorenzo and D. Prada-Rodríguez, Water Res., 2010, 44, 243–255 CrossRef CAS PubMed.
- A. D. Dotson, V. O. S. Keen, D. Metz and K. G. Linden, Water Res., 2010, 44, 3703–3713 CrossRef CAS PubMed.
- D. A. Reckhow, K. G. Linden, J. Kim, H. Shemer and G. Makdissy, J. Am. Water Works Assoc., 2010, 102, 100–113 CAS.
- G. Kleiser and F. Frimmel, Sci. Total Environ., 2000, 256, 1–9 CrossRef CAS PubMed.
Footnote |
| † Electronic supplementary information (ESI) available. See DOI: 10.1039/c7ra04540a |
|
| This journal is © The Royal Society of Chemistry 2017 |
Click here to see how this site uses Cookies. View our privacy policy here.  Open Access Article
 *a,
Nai-yun Gaob,
Wen-hai Chub,
Qin-lin Yanga and
Da-qiang Yinb


![[thin space (1/6-em)]](https://www.rsc.org/images/entities/char_2009.gif) :
:![[thin space (1/6-em)]](https://www.rsc.org/images/entities/char_2009.gif) 1, 10
1, 10![[thin space (1/6-em)]](https://www.rsc.org/images/entities/char_2009.gif) :
:![[thin space (1/6-em)]](https://www.rsc.org/images/entities/char_2009.gif) 1, and 15
1, and 15![[thin space (1/6-em)]](https://www.rsc.org/images/entities/char_2009.gif) :
:![[thin space (1/6-em)]](https://www.rsc.org/images/entities/char_2009.gif) 1, pH = 7.
1, pH = 7.


