
 Open Access Article
 This Open Access Article is licensed under a
 Creative Commons Attribution 3.0 Unported Licence
Exploring the diethylaminoflavylium derivatives multistate system of chemical reactions in the presence of CTAB micelles: thermodynamic reversibility achieved through different kinetic pathways†
Márcia Pessêgoa,
Nuno Basílio *a,
Johan Mendozaa,
João Avóa,
Luís Cunha-Silvab,
A. Jorge Parolaa and
Fernando Pina*a
*a,
Johan Mendozaa,
João Avóa,
Luís Cunha-Silvab,
A. Jorge Parolaa and
Fernando Pina*a
aLAQV-REQUIMTE, Departamento de Química, Faculdade de Ciências e Tecnologia, Universidade NOVA de Lisboa, 2829-516 Caparica, Portugal. E-mail: fp@fct.unl.pt; nuno.basilio@fct.unl.pt
bLAQV-REQUIMTE, Departamento de Química e Bioquímica, Faculdade de Ciências, Universidade do Porto, 4169-007 Porto, Portugal
First published on 15th June 2017
Abstract
Aminoflavylium compounds like anthocyanins are involved in multiple reversible, pH-dependent chemical reactions. In very acidic media, the thermodynamically stable species is the flavylium cation, while it is trans-chalcone in near-neutral media. Different from anthocyanins, aminoflavylium compounds achieve the thermodynamic reversibility through different kinetic pathways depending on if the flavylium is transformed into the trans-chalcone upon a direct pH jump or the protonated trans-chalcone if converted into flavylium upon a reverse pH-jump. Three aminoflavylium compounds were prepared and investigated in the presence of CTAB micelles. Two of the compounds bear bridges linking rings C and B of the flavylium core, and the third lacks this bridge. The bridge has the effect of destabilizing the chalcones and the hemiketal. Only in the presence of CTAB micelles does the system respond to light stimuli, a powerful tool that provides a small cis–trans isomerization barrier for the three compounds. The relatively slow response of the system to direct and reverse pH jumps is due to the small mole fractions of Cc available for isomerization (giving Ct) and B available for dehydration (giving AH+). The mathematical expression that accounts for the pH-dependent kinetic processes was revisited to account for the consequences of amine protonation in very acidic media. The crystal structures of the compounds possessing the bridge were obtained, and for one of the compounds, two polymorphic forms were isolated from different crystallization solutions.
Introduction
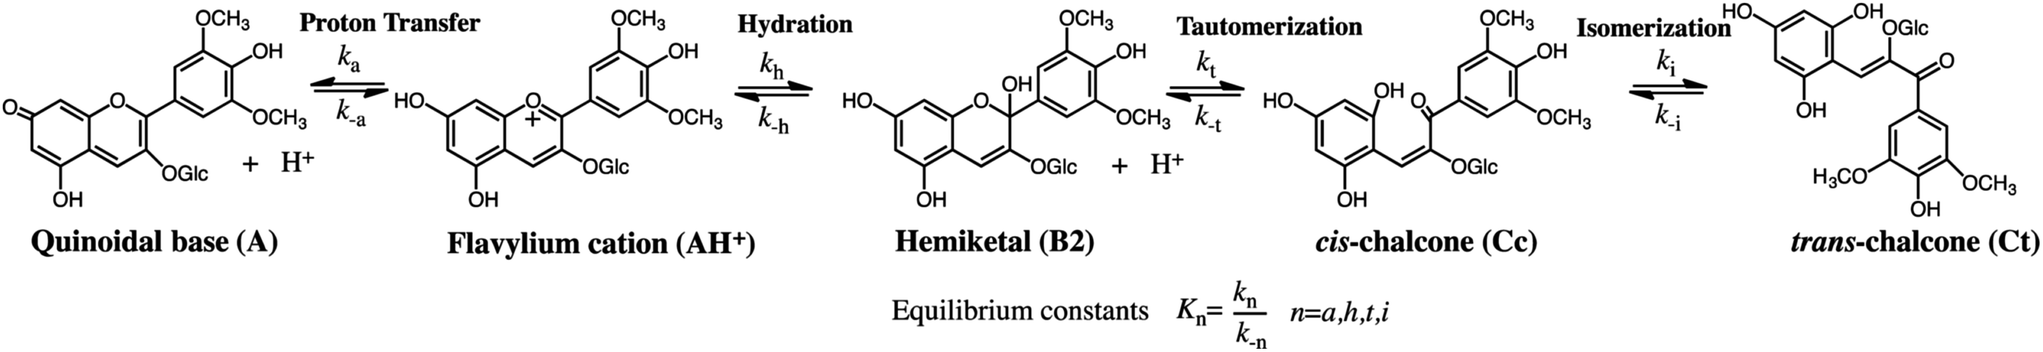
Photochromic molecular systems (i.e., molecules that undergo reversible transformation upon light absorption between two forms with different absorption spectra) are of pivotal importance for the design and realization of photoresponsive dynamic materials, molecular machines, photoswitchable drugs and drug-delivery systems, optical memories, and so forth.1–10 However, most reported systems are based on simple, bistable photochromic molecules. Multistate molecules are required for more complex multiaddressable/multiresponsive highly functional materials. Such molecules have been achieved through the design and synthesis of multiphotochromes, which usually require multistep synthetic efforts.11 Flavylium compounds are intrinsically multistate molecules that include both natural and synthetic compounds and can be obtained through simple synthetic procedures, thereby providing alternatives to more complex multistate systems.12At high pH, the flavylium cation (generally stable only in very acidic conditions) generates multiple different chemical species. The prototype of the flavylium cation-based multistate system is the anthocyanin family.13 In addition to anthocyanins and other compounds of natural origin, synthetic flavylium compounds also present the same series of chemical reactions, as exemplified by malvidin-3-glucoside (oenin) in Scheme 1.12,14–16
 | ||
| Scheme 1 Example of the typical series of reactions in flavylium compounds: malvidin-3-glucoside (oenin). | ||
The multiple states in acidic media are characterized by five species reversibly interconnected by four chemical reactions: eqn (1) to (4). After a direct pH jump initiated by the addition of base to an equilibrated solution of flavylium cation, quinoidal base is formed [eqn (1)].17 This reaction is by far the fastest of the reactions and takes place during the mixing time of the stopped flow apparatus:
| AH+ + H2O ⇌ A + H3O+ Ka, proton transfer | (1) |
A slower process competing with eqn (1) is the pH-dependent hydration reaction that gives hemiketal B [eqn (2)]:
| AH+ + 2H2O ⇌ B + H3O+ Kh, hydration | (2) |
The hydration is followed by tautomerization (ring opening/closure), which is faster than hydration unless the pH is very low [eqn (3)]:
| B ⇌ Cc Kt, tautomerization | (3) |
A and AH+ are in very fast equilibrium during the subsequent kinetic steps. One important feature of the flavylium multistate system is that the quinoidal base does not react in moderately acidic media. Thus, the system evolves towards other species through the direct hydration of flavylium cation.14,15 Finally, equilibrium is attained upon the formation of trans-chalcone from the isomerization of cis-chalcone, a process that can be very slow or take place in sub-seconds [eqn (4)]:
| Cc ⇌ Ct Ki, isomerization | (4) |
Despite the complexity of the multiple equilibria, the flavylium multistate system can be simplified considering a single acid-base reaction involving the species AH+ and its conjugate base CB defined as the sum of the other species A, B, Cc and Ct [eqn (5)]:
| AH+ + H2O ⇌ CB + H3O+ K′a = Ka + Kh + KhKt + KhKtKi | (5) |
The multistate system is studied by placing the system out of equilibrium by means of external stimuli and following the respective relaxation processes. The most common external stimuli are the previously mentioned direct pH jumps, reverse pH jumps when acid is added to the equilibrated solutions with basic pH, and light (flash photolysis). The kinetic behavior of the system depends on the existence or absence of a cis–trans isomerization barrier.18
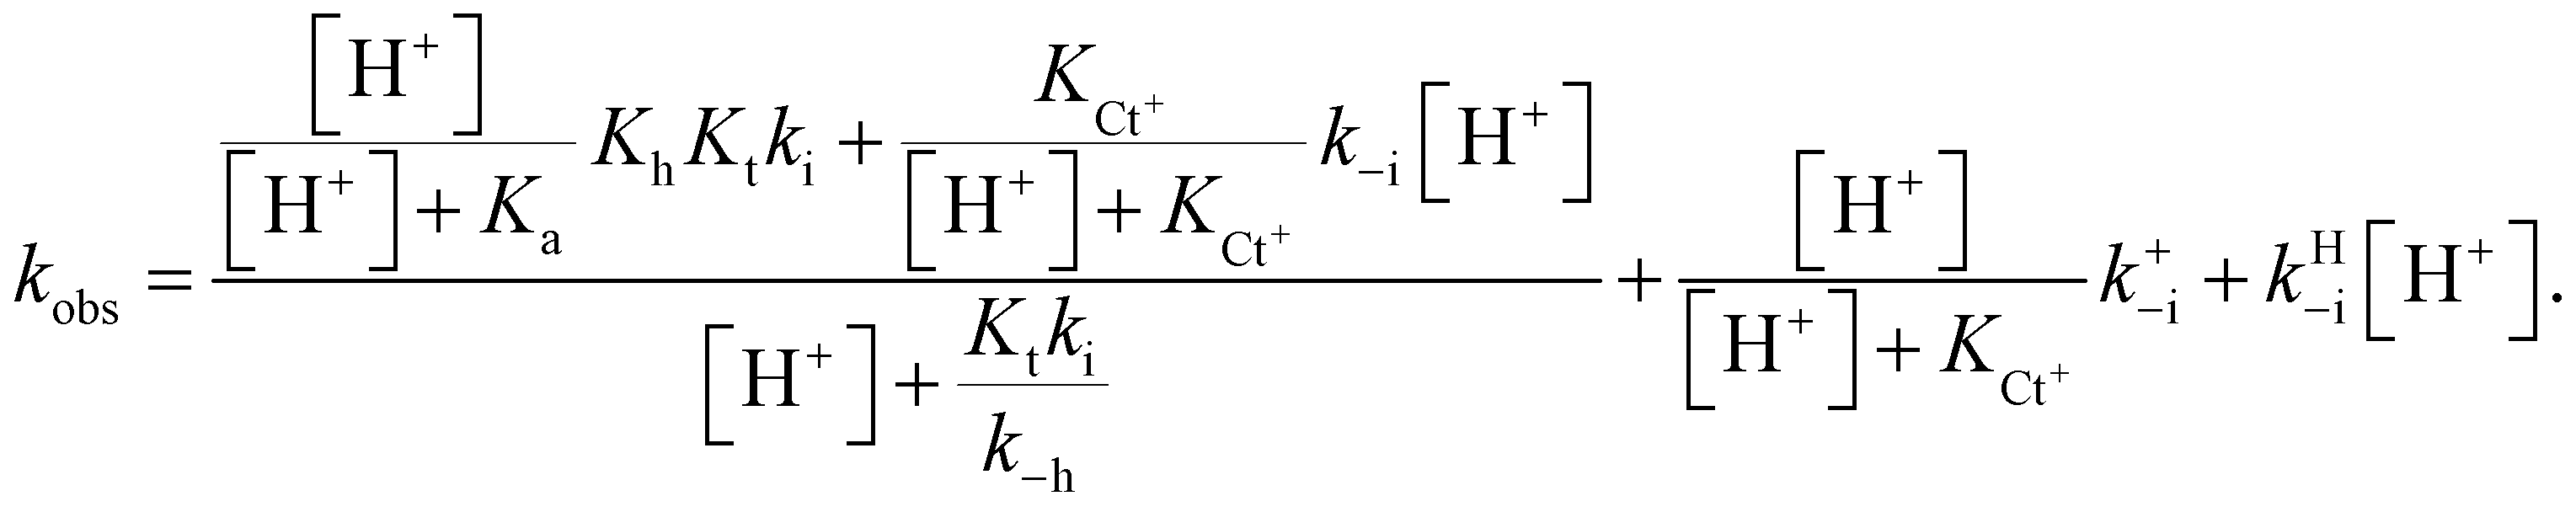
The compounds reported in this work do not exhibit cis–trans isomerization barriers, as discussed below. The pH-dependent rate constants of these systems upon direct and reverse pH jumps follow bell-shaped curves according to eqn (6); this equation is simplified for the compound lacking the quinoidal base in eqn (7):19
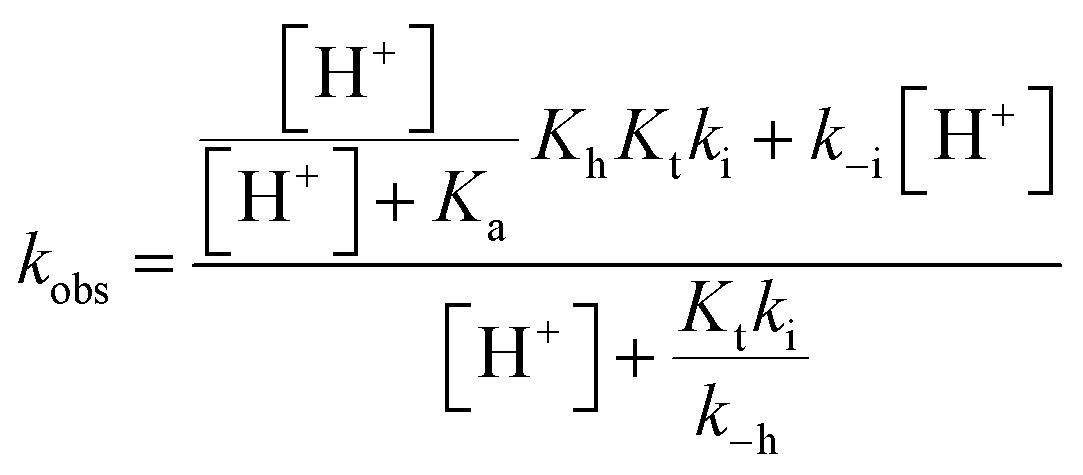 | (6) |
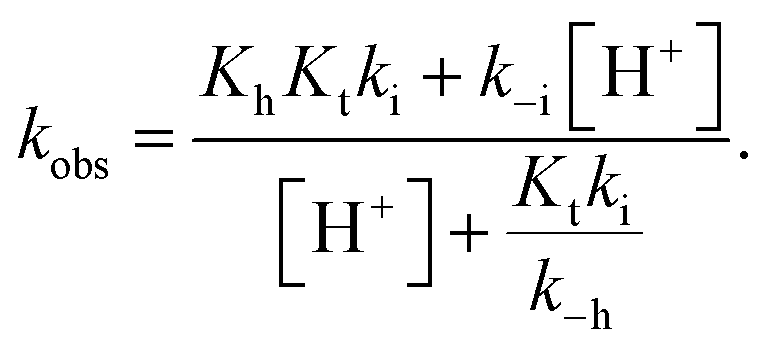 | (7) |
Both equations presuppose that proton transfer and tautomerization are sufficiently fast so that the equilibrium between AH+ and A on one side and B and Cc on the other side is reached during the overall kinetic process:18
| AH+/A ⇌ B/Cc ⇌ Ct. | (8) |
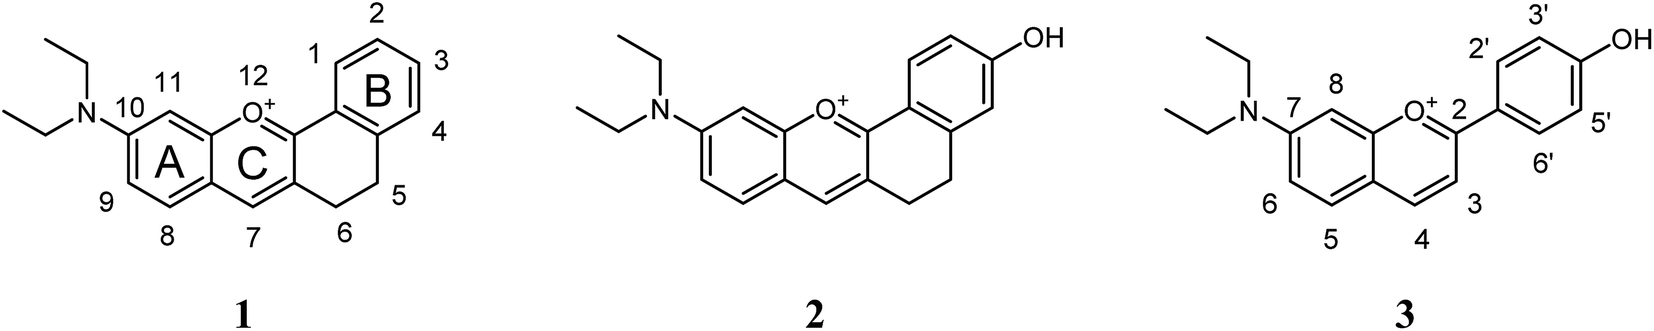
In this work, two diethylaminoflavylium derivatives possessing structural restrictions due to the introduction of an ethylenic bridge between carbon 3 and carbon 2′ of the flavylium structure were prepared together with 7-diethylamino-4′-hydroxyflavylium for comparison (Scheme 2).
 | ||
| Scheme 2 Compounds studied in this work. | ||
A previous work reported that flavylium derivatives containing amino substituents exhibit interesting properties such as intense color and an extended pH range for stability.20 However, aminoflavylium compounds do not exhibit photochromism in water. This drawback can be overcome in the presence of CTAB micelles.21,22 In the present series of compounds, we investigated the effect of the constraining bridge that confers some rigidity to the chemical structure, preventing the rotation of ring B. Light inputs were used to access the thermodynamic and kinetic behaviors of the different states. A deeper mathematical and kinetic analysis of the bell-shaped curve is also reported for the first time.
Experimental
Synthesis
All solvents and chemicals employed for synthesis and for the preparation of samples were of reagent or spectrophotometric grade and were used as received. Compound 3 was available from previous studies.23 Millipore-grade water was used. NMR spectra were collected using a Bruker AMX 400 instrument operating at 400.13 MHz (1H) and 100.00 MHz (13C). Elemental analyses were performed using a Thermofinnigan Flash EA 112 series instrument.![[thin space (1/6-em)]](https://www.rsc.org/images/entities/char_2009.gif) :1 mL) was stirred overnight at room temperature. Ethyl acetate was added to the red solution, and a precipitate was formed. This dark-yellow solid was filtered, washed several times with diethyl ether, and dried under vacuum. Yield: 0.5 g, 61%. 1H-NMR (CD3OD + DCl, 400.13 MHz, 298 K) δ (ppm): 8.38 (1H, s), 8.10 (1H, d, J = 8.7 Hz), 7.78 (1H, d, J = 9.3 Hz), 7.28 (1H, d, J = 9.5 Hz), 7.10 (1H, d, J = 2.3 Hz), 6.85 (1H, dd, J = 8.7; 2.4 Hz), 6.76 (1H, d, J = 2.3 Hz), 3.63 (4H, q, J = 7.1 Hz), 3.06–2.90 (4H, m), 1.24 (6H, t, J = 7.1 Hz); ESI-MS: 320.16296 (M+), calcd for C21H22NO2+ 320.16451; elemental analysis (%) calcd for C21H22NO2·HSO4·H2O·H2SO4: C 47.27, H 5.10, S 12.02, N 2.63; found: C 48.83, H 4.97, S 11.48, N 2.67.
:1 mL) was stirred overnight at room temperature. Ethyl acetate was added to the red solution, and a precipitate was formed. This dark-yellow solid was filtered, washed several times with diethyl ether, and dried under vacuum. Yield: 0.5 g, 61%. 1H-NMR (CD3OD + DCl, 400.13 MHz, 298 K) δ (ppm): 8.38 (1H, s), 8.10 (1H, d, J = 8.7 Hz), 7.78 (1H, d, J = 9.3 Hz), 7.28 (1H, d, J = 9.5 Hz), 7.10 (1H, d, J = 2.3 Hz), 6.85 (1H, dd, J = 8.7; 2.4 Hz), 6.76 (1H, d, J = 2.3 Hz), 3.63 (4H, q, J = 7.1 Hz), 3.06–2.90 (4H, m), 1.24 (6H, t, J = 7.1 Hz); ESI-MS: 320.16296 (M+), calcd for C21H22NO2+ 320.16451; elemental analysis (%) calcd for C21H22NO2·HSO4·H2O·H2SO4: C 47.27, H 5.10, S 12.02, N 2.63; found: C 48.83, H 4.97, S 11.48, N 2.67.Measurements
Any pH adjustment was achieved by the addition of HCl, NaOH or Theorell and Stenhagen's universal buffer. The pH was recorded on a pH meter (Basic 20+, Crison). Direct pH jumps were carried out by mixing a specific amount of stock dye solution (previously dissolved in HCl 0.1 M) with an equal volume of a solution containing buffer, enough NaOH to neutralize the initial HCl, and CTAB (0.020 M). UV-Vis spectra were recorded on a Varian-Cary 100 Bio or 5000 spectrophotometer (Palo Alto, CA, USA). Stopped-flow experiments were conducted on a SX20 (Applied Photophysics; Surrey, UK) spectrometer equipped with a PDA.1/UV photodiode array detector. Irradiation was carried out at 365 nm. Quantum yields were measured based on the total absorbed light. Flash photolysis experiments were performed on a Varian Cary 5000 spectrophotometer with a Harrick fiber-mate (Pleasantville, NY, USA) coupled to an Ocean Optics four-way cuvette holder (Dunedin, FL, USA). The compartment was isolated from daylight, and a commercially available Achiever 630AF camera flash (Hong Kong, China) was used as a pulsed white light source (placed in close contact with the quartz cuvette).Single-crystal X-ray diffraction
Suitable single crystals of compounds 1·BF4 and 2·HSO4 were selected and mounted on the respective cryoloops using adequate inert oil.24 Diffraction data were collected on a Bruker X8 Kappa APEX II charge-coupled device area-detector diffractometer controlled by the APEX2 software package25 (Mo Kα graphite-monochromated radiation, λ = 0.71073 Å). The diffractometer was equipped with an Oxford Cryosystems Series 700 cryostream and monitored remotely with the software interface Cryopad.26 Images were processed with the software SAINT+,27 and the absorption effects were corrected using the multi-scan method implemented in SADABS.28 The structures were solved using SHELXT-2014,29–31 which provided the immediate location and identification of a considerable number of the heaviest atoms composing the asymmetric unit. The remaining absent and misplaced non-hydrogen atoms were located using difference Fourier maps from successive full-matrix least-squares refinement cycles on F2 using SHELXL-v.2014.29,31 All the non-hydrogen atoms were successfully refined using anisotropic displacement parameters.Hydrogen atoms bonded to the carbon atoms of the organic molecules were placed at their idealized positions using the appropriate HFIX instructions in SHELXL (137 for the terminal –CH3, 23 for the –CH2– and 43 for the aromatic groups) and included in subsequent refinement cycles in riding-motion approximation with isotropic thermal displacements parameters (Uiso) fixed at 1.2 or 1.5 × Ueq of the relative atom. Furthermore, the hydrogen atoms associated to hydroxyl groups were markedly visible in the difference Fourier maps, and included in subsequent refinement stages with the O–H distances restrained to 0.90(2), and using a riding-motion approximation with an isotropic thermal displacement parameter fixed at 1.5 × Ueq of the parent oxygen atom.
Information regarding the crystallographic data collection and structure refinement is summarized in Table S1 (ESI†), while the geometric details concerning the hydrogen bonding interactions are collected in Table S2 (ESI†). Additional crystallographic details can be found in the corresponding CIF files provided in the ESI.†
Results and discussion
X-ray structures
Compound 1·BF4 was dissolved in MeOH and re-crystallized by the slow diffusion of Et2O, resulting in a brown crystalline material with good quality for single-crystal X-ray diffraction analysis. The crystal structure was determined to be in the monoclinic space group C2/c with the asymmetric unit (asu) comprising a cationic organic molecule and a tetrafluoroborate anion, BF4− (Fig. 1, left side; detailed information about the crystallographic data collection and structure refinement can be found in the Experimental section). On the other hand, two distinct single crystals of 2·HSO4 were obtained by diffusing Et2O into different solutions of the compound: one in MeOH and the other in MeCN. These two crystal structures confirmed the formation of two polymorphs (i.e., the same compound isolated in two distinct crystalline systems) of compound 2·HSO4 (Fig. 1, right side). Crystallization from MeOH solution resulted in a compound with a monoclinic P21/c crystalline structure (2·HSO4_M), while the same procedure from MeCN solution led to an orthorhombic Pna21 phase (2·HSO4_O). In both 2·HSO4_M and 2·HSO4_O, the asu includes a cationic organic molecule and a hydrogen sulfate anion, HSO4−.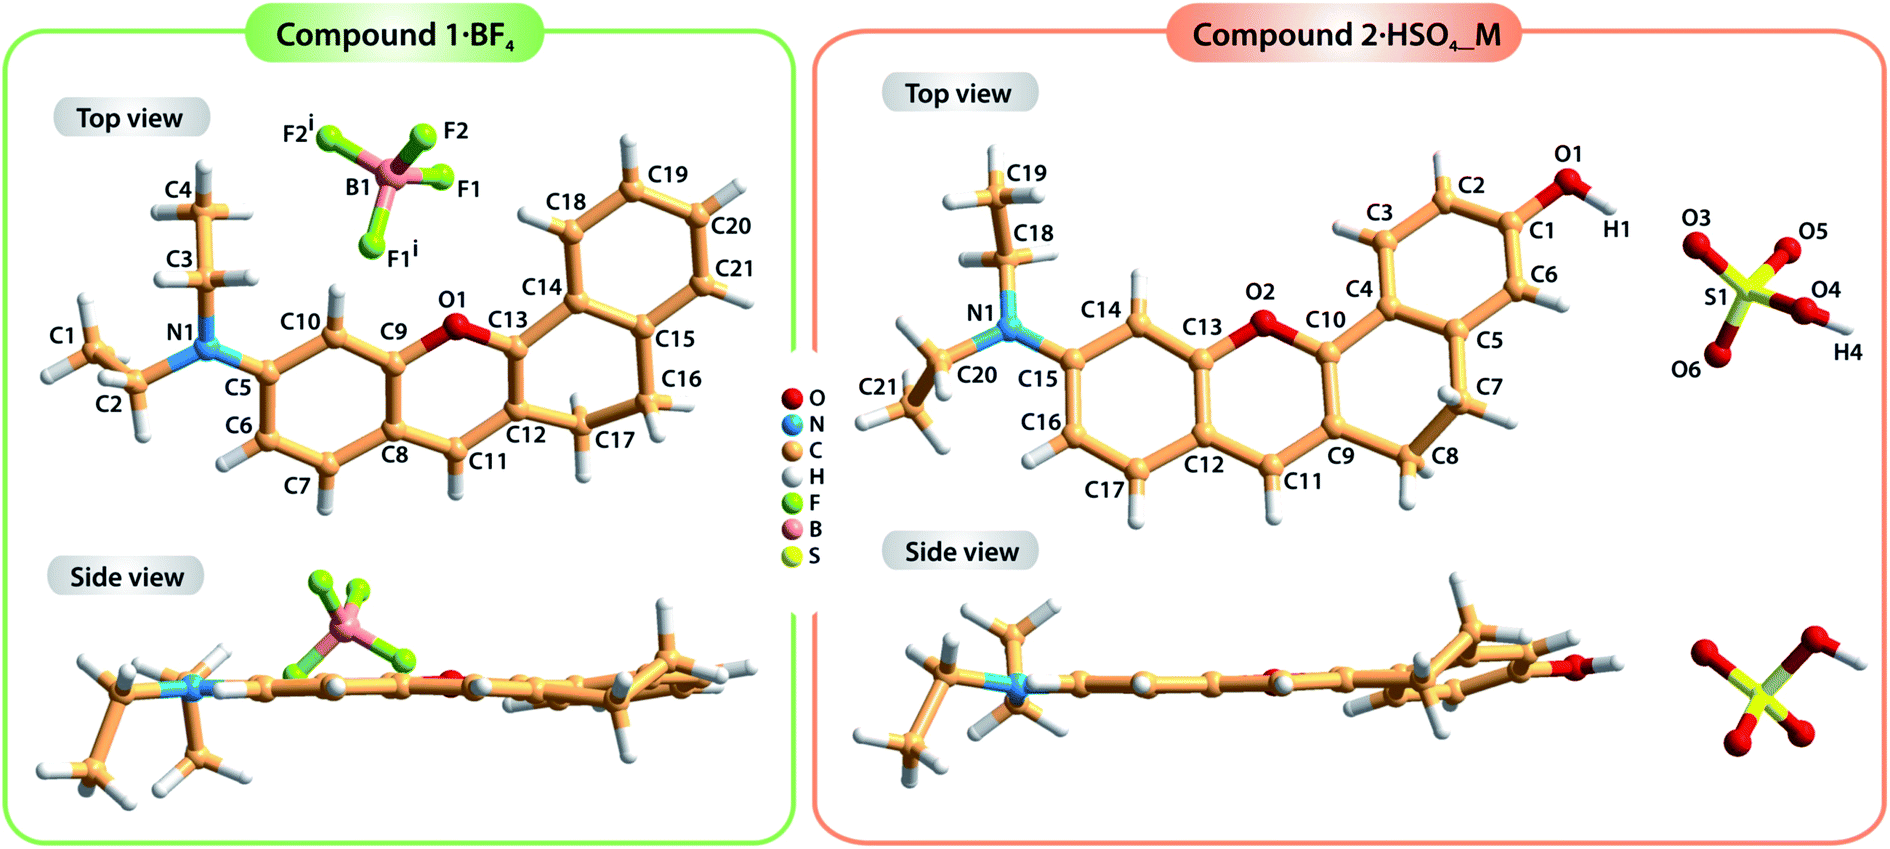 | ||
| Fig. 1 Top and side views of the crystal structures of compounds 1·BF4 (left) and 2·HSO4 (right; drawn from the 2·HSO4_M structure) showing the labeling scheme for all non-hydrogen atoms. Symmetry transformation used to generate equivalent atoms: (i) −x, y, −z + 3/2. | ||
The dihedral angle between the average planes of the benzopyrylium group and the benzene ring is 10.197° in molecule 1, while those of molecule 2 are 17.127° for 2·HSO4_M and 9.646° for 2·HSO4_O. These structural differences in terms of the planarity of the molecules in the solid state are certainly related to the occurrence of distinct intermolecular interactions, particularly hydrogen bonds (see Table S2† for details about the geometric information of these interactions) involving the organic cations and the respective anions along with π⋯π staking between adjacent organic molecules. In fact, in the structure of compound 1·BF4, the crystal packing arrangement is strongly influenced by an extensive network of C–H⋯F weak hydrogen bonds involving the organic moieties and the BF4− anions (green dashed lines in the top part of Fig. 2; and Table S1, ESI†). Furthermore, contiguous organic molecules close-pack along the b-axis of the unit cell through offset π⋯π stacking interactions involving the benzopyrylium groups and the benzene rings with the Cg⋯Cg distance between 3.5884(3) and 3.7860(3) Å (Fig. 2; Cg stands for the gravity center of each aromatic ring).
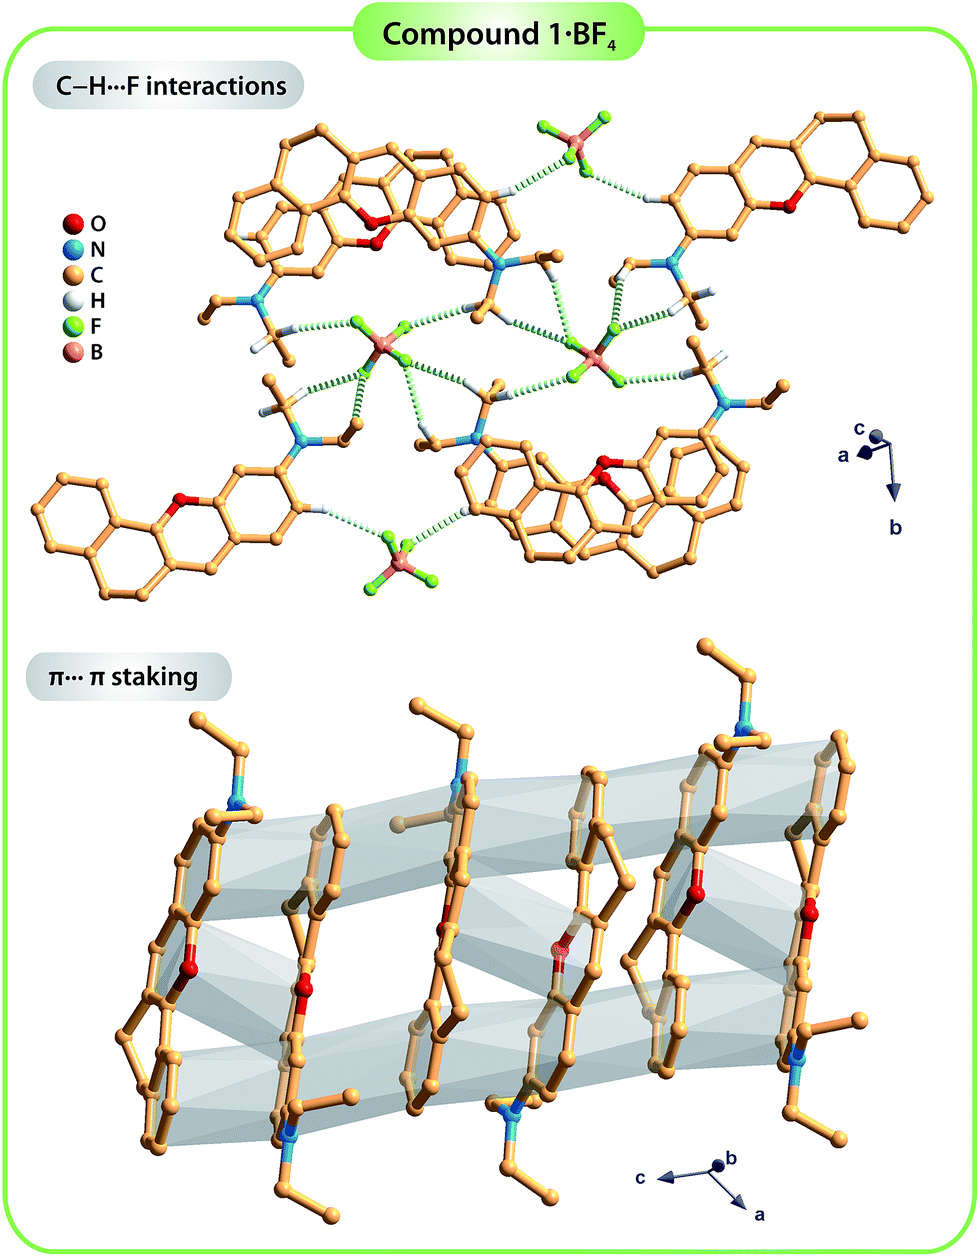 | ||
| Fig. 2 Representation of the C–H⋯F weak hydrogen bonds (yellow dashed lines; top) and the π⋯π stacking interactions (grey shadow; bottom) found in the crystal structure of compound 1·BF4. For clarity, only the hydrogen atoms involved in the C–H⋯F bonds are shown. For detailed information about the hydrogen bonds, see Table S2 in the ESI.† | ||
The occurrence of two polymorphic forms of the compound 2·HSO4 isolated from different crystallization solutions seems to be a consequence of the hydrogen bonding networks that are distinct in the two crystal structures. In particular, the strong O–H⋯O hydrogen bonds involving the organic cations and the hydrogen sulfate anions have different arrangements (blue dashed lines in Fig. 3): in polymorph 2·HSO4_M, the inorganic anions form discrete dimmers and further interact with two additional organic molecules (Fig. 3 top); in 2·HSO4_O, the inorganic cations form one-dimensional chains, each of which establishes an additional O–H⋯O interaction with one organic molecule (Fig. 3, bottom). Furthermore, the extensive network of weak C–H⋯O hydrogen bonds in the two structures (pale yellow dashed lines in Fig. 3) leads to the formation of extended 3D supramolecular structures.
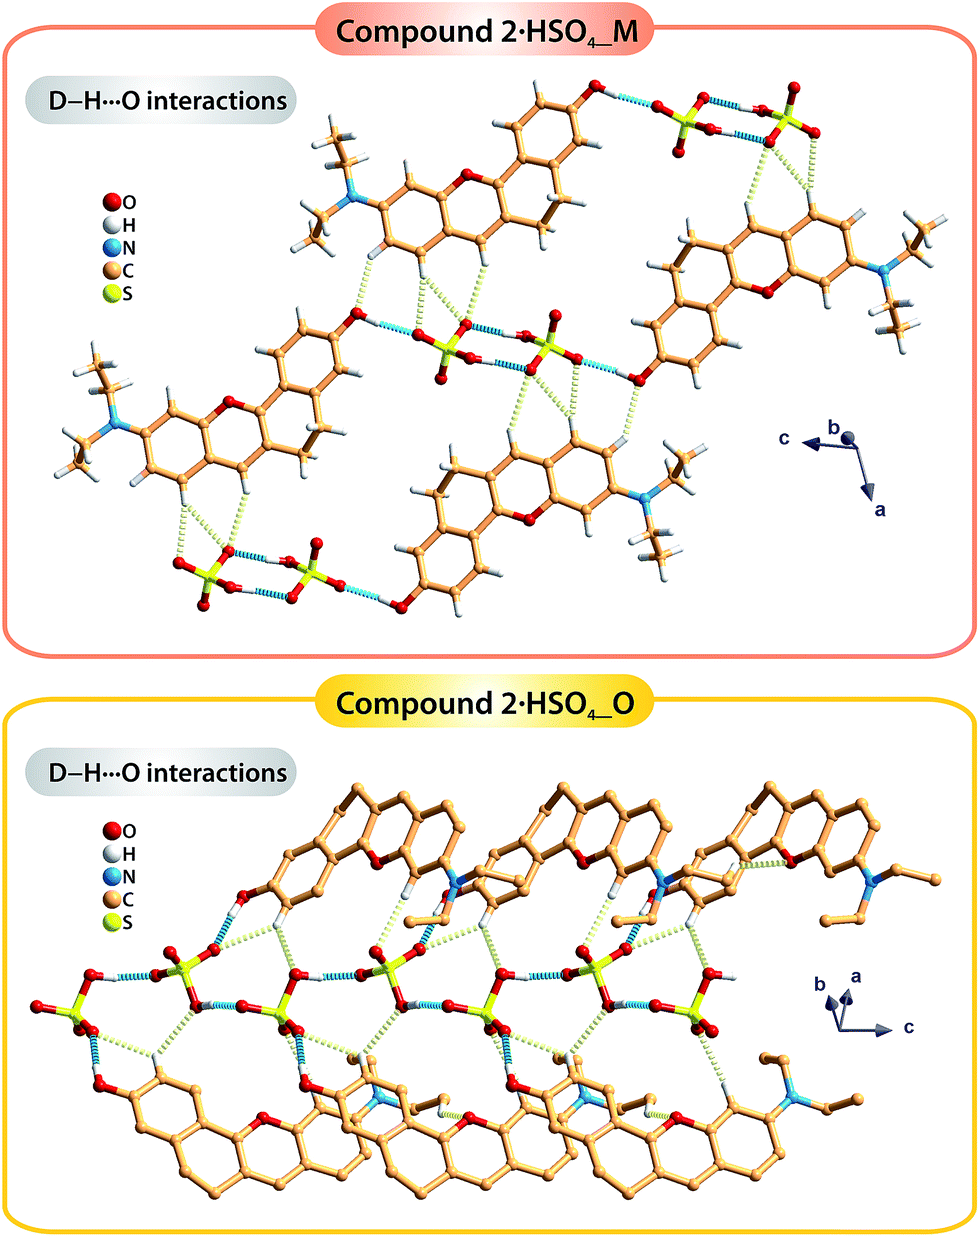 | ||
| Fig. 3 Representation of the strong C–H⋯O and weak C–H⋯O hydrogen bonds, respectively drawn as blue and pale-yellow dashed lines, found in the two polymorphic forms of the compound 2·HSO4: 2·HSO4_M (top) and 2·HSO4_O (bottom). For detailed information about the hydrogen bonds, see Table S2 in the ESI.† | ||
The bell-shaped curve: an overview
The bell-shaped curve that accounts for the kinetics of the multistate system as it approaches equilibrium [eqn (6)] is represented in Fig. 4a (red curve). This process accounts for the interconversion rates between flavylium cation and trans-chalcone (direct pH jumps) and vice versa (reverse pH jumps). Two limiting reactions can be identified in this curve. The hydration limit given by eqn (9), which becomes the controlling step at higher pH, and the isomerization limit [eqn (7)], which is relevant at lower pH, coincide with the mathematical expression observed when there is no quinoidal base, as in compound 1. The pH extremes of the bell-shaped curve are only accessed at lower and higher pH values from direct and reverse pH jumps, respectively.
 | (9) |
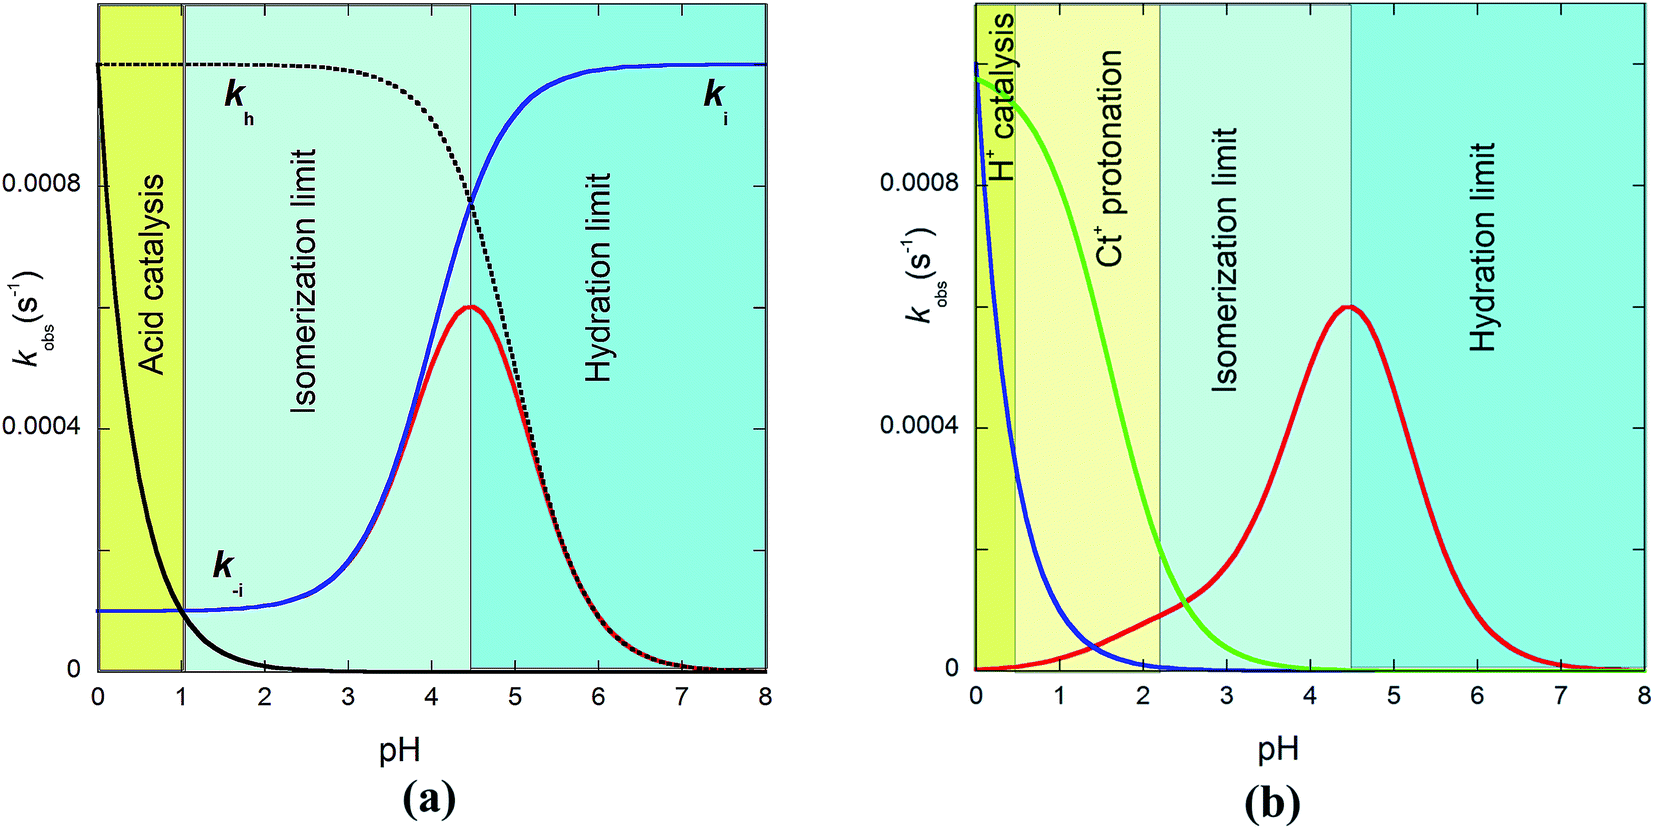 | ||
| Fig. 4 (a) Representation of eqn (6) (red line), eqn (7) (blue line) and eqn (9) (pointed line) as functions of pH. Simulation was carried out for pKa = 5; KhKtki = 10−7 M−1 s−1; k−i = 10−4 s−1; Ktki/k−h = 10−4 (kh = 10−3 s−1); k+−i = 10−3; kH−i = 10−3. (b) In the case of the protonation of the amine substituent, the contribution of the protonated amine should be considered (pKCt+/Ct = 1.6); for the contributions, see eqn (7), (9) and the global eqn (11). | ||
Recently, we observed that at very low pH, the rate of the system increases with decreasing pH, which was interpreted to result from the acid catalysis of cis–trans isomerization.32 This effect has been fitted with the product kH−i[H+]. In the case of multiple flavylium states possessing amine substituents, it was also reported that the protonation of trans-chalcone in reverse pH jumps leads to an identical increase in rate; however, this effect was observed at less acidic pH values when compared to the catalysis (Fig. 4b, green curve).
The bell-shaped curve indicates that in very acidic media, the reverse pH jumps are controlled by the trans-to-cis isomerization with rate constant k−i. The increase in the rate in Fig. 4b caused by the protonation of the amine (green curve) results from the increase in the trans-to-cis rate constant (k+−i) upon protonation. The possibility the superposition of the two effects accounted for by the rate constants kH−i and k+−i in the same pH region introduces great error in the determination of these constants. Despite this quantitative limitation, the two effects can be detected in some cases.32
Determination of the equilibrium constants of the multistate system
The parameters obtained from the bell-shaped curve [eqn (6) or (7)], K′a determined from eqn (5), and Ka determined from eqn (1) by means of the pH-dependent absorption spectra at equilibrium and immediately after direct pH jumps (Table 1) are not sufficient to calculate the rate and equilibrium constants of the multiple states. However, the flash photolysis data permit the calculation of kiKt/(1 + Kt) with good accuracy [see eqn (12) below] along with k−h/(1 + Kt) with less accuracy. The ratio between the two terms in eqn (12) is coincident with Ktki/k−h, which is independently obtained from the direct pH jumps. This also allows k−h/(1 + Kt) to be obtained with good accuracy. Moreover, from the ratio Kh(1 + Kt)/K′a the maximum of the mole fraction distribution of the sum of the species B + Cc can be estimated. The complete resolution of all equilibrium constants in the case of the existence of a small cis–trans isomerization barrier (as in the present compounds) is only possible if Kt is determined. This is generally very difficult since the species B and Cc are elusive, in the sense that their concentrations are very small at equilibrium and during the kinetic processes.| 1(1) | 2(2) | 3(3) | 4(3) | 5(3) | 6(4) | 7(4) | 8(5) | 9(6) |
|---|---|---|---|---|---|---|---|---|
| a (1) Equilibrium; (2) immediately after a direct pH jump by stopped flow; (3) direct pH jumps; (4) flash photolysis; (5) from the ratio of column 3 to column 5; (6) from the ratio of column 8 to column 7. | ||||||||
| K′a | Ka | KhKtki | k−i | Ktki/k−h | Ktki/(1 + Kt) | k−h/(1 + Kt) |  |
Kh(1 + Kt) |
The case of the amines
The protonation of the amine substituent at lower pH introduces new kinetic pathways resulting from the different rates of these species.The mathematical expression that accounts for effects observed when there is an amine substituent is given in eqn (10) (see ESI† for the corresponding mathematical deduction):
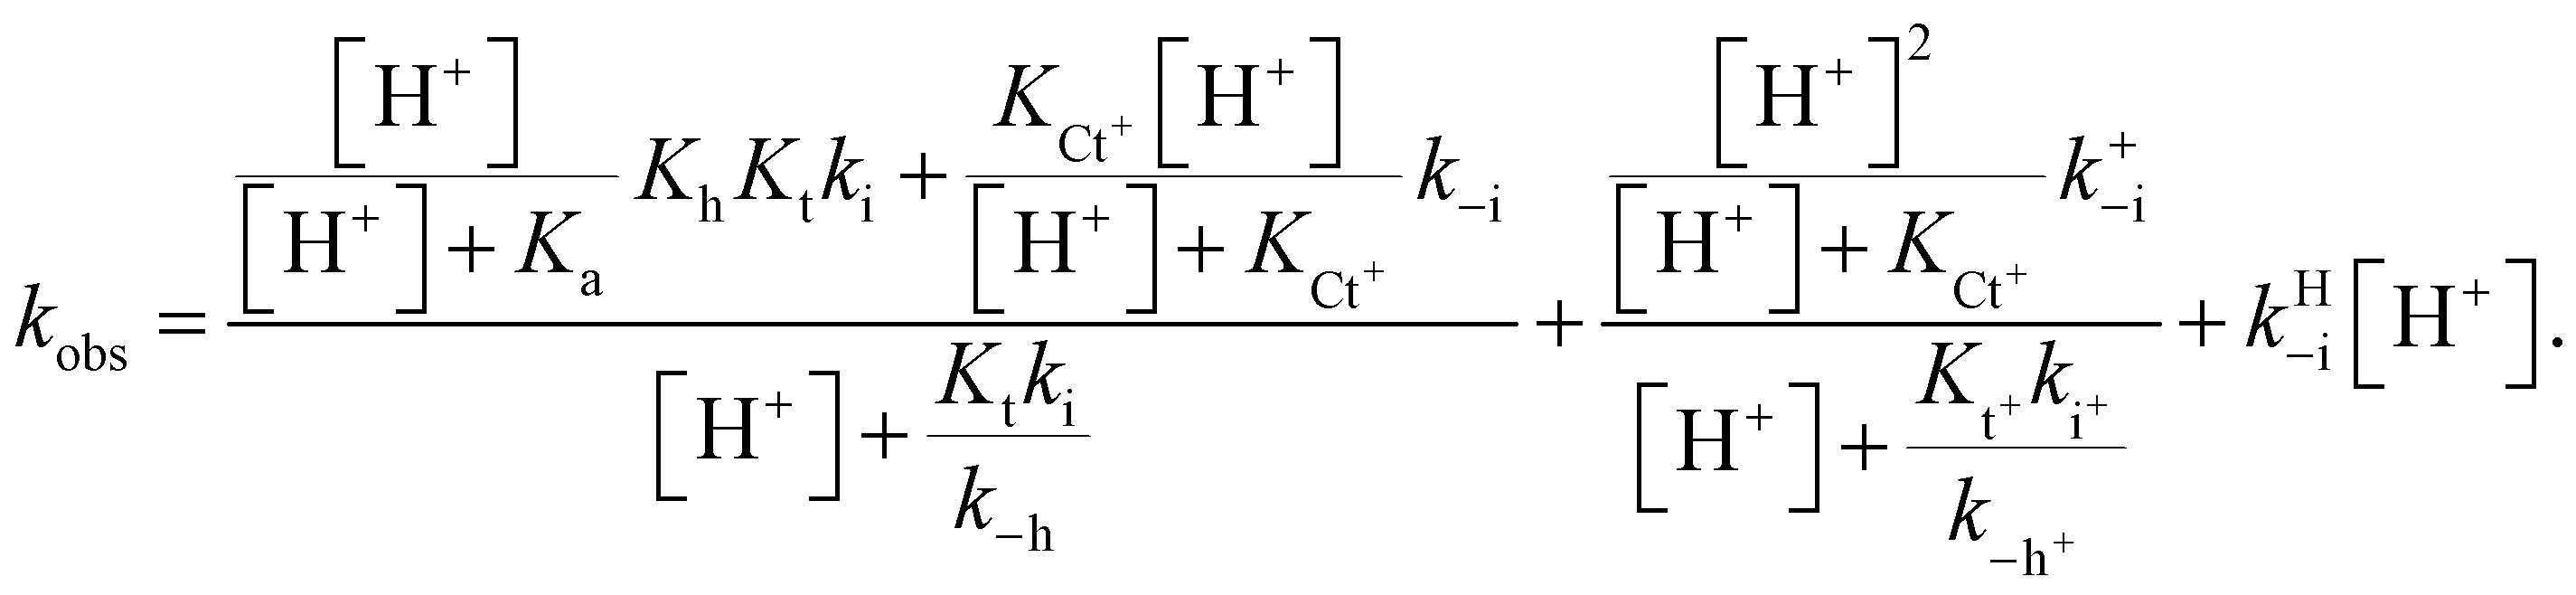 | (10) |
In this expression, the contribution of the protonated flavylium cation (in the amine substituent) was neglected because this protonation takes place at extremely acidic pH values. We also observed that the contribution of the term 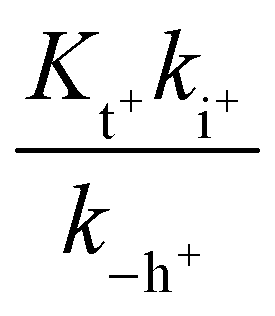 is negligible in the fittings, which is expected considering that at very low pH, the trans-to-cis isomerization rate likely controls the kinetics. The approximation given by eqn (11) is thus a good description of the system:
 | (11) |
Eqn (11) can be deduced by simple reasoning considering that at lower pH, the system is controlled by trans–cis isomerization; thus, the rate constant k−i in the bell-shaped curve is multiplied by the mole fraction of Ct, while the mole fraction of Ct+ multiplies the equivalent rate constant k+−i. In the present compounds, the bell-shaped curve is not observed because the values trend towards k−i at lower pH, but at these same pH values, a new pathway accounted for by the rate constant k+−i is open. The term kHi refers to the isomerization catalyzed by protons.
Compound 1
The flavylium cation of compound 1 in water exhibits an extended stability up to pH 8 and is only hydrated to give the trans-chalcone (ionized) at very basic pH. No photochromism was observed in water. The absorption spectrum of the flavylium cation does not change significantly in the presence of CTAB micelles, suggesting a lack of interaction due to electrostatic repulsion. However, trans-chalcone is highly stabilized by the CTAB micelles, thereby dramatically reducing the pH domain of the flavylium cation. The inspection of the shape and position of the absorption spectra indicates that CB is essentially trans-chalcone.The pH-dependent absorption spectra of compound 1 at equilibrium are shown in Fig. 5 in the acidic (a) and basic regions (b). The spectral variations are compatible with flavylium cation in equilibrium with trans-chalcone in acidic medium and trans-chalcone in equilibrium with ionized trans-chalcone in basic medium with acidity constants of pK′a = 3.8 and pKobs = 8.9, respectively.
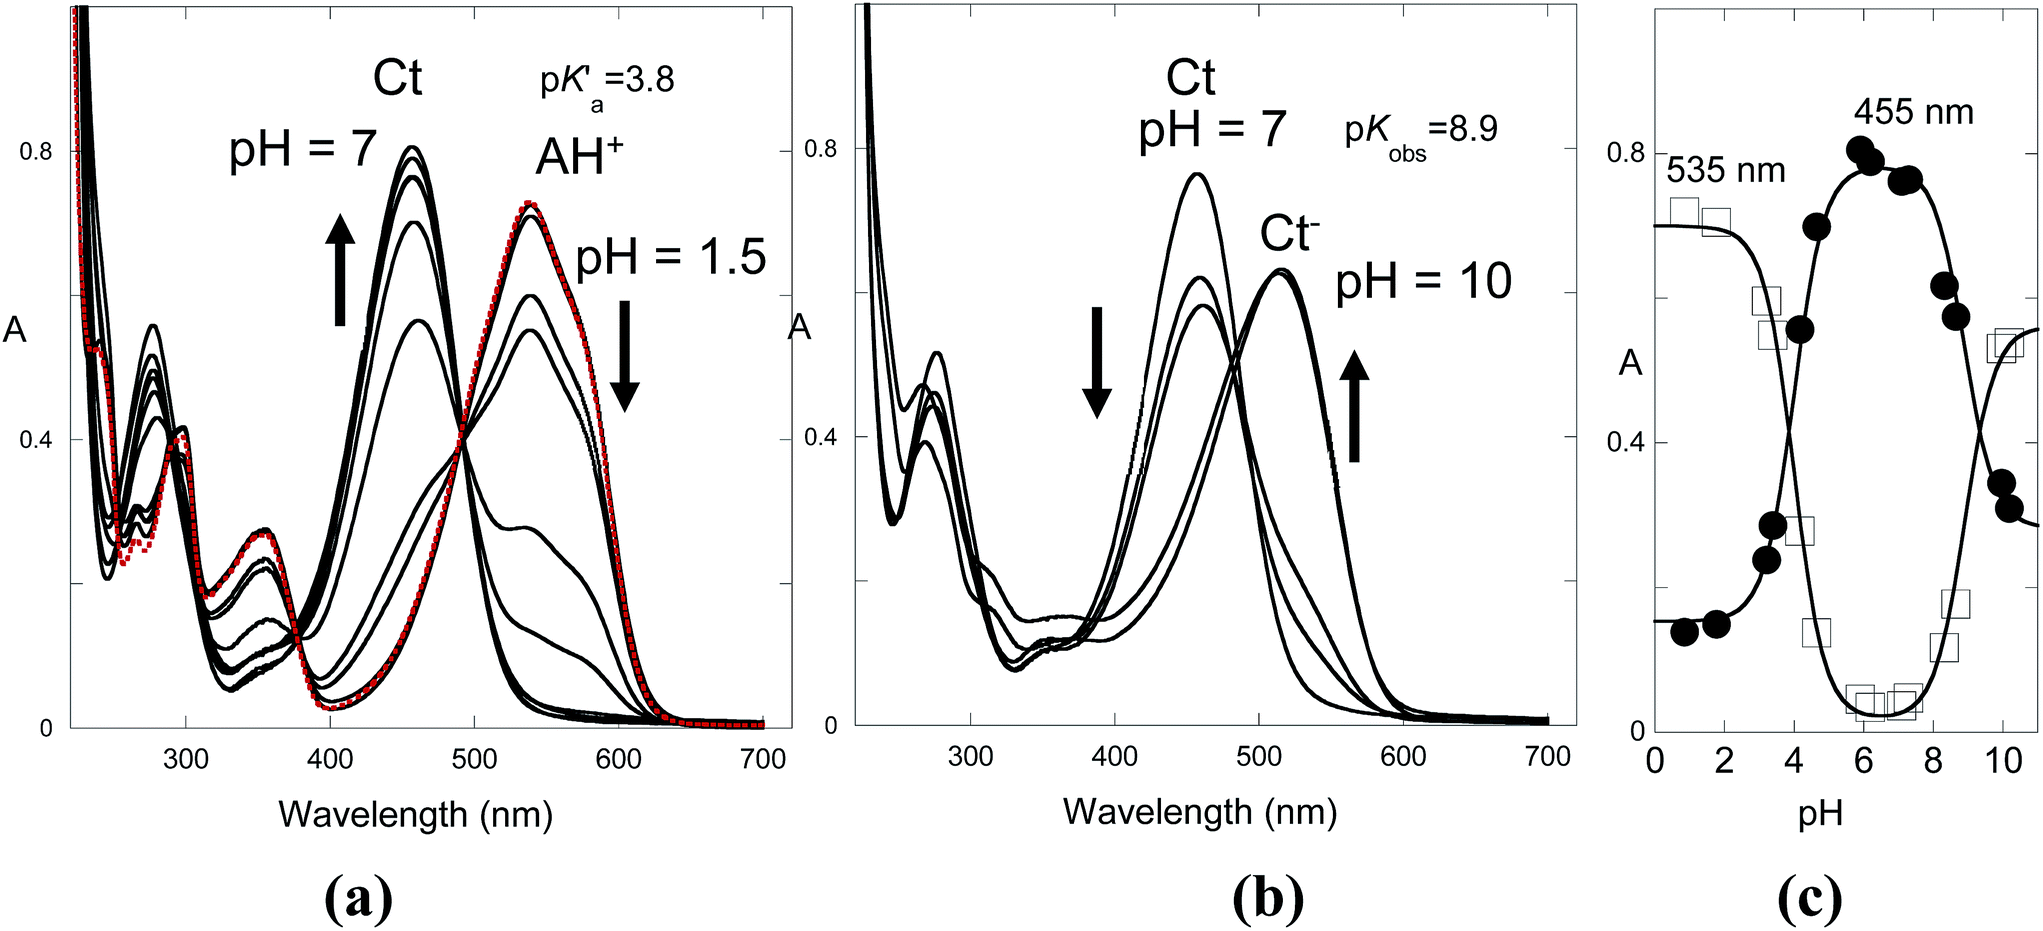 | ||
| Fig. 5 (a) pH-dependent spectral variations for compound 1 (2 × 10⁻⁵ M) in the presence of CTAB (0.020 M) in the range of 0.85 < pH < 7.1; the traced red line is in the absence of CTAB at pH = 0.85. (b) The same as in (a) but for 7.1 < pH < 10.2. (c) Fitting the absorption data, at 535 nm and 455 nm , against the pH allows us to obtain the acidity constants for pK′a = 3.8 and pKobs = 8.9. | ||
Fig. 6a shows the spectral variations after a direct pH jump to 6.1. Immediately after the pH jump, the observed absorption spectrum corresponds to the flavylium cation. The system evolves from the flavylium cation to trans-chalcone, according to mono-exponential decay.
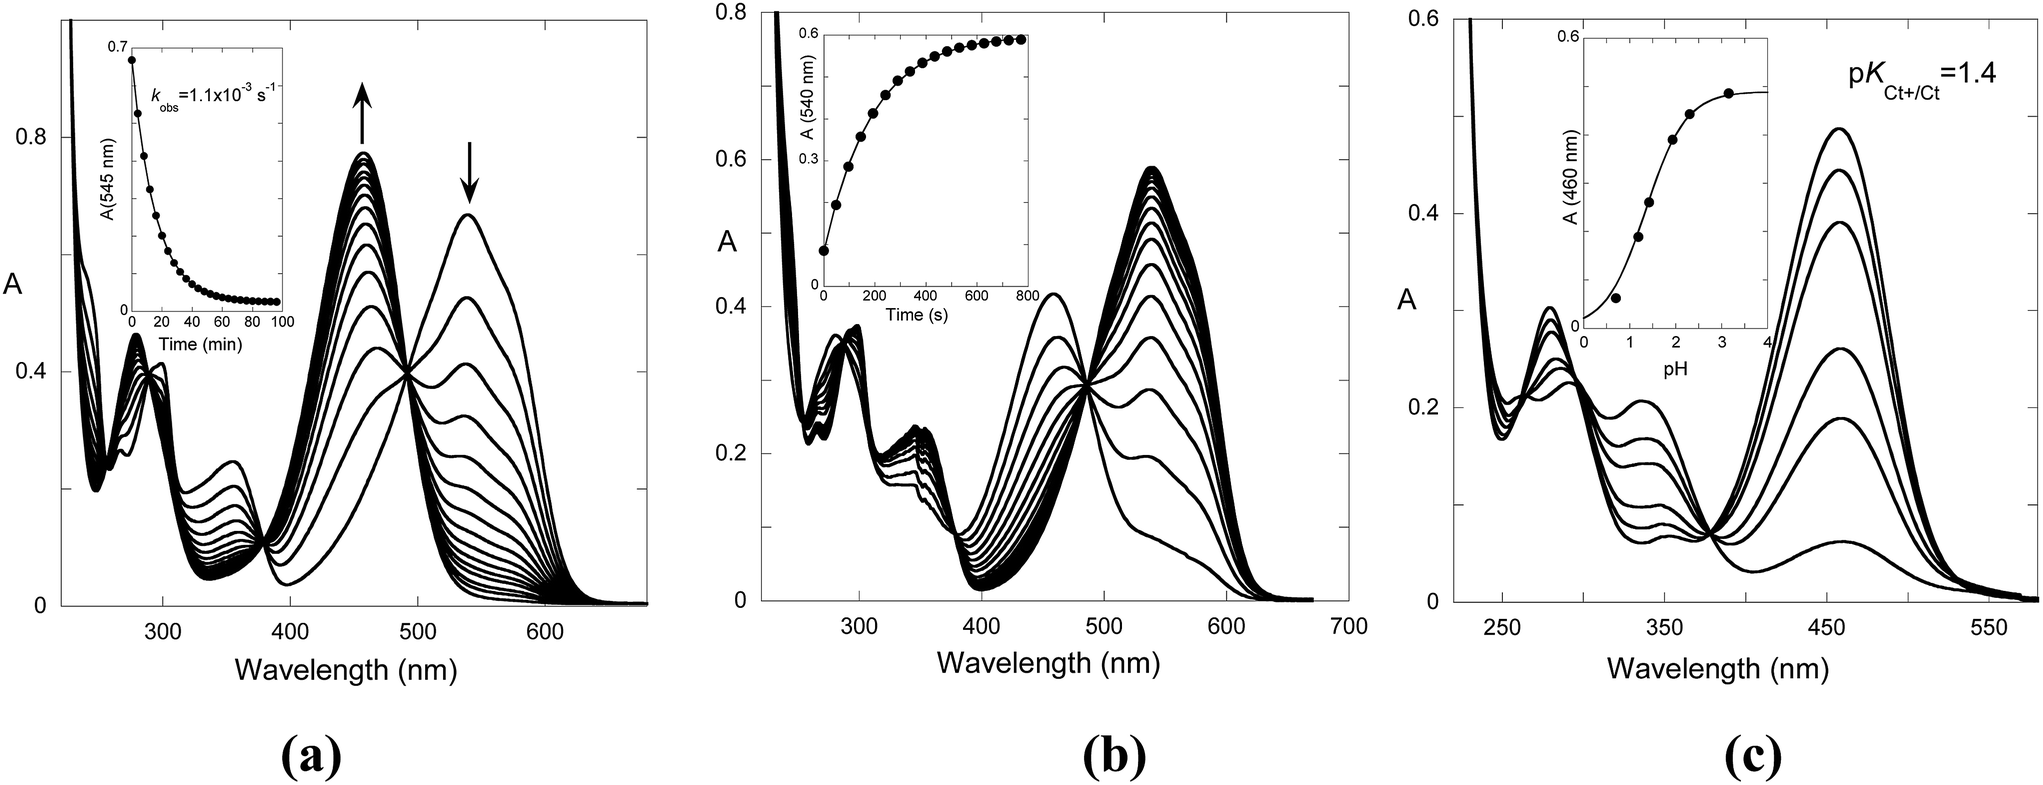 | ||
| Fig. 6 (a) Spectral variations of compound 1 (2 × 10⁻⁵ M) in the presence of CTAB micelles (0.020 M) after a direct pH jump from pH 1.0 to 6.1. (b) Spectral variations after a reverse pH jump from pH 6.8 to 1.6, kobs = 5.3 × 10⁻³ s−1. (c) Spectral variations taken immediately after a reverse pH jump. | ||
In the case of the reverse pH jumps, the initial species is trans-chalcone, which is converted to flavylium cation after the addition of acid (Fig. 6b), rendering the system thermodynamically reversible. However, at lower pH, the trans-chalcone is protonated during the mixing of the acid, and the protonated trans-chalcone starts to play a role in the kinetics. This is confirmed by the absorption spectra of the reverse pH jumps taken immediately after mixing (Fig. 6c). The equilibrium between trans-chalcone (Ct) and its protonated form (Ct+) occurs at pKCt+/Ct = 1.4. In conclusion, at lower pH, Ct+ is transformed to flavylium cation, and the spectral variations corresponding to the reverse pH jumps are not the same as those of the reversible process depicted in Fig. 6a.
The rates of the reverse and direct pH jumps accounted for by eqn (11) are represented in Fig. 7. Fitting was achieved for the following parameters:

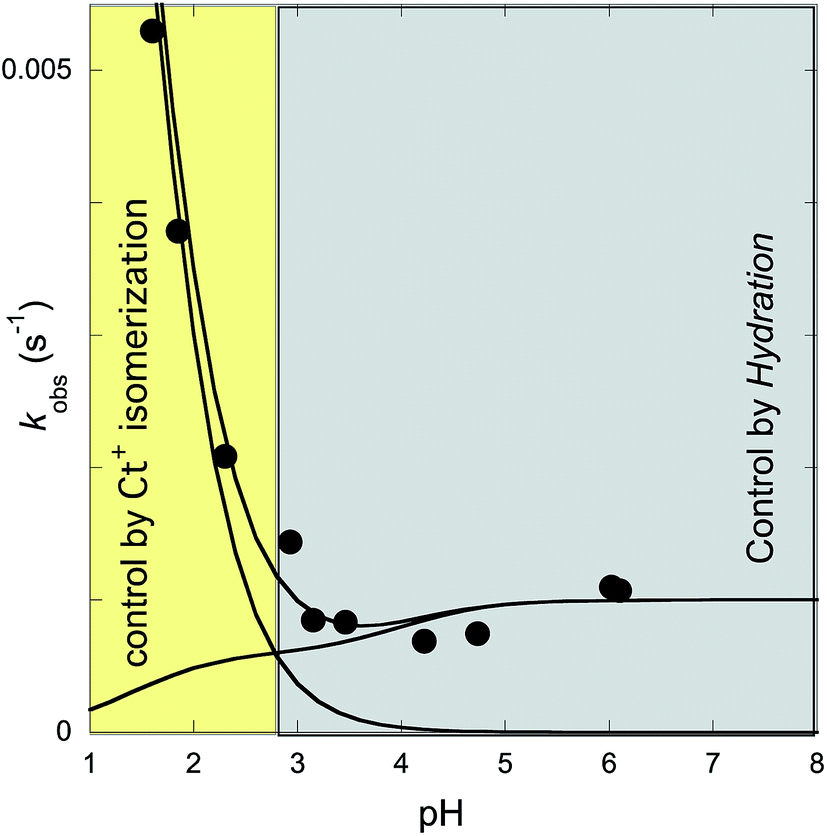 | ||
| Fig. 7 Rate constants of the slowest kinetic process in reaching equilibrium after direct and revere pH jumps observed for compound 1 in the presence of CTAB (0.020 M). The individual contributions of the protonated and non-protonated species were simulated according to eqn (11). Fitting was achieved for KhKtki = 9.5 × 10⁻⁸ M s−1; k−i = 6 × 10⁻⁴ s−1; Ktki/k−h = 1.0 × 10⁻⁴ M; k+−i = 0.015 s−1; KCt+/Ct = 10−1.4. | ||
The rate constant kh can be calculated from the ratio of the first and the third parameters, kh = 9.5 × 10⁻⁴ s−1.
In Fig. 7, which shows the rate constants as functions of pH [eqn (11)], the existence of two regimes accounting for the multistate species that are protonated or non-protonated at the amine substituent is apparent. Regarding the kinetics of the non-protonated species, at higher pH, the process is controlled by the hydration rate constant (kh). This corresponds to the limit of eqn (7) when the proton concentration is very small. At lower pH, the trans-to-cis isomerization is the rate-determining step (k−i), the limit of eqn (7) at higher proton concentrations. For the kinetics of the protonated species, no intermediate Cc+ or B+ is directly observed; thus, the kinetic control is likely the trans-to-cis isomerization of the protonated chalcones, which is the basis of the approximation that gives eqn (11).
Flash photolysis
When a flavylium-based system exhibits photochromism, as in the present compound in the presence of CTAB, flash photolysis is a powerful technique to obtain crucial kinetic information of the system. The origin of the photochromism is related to the photo-induced cis–trans isomerization of the chalcones, which is the formation of the cis isomer from the trans isomer in this case. Transient absorption were observed after a light flash and monitored for the trans-chalcone and flavylium cation at 455 nm and 535 nm, respectively. The results obtained at pH 3.3 and pH 6.1 are represented in Fig. 8a and b, respectively. At pH 3.3, the bleaching of Ct absorption immediately after the flash is observed and attributed to the formation of Cc, which takes place during the lifetime of the flash (μs).33 The bleaching occurs because the mole absorption coefficient of Cc is lower than that of Ct at 455 nm. The absorption of Ct is only partially recovered. Simultaneously, at 535 nm, the absorption of the flavylium cation increases. This general behavior (the partial recovery of Ct and formation of AH+) has been identified in other flavylium compounds lacking the cis–trans isomerization barrier.34,35 The lack of the cis–trans isomerization barrier was confirmed by the flash photolysis at pH 6.1 [Fig. 8b]. After the flash, the Ct absorption is completely recovered with a rate constant of 0.6 s−1. On the other hand, no increase in absorption due to flavylium cation formation is detected at 535 nm. The very small decrease in absorption at this wavelength can be explained by the slightly higher mole absorption coefficient of Cc at this longer wavelength compared to Ct, as observed in other cis-chalcones.36 These results clearly show that the system does not have any cis–trans isomerization barrier, in contrast to, for example, anthocyanins.12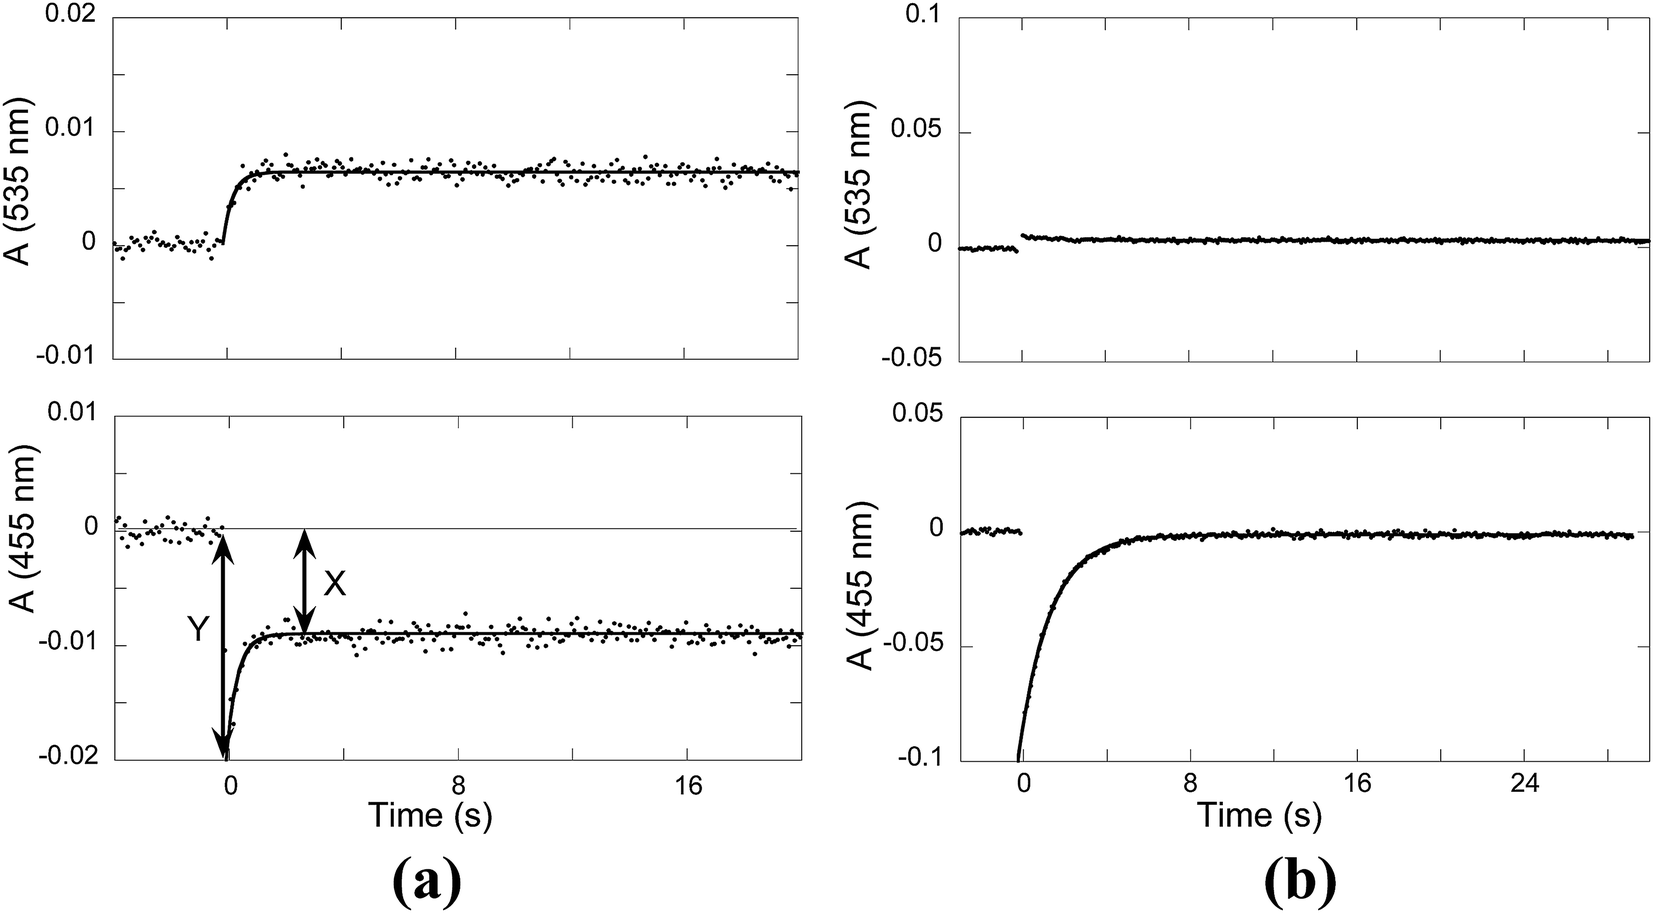 | ||
| Fig. 8 Flash photolysis traces of the compound 1 (2 × 10⁻⁵ M) in the presence of CTAB (0.020 M): (a) pH = 3.3, kobs = 2.3 s−1 and (b) pH = 6.1, ki = 0.6 s−1. | ||
The experimental data of flash photolysis at moderate pH values, where the contribution of the protonated species can be neglected, can be accounted for by eqn (12). Moreover, the yield of Ct recovery is given by eqn (13) (see Fig. 9). The equilibrium between Cc and B is again considered to be reached quickly compared to the other processes.
 | (12) |
 | (13) |
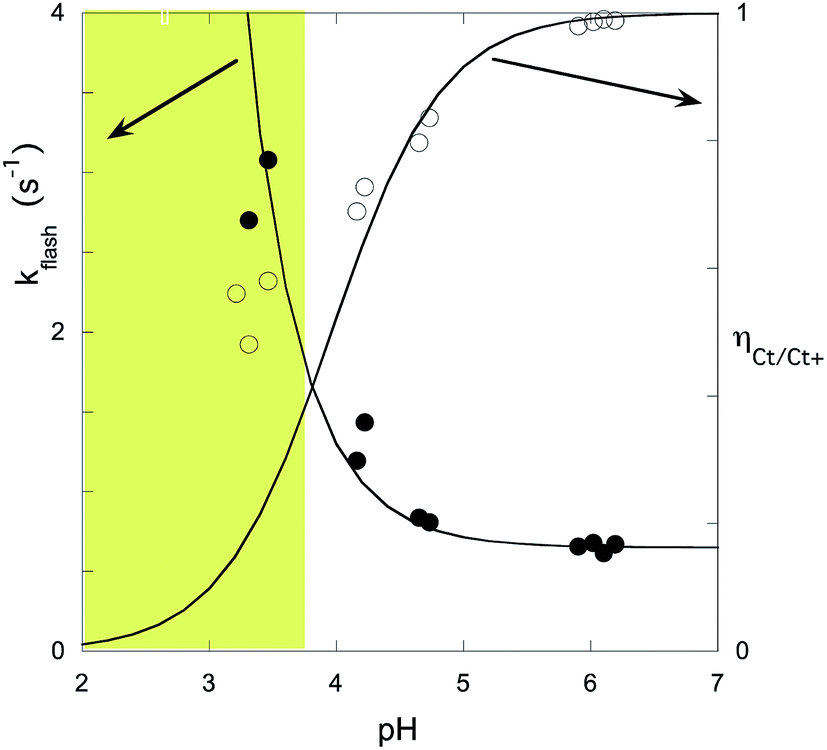 | ||
| Fig. 9 Representation of the flash photolysis rate constants as functions of pH and (○) and yield of Ct recovery (●) for compound 1 in the presence of 0.020 M CTAB. Fitting was achieved by means of eqn (12) and (13) with Ktki/(1 + Kt) = 0.65 s−1 and k−h/(1 + Kt) = 6500 M s−1. | ||
At higher pH, where the Ct recovery is complete, the value of the respective plateau in Fig. 9 (black circles) gives Ktki/(1 + Kt). As mentioned above, the fitting of the second term in eqn (12), k−h/(1 + Kt), does not have good accuracy. However, the ratio between the first and second terms in eqn (12) should be equal to Ktki/k−h, a value previously calculated from Fig. 6B (Table 2). Eqn (12) and (13) can thus be used to fit the experimental data from flash photolysis, as shown in Fig. 9, before any significant contribution of the protonated species. Inspection of Fig. 9 shows that at lower pH, the influence of the protonated species is observed (yellow region), and the yield of Ct recovery is greater than that predicted by eqn (13). This suggests that in the protonated species, the recovery of Ct is faster than flavylium formation when compared to the same reactions of the non-protonated species (open circles in Fig. 9).
| Compound | pK′a | pKa | KhKtki | Ktki/k−h | k−i | k+−i | pKCt+ | kh |
|---|---|---|---|---|---|---|---|---|
| 1 | 3.8 | — | 1.0 × 10⁻⁷ | 1.0 × 10⁻⁴ | 6.0 × 10⁻⁴ | 0.015 | 1.4 | 9.5 × 10⁻⁴ |
| 2 | 3.8 | 6.0 | 2.0 × 10⁻⁸ | 7 × 10⁻⁵ | 6.0 × 10⁻⁵ | 0.0015 | 1.1 | 2.9 × 10⁻⁴ |
| 3 | 1.6 | 6.2 | 2.5 × 10⁻⁷ | 6 × 10⁻⁴ | 1.0 × 10⁻⁵ | 0.002 | 0.7 | 4.2 × 10⁻⁴ |
| Compound | Ktki/(1 + Kt) | k−h/(1 + Kt) | Kh(1 + Kt) |
|---|---|---|---|
| 1 | 0.65 | 6500 | 1.5 × 10⁻⁷ |
| 2 | 0.2 | 2860 | 9.9 × 10⁻⁸ |
| 3 | 0.6 | 1000 | 4.2 × 10⁻⁷ |
A deeper analysis of the flash photolysis data for the protonated species would include the equilibrium between Cc, Cc+, B and B+, as shown in the ESI.† However, the large number of unknown parameters precludes the respective quantitative analysis. Nevertheless, crucial information on the system is obtained from the data reported in Table 2.
The ratio Kh(1 + Kt)/K′a = 0.14% confirms that the species B and Cc can be neglected at equilibrium, rendering K′a = KhKtKi within experimental error. The coherence of the experimental data can be verified by the ratio KhKtki/k−i = 1.6 × 10⁻⁴, in agreement with the value of K′a. For this compound, we were not able to obtain information on the kinetics of equilibrium between B and Cc; as a result, Kt was not obtained. While this is a drawback, it does not prevent the study of the system if B and Cc are considered together in the energy level diagram of the multistate system.19 This diagram can be obtained from the equilibrium constants of the multistate system and the relation ΔG0 = −RTlnK. In the present case, it is not possible to obtain the positions of B and Cc; however, 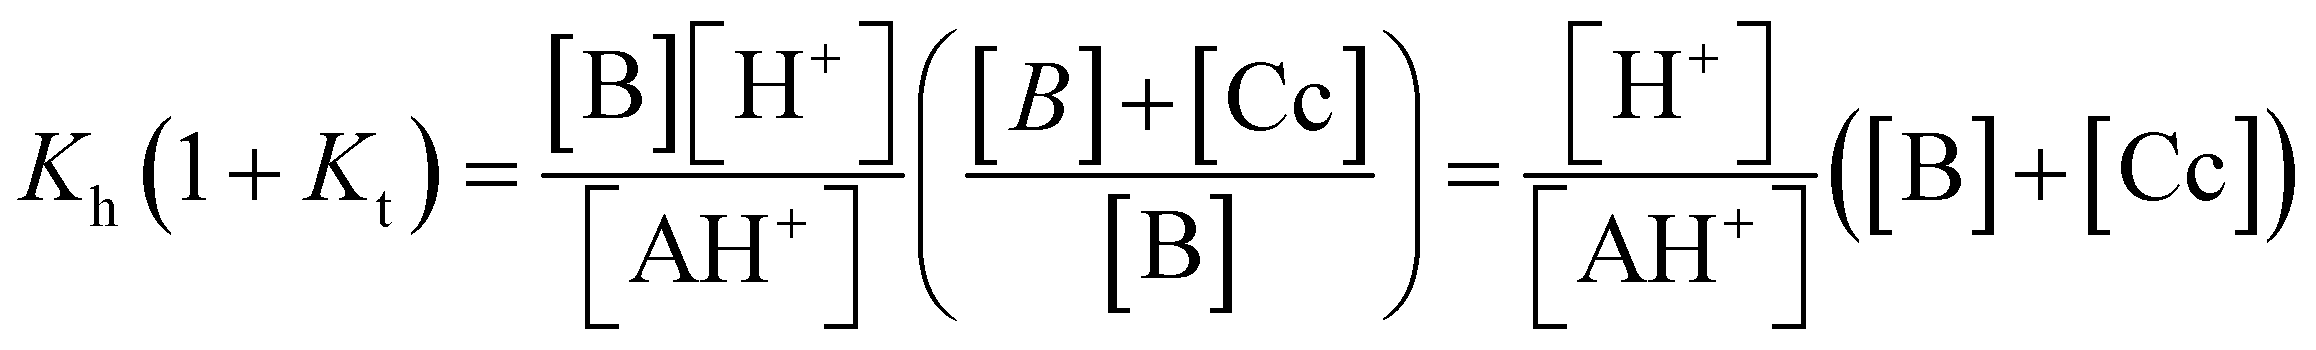 corresponds to equilibrium with constant Kh(1 + Kt) involving the species AH+ and the sum of B and Cc.
| AH+ + H2O ⇌ B + Cc + H3O+, Kh(1 + Kt) | (14) |
This allows us to draw the energy level diagram of the multistate system and rationalize the direct and reverse pH jumps as well as the flash photolysis (Schemes 3 and 4).
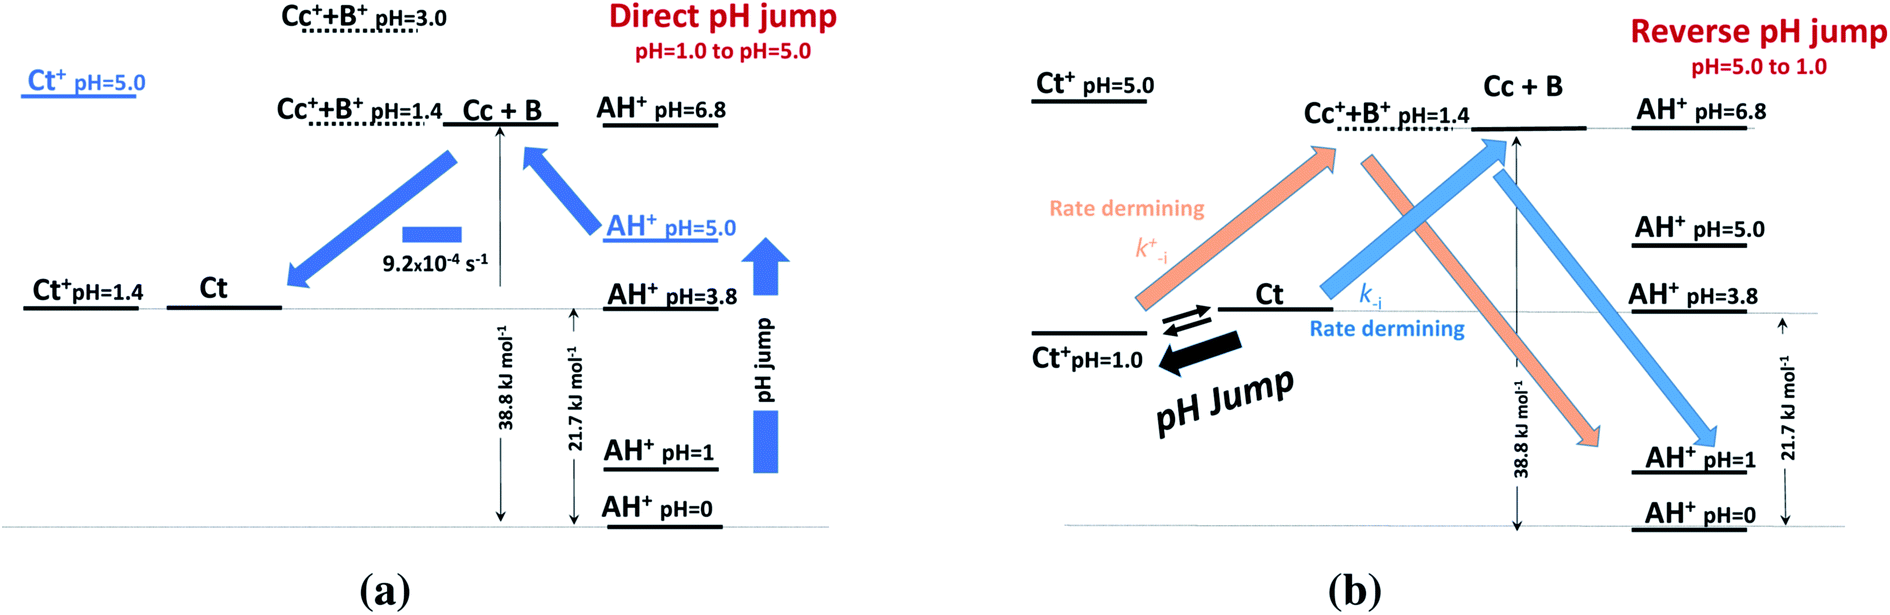 | ||
| Scheme 3 Energy level diagrams of (a) direct and (b) reverse pH jumps of compound 1 in the presence of 0.020 M CTAB micelles. | ||
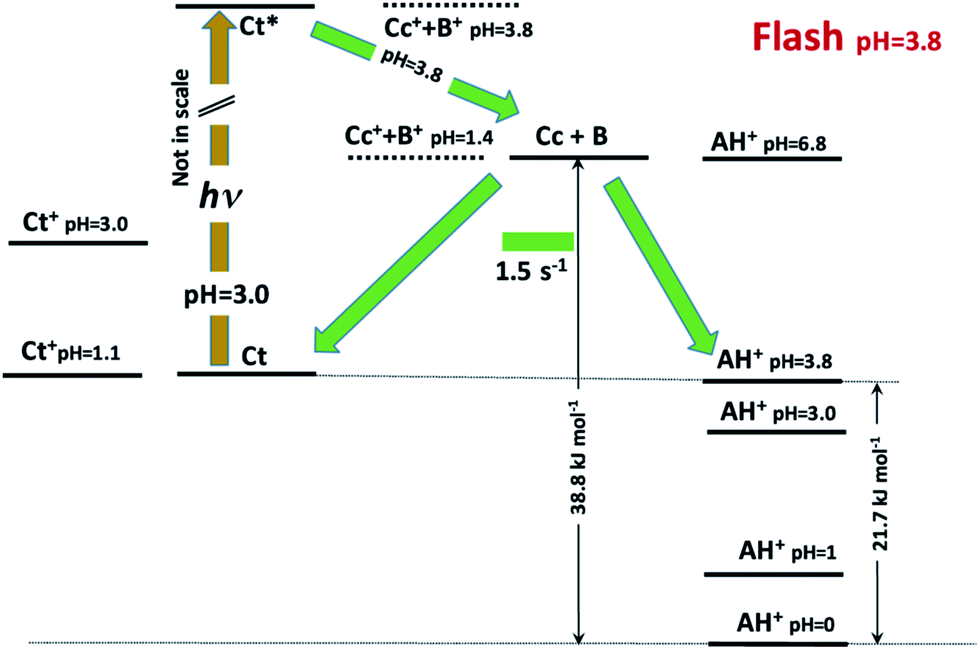 | ||
| Scheme 4 Energy level diagram accounting for the photochromism of compound 1 in the presence of 0.020 M CTAB micelles. | ||
At the direct pH jump from pH 1.0 to 5.0 (Scheme 3a), the system evolves to Ct, the most stable species, from B and Cc. During the reverse pH jumps (Scheme 3b), the initial species is Ct (pH = 5.0), and equilibrium between Ct and Ct+ is established with 72% Ct+ immediately after the (reverse) pH jump. The system has two competitive channels to go back to the flavylium cation, which is the stable species at pH 1.0: (i) the neutral route and (ii) the protonated route.
The flash photolysis data can also be rationalized using the energy level diagram. At pH 3.8, the species Ct is in equilibrium with AH+ (50% each) and can be excited in the near-UV range. The excited state can decay by radiative and non-radiative paths (not shown in the figure) and isomerize to Cc. This last species can revert back to Ct or forward leading to AH+. The excess AH+ obtained upon light absorption decreases to the equilibrium concentration in a way similar to a direct pH jump to pH 3.8. At higher pH, Cc reverts completely to Ct.
The following relation [AH+]/[Ct+] = KCt+/K′a = 25 emphasize that, at the equilibrium, the fraction of AH+ predominates and Ct+ can be neglected.
The mathematical treatment for the two other compounds is similar to that of compound 1; the respective details are shown in the ESI,† and the data are reported in Table 2.
A global view of the thermodynamics of the three compounds is given in Scheme 5. The flavylium cation at pH 0 was used as a common reference point. The energy level of Ct+ was calculated for pH 1.0. The energy level of Cc+ + B+ was positioned considering the acidity constant of the Cc species, which is only a rough approximation. Nevertheless, some information can be obtained by inspecting this diagram. The thermodynamic levels of compounds 1 and 2 are similar, indicating that the introduction of the hydroxyl substituent in position 4′ does not significantly affect the energy levels. When comparing compounds 1 and 2 with compound 3, it is clear that the trans-chalcones and the cis-chalcone/hemiketal are very destabilized by the bridge. On the other hand, the quinoidal base is not affected. This result was expected considering that like flavylium cation, the quinoidal base is a planar molecule in which the bridge can be well accommodated. In the other species and particularly in trans-chalcone, the bridge introduces geometric constraints that destabilize the structures.
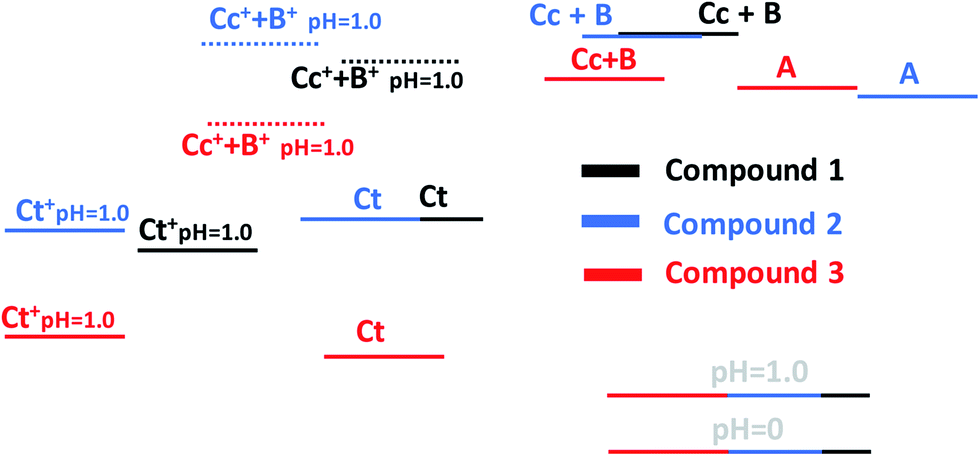 | ||
| Scheme 5 Energies of the three compounds studied in this work relative to flavylium cation superimposed at pH 0. | ||
Conclusions
Amino substituents increase the complexity of the flavylium-based multistate system of chemical reactions by introducing new channels of reactivity upon protonation of the several species in acidic media. Despite their complexity, these systems and other flavylium-based multistate systems are conveniently rationalized by constructing an energy level diagram in which the relative thermodynamic energy levels of the multiple species are compared with that of flavylium cation at pH 0. The flavylium cation is always the most stable thermodynamic species in sufficiently acidic media. In moderately acidic conditions, the species appearing at the top of the diagram have negligible concentrations at equilibrium.Acknowledgements
This work was supported by the Associated Laboratory for Sustainable Chemistry – Clean Processes and Technologies – LAQV. The latter is financed by national funds from FCT/MEC (UID/QUI/50006/2013) and co-financed by the ERDF under the PT2020 Partnership Agreement (POCI-01-0145-FEDER-007265). FCT/MEC is also acknowledged through the National Portuguese NMR Network RECI/BBB-BQB/0230/2012, and Projects PTDC/QEQ-QFI/1971/2014 and POCI-01-0145-FEDER-016387 “SunStorage – Harvesting and storage of solar energy,” funded by the European Regional Development Fund (ERDF) through COMPETE 2020-Operational Programme for Competitiveness and Internationalization (OPCI). N. B. and J. M. gratefully acknowledge the postdoctoral grant from FCT/MEC (SFRH/BPD/84805/2012) and doctoral grant from CONACyT (MEX/Ref. 288188), respectively.References
- M. Irie, T. Fukaminato, K. Matsuda and S. Kobatake, Chem. Rev., 2014, 114, 12174–12277 CrossRef CAS.
- H. M. D. Bandara and S. C. Burdette, Chem. Soc. Rev., 2012, 41, 1809–1825 RSC.
- R. Klajn, Chem. Soc. Rev., 2014, 43, 148–184 RSC.
- W. A. Velema, W. Szymanski and B. L. Feringa, J. Am. Chem. Soc., 2014, 136, 2178–2191 CrossRef CAS.
- P. Ceroni, A. Credi and M. Venturi, Chem. Soc. Rev., 2014, 43, 4068 RSC.
- W. Szymański, J. M. Beierle, H. A. V. Kistemaker, W. A. Velema and B. L. Feringa, Chem. Rev., 2013, 113, 6114–6178 CrossRef PubMed.
- F. D. Jochum and P. Theato, Chem. Soc. Rev., 2013, 42, 7468–7483 RSC.
- M. W. Ambrogio, C. R. Thomas, Y.-L. Zhao, J. I. Zink and J. F. Stoddart, Acc. Chem. Res., 2011, 44, 903–913 CrossRef CAS.
- D.-H. Qu, Q.-C. Wang, Q.-W. Zhang, X. Ma and H. Tian, Chem. Rev., 2015, 115, 7543–7588 CrossRef CAS.
- K. Ichimura, Chem. Rev., 2000, 100, 1847–1874 CrossRef CAS.
- A. Fihey, A. Perrier, W. R. Browne and D. Jacquemin, Chem. Soc. Rev., 2015, 44, 3719–3759 RSC.
- F. Pina, M. J. Melo, C. A. T. Laia, A. J. Parola and J. C. Lima, Chem. Soc. Rev., 2012, 41, 869–908 RSC.
- Ø. M. Andersen and M. Jordheim, in Flavonoids, Chemistry, Biochemistry and Applications, ed. Ø. Andersen and K. R. Markham, CRC, Taylor and Francis, 2006, ch. 10 Search PubMed.
- R. Brouillard and J. Dubois, J. Am. Chem. Soc., 1977, 99, 1359–1364 CrossRef CAS.
- R. Brouillard and J. Lang, Can. J. Chem., 1990, 68, 755–761 CrossRef CAS.
- R. A. McClelland and S. Gedge, J. Am. Chem. Soc., 1980, 102, 5838–5848 CrossRef CAS.
- The quinoidal base formation only occurs when there is a hydroxyl substituent as in anthocyanins.
- F. Pina, J. Agric. Food Chem., 2014, 62, 6885–6897 CrossRef CAS PubMed.
- N. Basílio and F. Pina, Molecules, 2016, 21, 1502 CrossRef PubMed.
- Y. Kohno, M. Ito, M. Kurata, S. Ikoma, M. Shibata, R. Matsushima, Y. Tomita, Y. Maeda and K. Kobayashi, J. Photochem. Photobiol., A, 2011, 218, 87–92 CrossRef CAS.
- M. Pessêgo, S. Gago, N. Basílio, C. A. T. Laia, A. Jorge Parola, J. C. Lima and F. Pina, Org. Biomol. Chem., 2017, 15, 338–347 Search PubMed.
- R. Gomes, A. J. Parola, C. A. T. Laia and F. Pina, J. Phys. Chem. B, 2007, 111, 12059–12065 CrossRef CAS PubMed.
- N. Basílio, V. Petrov and F. Pina, ChemPlusChem, 2015, 80, 1779–1785 CrossRef.
- T. Kottke and D. Stalke, Crystal handling at low temperatures, J. Appl. Crystallogr., 1993, 26, 615–619 CrossRef.
- APEX2, Data Collection Software Version 2012.4, Bruker AXS, Delft, The Netherlands, 2012 Search PubMed.
- Cryopad, Remote monitoring and control, Version 1.451, Oxford Cryosystems, Oxford, UK, 2006 Search PubMed.
- SAINT+, Data Integration Engine v. 8.27b©, 1997-2012, Bruker AXS, Madison, Wisconsin, USA Search PubMed.
- G. M. Sheldrick. SADABS 2012/1, Bruker AXS Area Detector Scaling and Absorption Correction Program, 2012, Bruker AXS, Madison, Wisconsin, USA Search PubMed.
- G. M. Sheldrick, A short history of SHELX, Acta Crystallogr., Sect. A: Found. Crystallogr., 2008, 64, 112–122 CrossRef CAS PubMed.
- G. M. Sheldrick. SHELXT v. 2014/3, Program for Crystal Structure Solution, University of Göttingen, 2014 Search PubMed.
- G. M. Sheldrick. SHELXL v. 2014, Program for Crystal Structure Refinement, University of Göttingen, 2014 Search PubMed.
- J. Avó, V. Petrov, N. Basílio, A. Jorge Parola and F. Pina, Dyes Pigm., 2016, 135, 86–93 CrossRef.
- Y. Leydet, P. Batat, G. Jonusauskas, S. Denisov, J. C. Lima, A. J. Parola, N. D. McClenaghan and F. Pina, J. Phys. Chem. A, 2013, 117, 4167–4173 CrossRef CAS PubMed.
- N. Basílio, A. Fernandes, V. de Freitas, S. Gago and F. Pina, New J. Chem., 2013, 37, 3166–3173 RSC.
- V. Petrov, S. Stanimirov, I. K. Petrov, A. Fernandes, V. de Freitas and F. Pina, J. Phys. Chem. A, 2013, 117, 10692–10701 CrossRef CAS PubMed.
- F. Pina, M. J. Melo, M. Maestri, R. Ballardini and V. Balzani, J. Am. Chem. Soc., 1997, 119, 5556–5561 CrossRef CAS.
Footnote |
| † Electronic supplementary information (ESI) available. CCDC 1543226–1543228. For ESI and crystallographic data in CIF or other electronic format see DOI: 10.1039/c7ra04514j |
| This journal is © The Royal Society of Chemistry 2017 |