 Open Access Article
In situ excess sludge reduction in SBBR through uncoupling of metabolism induced by novel aeration modes
Benzhou Gonga,
Yingmu Wanga,
Jiale Wanga,
Yanyan Doua and
Jian Zhou *ab
*ab
aFaculty of Urban Construction and Environmental Engineering, Chongqing University, 174 Shazheng Street, Chongqing 400045, PR China. E-mail: zhoujiantg@126.com; Fax: +86 23 65120980; Tel: +86 23 65120980
bKey Laboratory of the Three Gorges Reservoir's Eco-Environments, Ministry of Education, Chongqing University, Chongqing 400045, PR China
First published on 5th June 2017
Abstract
To minimize sludge yield (Yobs) in bench-scale sequencing batch biofilm reactors (SBBRs) during wastewater treatment, novel aeration modes were employed: triangular-wave aeration, square-wave aeration, sawtooth-wave aeration and continuous aeration. SBBR with square-wave aeration showed the lowest observed Yobs about 304% lower than SBBR with continuous aeration. The ATP inhibition phenomenon and lower density of micro-faunas in SBBR with square-wave aeration confirmed that the metabolism uncoupling contributed to lower Yobs instead of micro-fauna predation. No significantly different removal efficiencies of chemical oxygen demand (COD) were found in 4 SBBRs, but the highest total nitrogen (TN) removal efficiency of around 69% was achieved in SBBR with square-wave aeration. The feasibility of using oxidation reduction potential (ORP) as an indication for in situ sludge reduction was illustrated based on the interrelation between ORP in the bulk and within the biofilm.
1. Introduction
With growing numbers of wastewater treatment plants (WWTPs), disposal of huge volumes of excess sludge is creating environmental challenges. Conventional disposal options, such as landfill and/or incineration, are really costly, which are estimated to take up 50–60% of the total operational costs in WWTPs.1 In addition, those disposal methods have been proposed to be prohibited due to the increasing environmental issues.2 The sludge reduction approaches are mainly classified into two categories:3 (1) post treatment of excess sludge; (2) in situ sludge reduction in the process of sewage treatment. The minimization of sludge production during biological wastewater treatment has been given more attention recently,4,5 since in situ excess sludge reduction during the wastewater treatment has more advantages than post treatment, such as no extra process unit required, less cost and reduction of sludge yield (Yobs) from the source of sewage treatment.6 Therefore, the developments of novel and feasible in situ sludge reduction technologies will be a considerable impetus in the future investigation.The current in situ sludge reduction technologies include: (1) the chemical and/or physical lysis-cryptic methods combining with the activated sludge processes; (2) sludge reduction technologies based uncoupling metabolism; (3) sludge reduction by worms' predation technology.
Conservation of free energy has been implicated as the vital link between the coupled processes of anabolism of new biomass and catabolism of organic pollutants.7 Therefore, dissipating catabolically extracted energy limits anabolism and results in uncoupled metabolism and reduced biomass yield.8 Uncoupled metabolism can be induced by abnormal circumstances, such as chemical uncouplers9,10 and oxic-settling-anaerobic (OSA) process.11,12 Some researchers have also reported that the sequential coupling aerobes/anaerobes environment can successfully induce the uncoupling metabolism phenomenon and realize sludge reduction.13–15 In the aerobes/anaerobes alternative operating process, the slow change of dissolved oxygen (DO) effect on sludge reduction was still not clear. In addition, overwhelming majority reports focus on sludge reduction in active sludge process, which require complicated management or upgrading and reconstruction for the existed WWTPs, such as adding compartments or adding extra anaerobic tank in the process. There are very few reports about in situ sludge reduction in biofilm process, especially sequencing batch biofilm reactor (SBBR).
In this research, the novel modified aeration mode was expected as technical path to induce the metabolism uncoupling and consequently realize in situ sludge reduction in SBBR system during the wastewater treatment. The oxidation reduction potential (ORP) in the liquid phase and ORP within the biofilm were analyzed. It was discussed to use the ORP as an indication for this in situ sludge reduction system. In addition, the mechanism was confirmed by evaluating the ATP level in biomass and the performance of micro-fauna predation in system.
2. Materials and methods
2.1 SBBR
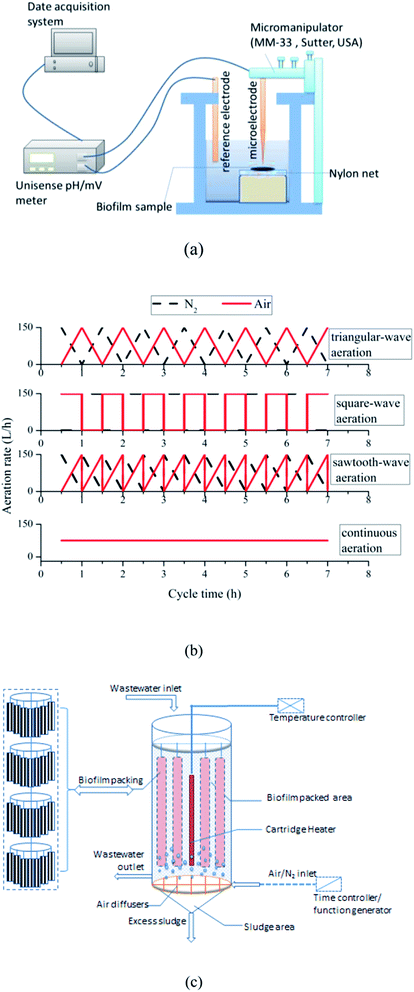
The experiments were conducted in four bench-scale SBBRs. As shown in Fig. 1, the SBBRs were fabricated cylindrically with polymethyl methacrylate and bottomed with mud settling funnel. The working volume of each reactor was 10 L, 45% of which was packed with semi-soft fiber filler. To avoid the disruption caused by aeration, super-fine bubble air diffusers were designed in the reaction zone to distribute the air/N2. And different aeration modes were achieved by the air/N2 blower controlled by the time controller and function generator. Constant temperature heating rods were employed to maintain liquid phase temperature stabilized in SBBRs. All SBBRs were operated under the same cycle. Each cycle operated as: inflow 0.5 h→ reaction 6.5 h → precipitation 0.5 h → drainage 0.5 h, thus total cycle time was 8.0 h. Three cycles per day were conducted sequentially.2.2 Feed composition
In order to simulate the wastewater composition fluctuation in the practical situation of the influents of WWTPs, the domestic sewage from campus was collected and lifted for use after settling in a primary sedimentary tank. The composition of the sewage was shown in Table 1.| Parameters | COD | NH4+–N | TN | PO43−–P | SS |
|---|---|---|---|---|---|
| Conc. range (mg L−1) | 220–400 | 42–53 | 53–71 | 4.4–6.7 | 46–115 |
| Average conc. (mg L−1) | 300 | 49 | 62 | 5.17 | 75 |
2.3 Experimental design and operation
In order to keep the real-time shear force consistent with continuous aeration, the N2 was supplied to compensate aeration intensity difference caused by different aeration modes. During the entire experiments, the water temperature was maintained around 25 ± 2 °C, the organic load was around 1.0 kg COD/(m3 filler d), the aeration rate of air supplied by the air blower was 150 L h−1.
2.4 ATP extraction and measurement
Luciferase enzymatic method was adopted to determine ATP. In this study, BacTiter-Glo ™ Microbial Cell Viability Assay kit (Promega, American) was used for measurement. ATP extraction and testing procedures: (1) appropriate amount of sludge samples from fixed 5 sampling points of the biofilm were taken on the carrier, thoroughly mixed the samples in a flask; (2) well-mixed sludge sample 1 mL was taken from the flask, placed in a centrifuge at 4 °C centrifuged at 5000 rpm for 10 min. The supernatant was discarded, and solid phase was collected; (3) the solid phase was rinsed with deionized water 3 times; (4) sludge samples were re-suspended the extract by adding 1 mL 2.5% of TCA, and then placed in an ice bath at 0 °C for 30 min, then placed in a centrifuge at 4 °C centrifuged at 5000 rpm for 10 min; (5) pipetted 40 μL supernatant derived from step (3), adding into 50 mM of Tris–HCl (pH 7.75) solution 960 μL (TCA final concentration of 0.1%), the ATP extract obtained; (6) adding the ATP extract 100 μL into 100 μL of BacTiter-Glo™ reagent, after well mixing, measured by GloMaxTM 20/20 luminous emission intensity (integration time 5 s), record the luminescence.2.5 ORP determination procedure
The ORP distribution among the thickness of the biofilm was determinated by the system shown in Fig. 1(a). Microelectrodes were purchased from Unisense (Denmark). A micromanipulator (MM-33, Sutter, USA) was used to control the movement of microelectrode (RD 50, Unisense, Denmark). For ORP measurements, an external reference electrode (REF 5000, Unisense, Denmark) was introduced into chamber cell (Fig. 1). The signals were acquired by a pH mV−1 meter (Unisense, Denmark) interfaced with a computer to record data. Microelectrodes were calibrated with three standard solutions before test.The biofilm samples were tested immediately after collected from the SBBR. Firstly, samples were placed on the nylon net, and submerged the biofilm sample by adding the effluent of SBBR to the chamber, which could maintain the biofilm samples in a natural state during measurement. Then, coarse adjustment and fine-tuning screw on the micromanipulator were used to locate microelectrode near the microelectrode biofilm surface. When the software (SensorTrace Basic) showed a steady baseline of ORP (floating values within ±0.01% range) at specific depth, which means that the ORP level at this depth was determinated. Then, the location of the microelectrode with the increasing movement of 100 μm was adjusted by screwing the coarse adjustment to measure internal micro potential profile at the different depths of biofilm samples.
2.6 Analysis
After the reactor operated stably, samples were taken daily. The concentrations of NH4+–N, total nitrogen (TN), PO43−–P, suspended solids (SS) and mixed liquid suspended solids (MLSS) were measured according to standard methods for the examination of water and wastewater.16 Total chemical oxygen demand (COD) was measured using DR 2800™ Spectrophotometer (HACH, USA). During each cycle, those indicators of the water phase were monitor by suitable submerged probes, such as DO (Hach, HQ30d, USA), pH (Hach, sension2, USA) and ORP (Hach, sension2, USA).The micro-fauna in the sludge was counted by direct observing under microscopes. The sludge sample firstly was separated into small flocs by shaking with physical rotary, and 10 μL of carboxymethyl cellulose CMC (2.5%) was added to limit the movement of miniature animals before counting with microscope.
3. Results and discussion
3.1 Effect of aeration modes on wastewater treatment efficiency
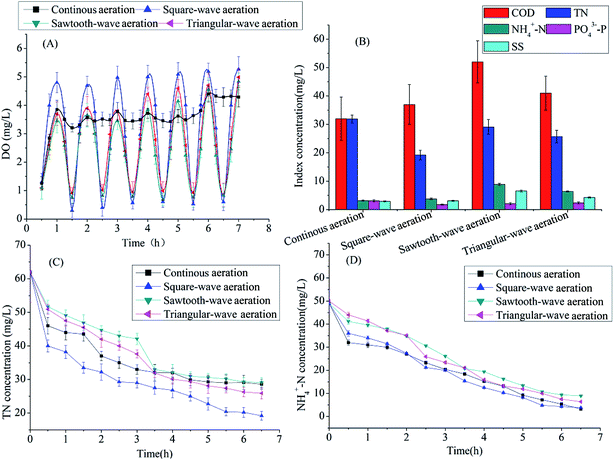
The effect of aeration modes on COD, NH4+–N, TN, PO43−–P and SS removal in 4 SBBRs were shown in Fig. 2. According to Fig. 2(b), all the systems showed significantly high SS removal rate above 90%. The COD concentration of the effluents in SBBRs with continuous aeration, square-wave aeration, sawtooth-wave aeration and triangular wave aeration were 32 mg L−1, 37 mg L−1, 52 mg L−1 and 41 mg L−1 respectively. And the effluent NH4+–N concentration were 3.2 mg L−1, 3.8 mg L−1, 8.9 mg L−1 and 6.4 mg L−1, respectively. No significant different removal efficiency of COD and NH4+–N were found in four SBBRs, except the SBBR with sawtooth-wave aeration showed a lower COD and NH4+–N removal rates. This could be explained by lower DO level (shown in Fig. 2(a)) in the system resulting in a smaller aerobic zone within biofilm and consequently lower substrate degradation. As shown in Fig. 2(a), at the beginning, DO concentration gradually increased, and oxygen transfer capacity was enhanced. Thus, aerobic micro-environment area within biofilm enlarged, and gradually aerobic bacteria became more active, which resulted in the organic substrates and NH4+–N removal. While the aeration stopped, DO decreased in the reactor because ongoing oxygen consumption by the microorganisms. Once the oxygen consumption rate was higher than the oxygen transfer rate, the anaerobic micro-environment within the biofilm formed.As shown in Fig. 2(c) and (d), TN and NH4+–N decreased throughout the operation cycle in all reactors, which indicated that the all the reactors realized the simultaneous nitrification and denitrification (SND). The limitation of oxygen diffusion could lead to the formation of aerobic, anoxic and anaerobic microenvironment in biofilms. Therefore, the microenvironment in SBBRs system was suitable for anaerobic bacteria like denitrification bacteria, and also suitable for aerobic bacteria including nitrite bacteria and nitrifying bacteria, which contributed to the simultaneous nitrification and denitrification.17 The higher TN removal with other aeration modes could be explained by strengthened denitrification during the non-aeration phase.
The different TN removal rates of were found in four SBBRs system. The SBBR with square-wave aeration showed the highest TN removal rate (69%), which indicated that the nitrifying and denitrifying bacteria was more effective than those in other SBBRs. The higher ORP level (Fig. 4(a)) with the continuous aeration enlarged the aerobic zone while decreased the anoxic zone within the biofilm, resulting in a lower TN removal rate (48.55%). Meanwhile, lower DO and ORP level and weaker nitrification led to 16% and 9% lower TN removal rate in systems with sawtooth-wave aeration mode and triangular-wave aeration mode than that in SBBR with square-wave mode, respectively.
3.2 Effect of aeration modes on sludge reduction
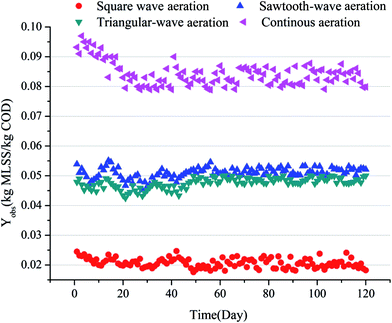
During the total 120 days stable operation, significantly different effects on the sludge production were observed in 4 SBBRs with different aeration modes. As shown in Fig. 3, SBBR with the square-wave aeration showed the lowest sludge yield rate, and the average observed sludge yield (Yobs) was around 0.021 mg MLSS/mg COD, which is 119%, 136% and 304% lower than the other 3 SBBRs with aeration modes of triangular-wave aeration, sawtooth-wave aeration and continuous aeration with average Yobs around 0.046 mg, 0.050 mg, 0.085 mg MLSS/mg COD, respectively.Under aerobic conditions, SBBR with the square-wave aeration showed the highest DO in bulk water. Higher DO in bulk water would facilitate more aerobic microenvironment within biofilm. When the air supply reduced, the DO in the liquid phase decreased gradually. At its lowest point, the DO in SBBR with the square-wave aeration was lower than the SBBRs with triangular-wave aeration and sawtooth-wave aeration. Lower DO in the liquid phase would facilitate more anaerobic microenvironment within biofilm. Therefore, SBBR with the square-wave aeration would be more favorable to induce the uncoupling metabolism phenomenon and realize sludge reduction. The changes of DO in SBBR with triangular-wave aeration were similar to SBBR with sawtooth-wave aeration and the approximate Yobs were observed in the 2 SBBRs.
It was implied by comparing the continuous aeration mode with other 3 aeration modes where the coupling of aerobic and anoxic condition exhibited much lower sludge yield, with about 4 times difference observed between the square-wave aeration (0.021 mg MLSS/mg COD) and continuous aeration (0.085 mg MLSS/mg COD) mode. This phenomenon demonstrated that the repeatedly coupling of aeration and non-aeration in SBBR was an effective process of in situ sludge reduction. In addition, the SBBR with square-wave aeration showed the highest TN removal rate. Square-wave aeration as a substitute for continuous aeration would be very meaningful.
3.3 The feasibility of using ORP as an indication
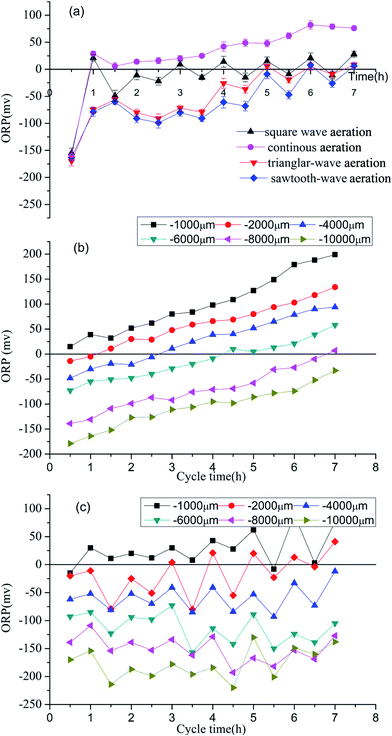
ORP is a comprehensive indication of the biochemical reactions occurring both in water phase and inside biomass. Some full-scale and pilot-scale studies have demonstrated that ORP can be used as an indication of pollutant removal in treatment plants, as well as for nitrification/denitrification and phosphorous removal in bulk wastewater.18 The feasibility of using ORP as an indication for in situ sludge reduction in SBBR system was investigated.Several researchers have suggested that an ORP range may result in decreased production of excess sludge.19,20 Greater ORP range more benefited to sludge reduction.21,22 As shown in Fig. 4, the variation law of bulk water ORP level in SBBR with square-wave aeration fluctuated with a greatest range than others. This ORP variation, mainly caused by DO fluctuation because of the repeated aeration and non-aeration, may directly affect the metabolism of the microorganism. SBBR with square-wave aeration showed the greatest ORP range and the lowest Yobs and the fluctuating ORP would be an effect way to indicate the sludge reduction performance.
This feasibility could also be demonstrated by comparing the variations of ORP level with time within the biofilms in SBBR system with continuous aeration and square-wave aeration. As shown in Fig. 4(b) and (c), the ORP level of different layers (≤10 mm) of biomass in system with square-wave aeration exhibited the similar fluctuation law, whereas the continuous aeration system showed steadily increasing ORP variation, which might also suggest the fluctuating ORP would indicate the sludge reduction performance.
In general, the aerobic conditions have an ORP value higher than +50 mV, the anoxic conditions have an ORP value up to −150 mV and anaerobic conditions have an ORP value below −150 mV.14 At the end of cycle, SBBR system with continuous aeration showed higher ORP (−50–200 mV) and above 60% microenvironment was aerobic conditions within the biofilms. There was no significant increase of ORP in SBBR with square-wave aeration and above 90% microenvironment was anoxic conditions within the biofilms at the end of cycle. Lower OPR was in favor of extracellular polymer substances dissociation and sludge reduction.23,24 At the same time, more anoxic microenvironment also contributed to denitrifying and higher TN removal rate in the system.
3.4 Mechanism discussion
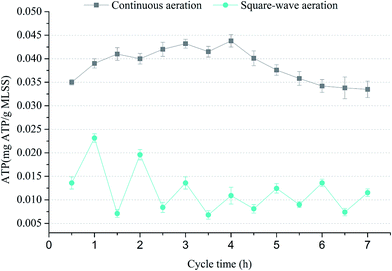
As shown in Fig. 5, the ATP variations during typical cycle in two SBBR systems: SBBR with continuous aeration mode and SBBR with square-wave aeration mode were compared. ATP level in SBBR system with square-wave aeration was about 60% lower than that in SBBR system with continuous aeration, which proved that ATP synthesis was inhibited in SBBR system with square-wave aeration and the metabolism uncoupling might be induced successfully by the alternative anoxic and aerobic environment. At the anoxic stages, microorganisms were driven towards maintaining metabolism and ATP level was low due to insufficient electron acceptors (e.g., oxygen), during followed aerobic stage, bacteria preferentially replenished intracellular energy stores instead of synthesizing new cells, resulting in the sludge reduction.
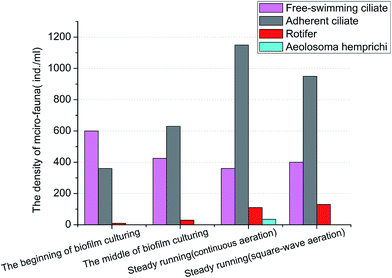
The density of rotifer increased from very few at the beginning of biofilm culturing to almost 110 ind. per mL in stable SBBR system with continuous aeration. In addition, the Aeolosoma hemprichi, known as omnivorous metazoan and demonstrated to be feasible to reduce sludge in wastewater treatment,27 was observed in SBBR system with continuous aeration with density around 35 ind. per mL, which implied the system the food chain was extended and consolidated and promoted the sludge reduction in SBBR with continuous aeration.
However, the decrease of density of adherent ciliate and the absence of Aeolosoma hemprichi proved that the micro-fauna predation was not strengthened in the SBBR system with square-wave aeration. Therefore, the performance difference between conventional SBBR and the modified in situ sludge reduction SBBR could mainly be caused by the uncoupling metabolism induced by modified aeration mode instead of the micro-fauna predation.
4. Conclusions
The modification of the aeration modes successfully achieved the in situ sludge reduction in SBBR. System with the square-wave mode showed lowest Yobs only 0.021 mg MLSS/mg COD. Simultaneously, the wastewater treatment efficiency was enhanced, with the total nitrogen removal rate of 69%, which was 20% higher than that in system compared with continuous aeration. Using ORP as an indication was feasible for in situ sludge reduction in SBBR. The significant difference of sludge reduction between conventional SBBR and the modified in situ sludge reduction SBBR could be mainly caused by the uncoupling metabolism induced by modified aeration mode instead of the micro-fauna predation.Acknowledgements
This work was financially supported by the National Science and Technology Major Project for Water Pollution Control and Remediation of China (2008ZX07315-004).References
- J. L. Campos, L. Otero, A. Franco, A. Mosquera-Corral and E. Roca, Bioresour. Technol., 2009, 100, 1069–1073 CrossRef CAS PubMed.
- S. S. Yang, W. Q. Guo, X. J. Zhou, Z. H. Meng, B. Liu and N. Q. Ren, Bioresour. Technol., 2011, 102, 9843–9851 CrossRef CAS PubMed.
- T. Mahmood and A. Elliott, Water Res., 2006, 40, 2093–2112 CrossRef CAS PubMed.
- F. Quan, Y. Anfeng, C. Libing, C. Hongzhang and X.-H. Xing, Biochem. Eng. J., 2012, 67, 45–51 CrossRef CAS.
- G. U. Semblante, F. I. Hai, H. H. Ngo, W. Guo, S. J. You, W. E. Price and L. D. Nghiem, Bioresour. Technol., 2014, 155, 395–409 CrossRef CAS PubMed.
- W. Q. Guo, S. S. Yang, W. S. Xiang, X. J. Wang and N. Q. Ren, Biotechnol. Adv., 2013, 31, 1386–1396 CrossRef CAS PubMed.
- E. W. Low, H. A. Chase, M. G. Milner and T. P. Curtis, Water Res., 2000, 34, 3204–3212 CrossRef CAS.
- E. W. Low and H. A. Chase, Water Res., 1999, 33, 1119–1132 CrossRef CAS.
- F. Fang, H. L. Hu, M. M. Qin, Z. X. Xue, J. S. Cao and Z. R. Hu, Bioresour. Technol., 2015, 185, 1–6 CrossRef CAS PubMed.
- X. C. Feng, W. Q. Guo, C. Chen, S. S. Yang, W. B. Jin, N. Q. Ren, H. S. Zheng, J. S. Du and B. Liu, Bioresour. Technol., 2013, 143, 642–646 CrossRef CAS PubMed.
- S. Rodriguez-Perez and F. G. Fermoso, Bioresour. Technol., 2016, 200, 170–177 CrossRef CAS PubMed.
- N. Yagci, J. T. Novak, C. W. Randall and D. Orhon, Bioresour. Technol., 2015, 193, 213–218 CrossRef CAS PubMed.
- E. Zuriaga-Agusti, J. A. Mendoza-Roca, A. Bes-Pia, J. L. Alonso-Molina and I. Amoros-Munoz, J. Environ. Manage., 2016, 182, 406–411 CrossRef CAS PubMed.
- G. U. Semblante, F. I. Hai, H. H. Ngo, W. S. Guo, S. J. You, W. E. Price and L. D. Nghiem, Bioresour. Technol., 2014, 155, 395–409 CrossRef CAS PubMed.
- J. Wang, X. X. Li, W. C. Fu, S. H. Wu and C. Li, Bioresour. Technol., 2012, 126, 142–147 CrossRef CAS PubMed.
- APHA, Standard methods for the examination of water and wastewater, American Public Health Association, Washington, DC, USA, 2005 Search PubMed.
- J. Hou, G. You, Y. Xu, C. Wang, P. Wang, L. Miao, Y. Ao, Y. Li and B. Lv, Bioresour. Technol., 2015, 191, 73–78 CrossRef CAS PubMed.
- B. Li and P. L. Bishop, Water Res., 2004, 38, 1248–1258 CrossRef CAS PubMed.
- S. Ip, J. Bridger and N. Mills, Water Sci. Technol., 1987, 19, 911–918 CAS.
- S. A. McClintock, J. H. Sherrard, J. T. Novak and C. W. Randall, J.–Water Pollut. Control Fed., 1988, 342–350 CAS.
- S. Saby, M. Djafer and G. H. Chen, Water Res., 2003, 37, 11–20 CrossRef CAS PubMed.
- G. H. Chen, K. J. An, S. Saby, E. Brois and M. Djafer, Water Res., 2003, 37, 3855–3866 CrossRef CAS PubMed.
- K. X. Li, Y. Wang, Z. P. Zhang and D. F. Liu, Water Sci. Technol., 2014, 69, 2139–2146 CrossRef CAS PubMed.
- Z. Zhou, W. M. Qiao, C. Xing, Y. J. Wang, C. Y. Wang, Y. F. Wang, Y. R. Wang and L. C. Wang, Water Sci. Technol., 2014, 69, 934–940 CrossRef CAS PubMed.
- Y. Wei, R. T. Van Houten, A. R. Borger, D. H. Eikelboom and Y. Fan, Water Res., 2003, 37, 4453–4467 CrossRef CAS PubMed.
- C. S. Elton, Animal ecology, University of Chicago Press, 2001 Search PubMed.
- P. Liang, X. Huang and Y. Qian, Biochem. Eng. J., 2006, 28, 117–122 CrossRef CAS.
| This journal is © The Royal Society of Chemistry 2017 |

