 Open Access Article
Catalytic oxidation of organic pollutants in wastewater via a Fenton-like process under the catalysis of HNO3-modified coal fly ash
Nannan Wang a,
Qiang Zhaob and
Aili Zhang*c
aSchool of Mechanical Engineering, Beijing Institute of Petrochemical Technology, Beijing 102617, PR China. E-mail: wnn_flying@163.com
bBeijing BHT Environment Technology Co., Ltd, Beijing 100102, PR China
cSchool of Environmental Science and Technology, Dalian University of Technology, Dalian 116024, PR China. E-mail: zal58@163.com
First published on 24th May 2017
Abstract
The performance of acid-modified coal fly ash (CFA) was tested for use as a catalyst of a Fenton-like process in p-nitrophenol (p-NP) wastewater treatment. The results show that HNO3-modified coal fly ash (HFA) has a better catalytic capacity (96.6% p-NP removal rate) than those (<92% p-NP removal rate) of CFA modified by other acids (HCl, H2SO4, and H3PO4). The removal rate of the p-NP by the adsorption of HFA is less than 2.96%, which can be thought of as negligible compared to that removed by the catalytic oxidation process. Under the optimum experimental conditions (reaction time = 60 min, CH2O2 = 170 mg L−1, CHFA = 10.0 g L−1, pH = 2.0, mixing speed = 150 rpm, and temperature = 25 °C), a 98% p-NP removal rate is observed. HFA has an acute response to the change of temperature and higher temperature is welcomed (9.3% and 98% of the p-NP was removed at 25 and 50 °C, respectively, at 5 min). HFA can be reused 9 times with >91% of the p-NP removal rate, revealing an outstanding catalytic stability and reusability. The catalytic mechanism of HFA was discussed by comparing the physicochemical features of HFA with raw CFA and by proposing the reactions which occur in the Fenton-like process.
1. Introduction
In recent years, significant progress in treating refractory wastewater has been achieved by the application of advanced oxidation processes (AOPs). A common feature of AOPs is the generation of hydroxyl radicals (˙OH), which can decompose refractory organics effectively due to their strong oxidising ability (E0 = 2.8 V). The Fenton process, as a classic AOP, can generate ˙OH via the reaction of Fe2+ with H2O2. The reactions that occur in the Fenton process can be described as follows:1–3| Fe2+ + H2O2 → Fe3+ + OH− + ˙OH | (1) |
| Fe3+ + H2O2 → Fe2+ + HO2˙ + H+ | (2) |
| Fe2+ + ˙OH → Fe3+ + OH− | (3) |
| H2O2 + ˙OH → H2O + HO2˙ | (4) |
| ˙OH + ˙OH → H2O2 | (5) |
| ˙OH + organics → intermediates → inorganics | (6) |
Although the Fenton process can oxidize a wide variety of organics, and is even be able to destroy them to produce carbon dioxide (CO2), water (H2O) and inorganic salts (eqn (6)), the recycling of the catalyst (Fe2+) cannot be easily achieved, leading to the generation of sludge containing Fe ions. The treatment of the sludge is expensive in terms of labour, reagents, and time, and is complex in operation. Thus, exploring a novel solid catalyst that can be used in heterogeneous Fenton-like processes is necessary.
Coal fly ash (CFA) is produced from steel mills and coal-fired power plants. Over 300 billion tons of CFA is produced every year in the world.4 Even now, CFA is still mainly treated by means of landfill, causing severe environmental pollution because of the leaching of the metallic elements that are contained in CFA. Thus, proper treatment of CFA is required. Over the years, many studies5–14 have revealed that pre-treated CFA can be used as an effective low-cost adsorbent for the removal of organic and inorganic metallic elements (such as arsenic, nickel, calcium, copper, iron and manganese ions) in wastewater. However, the catalytic property of CFA has not attracted enough attention and just a small number of studies15–17 have been conducted until now. Reassuringly, these studies show that the application of pre-modified CFA as a heterogeneous catalyst could have enormous potential due to the existence of transition metal oxides. The modification of CFA can be achieved by acid modification, alkali modification, and thermal modification.18–20 However, alkali modification and thermal modification can introduce alkaline substances and destroy the space structure of CFA, respectively, which have adverse effects on the catalytic capacity of a catalyst. Therefore, acid modification is always used to prepare the target catalyst.
The contamination of aquatic environments by chemical pollutants has been a major issue in recent years. p-Nitrophenol (p-NP) is typically one of the most refractory substances that is present in industrial wastewater, due to its high solubility and stability in water. p-NP exists in wastewater from a number of industries, such as textiles, paper and pulp, plastics etc., and is considered to be a hazardous chemical pollutant. The use of p-NP has been seriously controlled by the U.S. Environmental Protection Agency.21 The maximum allowed concentration in water is in the range 1–20 ppb. Hence, its removal from industrial effluents is an important practical problem.
In this paper, in order to promote the application of CFA, a comprehensive study about CFA modification using HNO3 (HFA) was conducted and its catalytic capacity was investigated by catalysing a heterogeneous Fenton-like process to degrade p-NP in wastewater. Firstly, the preparation conditions of HFA were optimized after choosing HNO3 as the proper acid in the modification, and then the removal kinetics of p-NP in wastewater were investigated. After that, the reusability and stability of HFA were tested. Finally, the catalytic mechanism of HFA was proposed based on the investigation of (I) the effect of the HFA adsorption capacity, (II) a comparison of the chemical and physical features of HFA with those of CFA, and (III) the possible reactions that occur on the surface of HFA and in the solution.
2. Materials and methods
2.1 Chemicals and reagents
p-NP (analytical grade) was purchased from Tianjin Kermel Chemical Reagent Co., Ltd., China and was used without any further purification. The p-NP wastewater (100 mg L−1) was prepared directly by diluting solid p-NP into distilled water. The hydrogen peroxide (H2O2) (30%, w/w), sodium hydroxide (NaOH), nitric acid (HNO3), sulphuric acid (H2SO4), hydrochloric acid (HCl), and phosphoric acid (H3PO4) that were used in this work were of analytical grade. H2O2 was used directly without dilution. NaOH and different acids were dissolved and diluted, respectively, with distilled water to achieve the target concentrations. The CFA that was used was purchased from a coal-fired power plant in China (source not revealed due to a confidentiality agreement).2.2 Preparation of HFA
Due to the existence of some impurities (such as fibers and alkaline substances) on its surface, the CFA was first washed repeatedly and adequately with distilled water before modification until the pH of the supernatant was equal to the pH value of distilled water. The loading of CFA in distilled water was 10.0 g L−1. We used adequate agitation to promote the washing quality. After 12 h, the mechanical agitation was stopped and the mixture was precipitated and separated. After the washing, the washed CFA was dried at 105 °C until the weight did not change.During the stage of modification, the washed-dried CFA was soaked in a 1 mol L−1 HNO3 solution (CFA loading = 25 g L−1). The mixture was stirred using a magnetic stirrer (350 rpm) for 4 h. Subsequently, the mixture was precipitated by gravity, layered, and filtered using a vacuum filter. The solid that was obtained after the filtration was dried at 105 °C until the weight stayed constant. The CFA obtained after the above processes (i.e., HFA) was stored in a drying basin for the following experiments.
2.3 Treatment procedure of p-NP wastewater
100 mL of p-NP solution (100 mg L−1) with a pH pre-adjusted using NaOH and HNO3 was prepared in a beaker (500 mL), and the temperature of the solution was controlled using a water bath. After the temperature reached the determined value (±1 °C), a certain amount of HFA was added into the solution and mixed using a mechanical agitator. The wastewater treatment started as soon as H2O2 was added into the beaker.During the reaction, the mixture was sampled at specific time intervals. Meanwhile, the NaOH solution was added into the sample immediately to stop the catalytic oxidation process. All of the samples were filtrated using a vacuum pump and the filtrate was analysed to determine the concentration of the residual p-NP.
In the study of the reusability and stability of the HFA, the solid that was separated from the treated wastewater was washed using distilled water and dried until a constant weight was achieved at 105 °C. After that, the used HFA was reused again until the removal efficiency of p-NP had an obvious decrease.
For the investigation of the adsorption effect of the HFA, the adsorption isotherm was measured under fixed experimental conditions (the reaction temperature was 25 °C, the reaction time was 60 min, which is long enough to reach to the adsorption equilibrium, the pH was 2.0, the HFA loading was 10.0 g L−1, and the Vp-NP value was 100 mL) while only the p-NP concentration changed (1, 3, 7, 10, 15, 20, 30, 40, 50, 60, 70, 80, and 90 mg L−1). The maximum adsorption capacity of the HFA was obtained from the adsorption isotherm.
2.4 Characterization of HFA
The surface morphology of CFA and HFA was measured using a BET (Brunauer–Emmett–Teller) automated analyser (QUADRASORB). The analysis gas, outgas time and outgas temperature were nitrogen, 5.0 h and 300 °C, respectively.The chemical composition of CFA and HFA was determined using X-ray fluorescence spectroscopy (XRF-1800). The maximum pipe pressure, maximum current, scanning speed, the temperature of the spectrum chamber, and power were 40 kV, 90 mA, 20° min−1, 30 ± 0.1 °C, and 36 kW, respectively.
The morphology of the samples was analysed using scanning electron microscopy (SEM, JEOL, Japan) with an acceleration voltage of 15 kV and a current of 2 × 10⁻¹¹ A. The ambient temperature and humidity were 16 °C and 60%, respectively.
The crystal structure of the samples was determined using X-ray diffraction (XRD) (Bruker, Germany) at room temperature with monochromatic high-intensity Cu Kα radiation (l = 1.5406 Å), an accelerating voltage of 40 kV and an emission current of 30 mA. The scanning range of 2θ and the scanning speed were 10–70° and 4° min−1, respectively.
2.5 Analytical methods
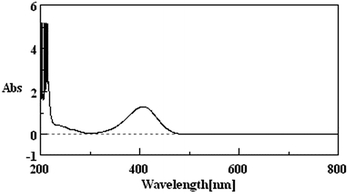
Due to the fact that p-NP has its maximum UV-vis absorption peak at 400 nm at pH > 11 (Fig. 1), the concentration of the residual p-NP in wastewater after the treatment was measured using a UV-vis spectrophotometer (JASCO V-560, Japan) under the above conditions. The removal rate of p-NP was calculated by:| Removal rate (%) = (C0 − Ct)/C0 × 100% | (7) |
3. Results and discussion
3.1 Effect of the acid type
Some studies22–25 show that the acid type has an effect on the catalytic capacity of HFA. In this work, four different acids (HNO3, HCl, H2SO4 and H3PO4) were chosen and tested. The results are given in Table 1. We can see that the CFA modified by H3PO4 has the worst performance in the catalytic degradation of p-NP (87.9% for the p-NP removal rate) while the HNO3-modified CFA has the best catalytic capacity (96.6% for the p-NP removal rate). Additionally, the CFA modified by HCl and H2SO4 has intermediate performance.| Type of HFA | Removal rate of p-NP/% |
|---|---|
| HNO3-activated CFA | 96.6 |
| HCl-activated CFA | 91.4 |
| H2SO4-activated CFA | 90.4 |
| H3PO4-activated CFA | 87.9 |
The difference could be caused by the different ionization equilibrium constants (calculated using eqn (8) and (9)) of the acids and the corresponding calcium salt.
| HIn ↔ H+ + In− | (8) |
 | (9) |
H2SO4 molecules can ionize completely and generate H+ and HSO4−. The Ka value of HSO4− is equal to 1.02 × 10⁻² at 25 °C (Table 2). By comparison, H3PO4 ionizes partially and the three equilibrium constants (7.11 × 10⁻³, 6.23 × 10⁻⁸, and 4.50 × 10⁻¹³) are much lower than those of H2SO4 (a strong electrolyte) and HSO4− (a weak electrolyte). Thus, the acid modification using H3PO4 is weaker than that using H2SO4 because of the lower H+ concentration in the H3PO4 solution.
| Type of acid | Ka1 | Ka2 | Ka3 |
|---|---|---|---|
| H2SO4 | — | 1.02 × 10⁻² | — |
| H3PO4 | 7.11 × 10⁻³ | 6.23 × 10⁻⁸ | 4.50 × 10⁻¹³ |
During the H2SO4 modification, the generated CaSO4 and Ca(HSO4)2 are weak electrolytes and can cover the surface of HFA. In contrast, the CaCl2 and Ca(NO3)2 can completely dissolve in water with no possibility of covering the surface of HFA. This could be the reason that the H2SO4-modified CFA has a weak catalytic capacity compared to that of HNO3 and HCl-modified CFA.
As for the HCl and HNO3 modification, both of the two acids and the corresponding calcium salts are strong electrolytes, and the “cover effect” cannot occur. The difference in the catalytic capacity of HNO3-modified and HCl-modified CFA still needs further study.
3.2 Optimization of the influencing factors on Fenton-like processes and the proposed degradation product of p-NP
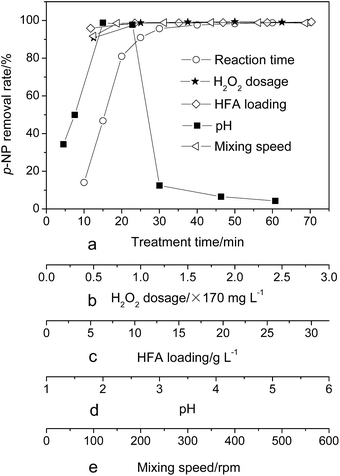
Previous studies26,27 show that the variation of the treatment time, H2O2 dosage, catalyst loading, wastewater pH and mixing speed have an effect on the treatment efficiency of wastewater. Therefore, they were investigated in detail in this work. Fig. 2 shows the effect of the above parameters on the removal rate of p-NP. We can see that the H2O2 dosage, HFA loading and mixing speed have a similar effect on the p-NP removal rate, namely, insufficient H2O2 dosage, HFA loading and/or mixing speed could cause the decrease of the removal rate of p-NP. The removal rate reaches a plateau when the H2O2 dosage, HFA loading and mixing speed reach the critical point (H2O2 dosage = 170 mg L−1, HFA loading = 10.0 g L−1 and mixing speed = 150 rpm). It is economical to set the three critical points as the optimum values to achieve the best p-NP removal efficiency simultaneously.The treatment time and pH have a distinct effect on the removal rate of p-NP. For the reaction time, the p-NP removal rate firstly rapidly rises and then reaches a plateau after 60 min. For the pH, the p-NP removal rate has its highest value at pH = 2, and a lower or higher pH has a negative effect on the effective treatment of wastewater.
According to the statement above, we can pick the optimum experimental conditions, i.e., reaction time = 60 min, H2O2 dosage = 170 mg L−1, HFA loading = 10.0 g L−1, pH = 2.0, and mixing speed = 150 rpm. In this situation, the removal rate of p-NP is no less than 98%.
The results in some previous studies28–30 show that the addition of an organic acid is helpful to increase the degradation of the pollutants. Because citrate and oxalate are typical in these kinds of studies,26 the effects of citrate (0.5 mmol L−1) and oxalate (0.5 mmol L−1) on the removal rate of p-NP were investigated, under the optimal experimental conditions that are given above. We find that the addition of an organic acid can decrease the removal rate of p-NP from 98% (without adding the organic acid) to 71.8% (adding citrate) and 77.6% (adding oxalate). This result is different from those of some studies.28–30
The experimental conditions used in these cited papers28–30 are different from ours, i.e., all of the studies in the cited papers are carried out under the irradiation of light (ultraviolet or visible light), which can obviously promote iron redox cycling by the reaction of FeIII–L + hν → FeII + L+.26
In our study, we do not apply the photo-Fenton process, so the redox cycling of iron cannot occur. Instead, the active sites of HFA are occupied and a portion of the ˙OH radicals is consumed competitively by the organic acid.
The degradation product/path of p-NP has been previously investigated in some studies.31–33 From these studies, we can find the analogous degradation path of p-NP. Hydroquinone (HQ) and 4-nitrocatechol (4-NC) can always be produced by the attack of ˙OH on the nitro-group of p-NP and the entering of ˙OH to the ortho position of p-NP. Meanwhile, the two products (HQ and 4-NC) can react with ˙OH to form 1,2,4-benzenetriol (1,2,4-BT).31,32 Further reaction of 1,2,4-BT with ˙OH can generate some chain organic compounds, such as maleic acid, fumaric acid, oxalic acid and formic acid, by opening the ring.32 These chain compounds can be oxidized further by ˙OH as well to carbon dioxide and, eventually, water.
3.3 Kinetics of p-NP degradation
The hydroxyl radical, as the strong oxidative radical, can be generated in heterogeneous Fenton-like processes and attack p-NP molecules as shown in eqn (10).
 | (10) |
Its kinetics procedure can be characterized using:
 | (11) |
Assuming the concentration of ˙OH remains constant, eqn (11) becomes:
 | (12) |
Therefore,
 | (13) |
 versus time graph.
![[thin space (1/6-em)]](https://www.rsc.org/images/entities/char_2009.gif) :
:![[thin space (1/6-em)]](https://www.rsc.org/images/entities/char_2009.gif) 14, under which p-NP can be mineralized completely by H2O2, i.e., 10 mmol L−1 (340 mg L−1) H2O2 is needed for the purpose of oxidizing 0.719 mmol L−1 (100 mg L−1) p-NP to CO2 and H2O2 completely.
14, under which p-NP can be mineralized completely by H2O2, i.e., 10 mmol L−1 (340 mg L−1) H2O2 is needed for the purpose of oxidizing 0.719 mmol L−1 (100 mg L−1) p-NP to CO2 and H2O2 completely.| C6H5NO3 + 14H2O2 → 6CO2 + 16H2O + HNO3 | (14) |
Taking the cost of treating wastewater into consideration, 340 mg L−1 was used as the maximum concentration and 85–340 mg L−1 was chosen for investigating the effect of H2O2. As shown in Fig. 3, the degradation of p-NP accords with the pseudo-first order kinetics and the degradation rate constant increases from 0.041 min−1 to 0.116 min−1 with the increase of H2O2 dosage from 85 mg L−1 to 340 mg L−1 (Table 3). In this situation, the maximum removal rate of p-NP can reach 98% within 30 min at a 340 mg L−1 H2O2 dosage.
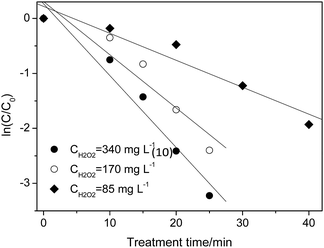 | ||
| Fig. 3 Effect of H2O2 dosage on the p-NP degradation kinetics (Cp-NP = 100 mg L−1, T = 25 °C, CHFA = 10.0 g L−1, and pH = 2.0). | ||
| [H2O2]/mg L−1 | 340 | 170 | 85 |
| kap/min−1 | 0.116 | 0.080 | 0.041 |
According to the literature,35,36 the H2O2 dosage should have an appropriate range. When the H2O2 dosage is excessive, the degradation rate of p-NP would decrease with the increase of the H2O2 dosage. This could be attributed to the reaction of ˙OH with H2O2 and the reaction of two ˙OH radicals (see eqn (4) and (5)). Both of the two side reactions inhibit the effective utilization of H2O2 and the rapid oxidation of p-NP.
When the H2O2 dosage is deficient (85 mg L−1), the removal rate of p-NP would have an obvious decrease due to the insufficiency of the oxidizing reagent (˙OH). The results in this work are in good agreement with the results in the previous studies.37–39
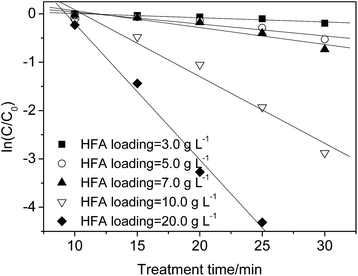 | ||
| Fig. 4 Effect of HFA loading on the p-NP degradation kinetics (Cp-NP = 100 mg L−1, T = 25 °C, pH = 2.0, and CH2O2 = 170 mg L−1). | ||
| HFA loading/g L−1 | 3.0 | 5.0 | 7.0 | 10.0 | 20.0 |
| kap/min−1 | 0.006 | 0.025 | 0.041 | 0.138 | 0.236 |
The experimental results in this work show that 97% of the p-NP is removed when the HFA loading is 20.0 g L−1 at 25 min, while 95.3% p-NP removal rate is achieved with an HFA loading of 10.0 g L−1 at 30 min. Within a similar reaction time approximately the same removal rate of p-NP is achieved at 10.0 and 20.0 g L−1 of HFA loading. Comparing the results of those that used 10.0 g L−1 with those that used 20.0 g L−1, the doubled loading of HFA (20.0 g L−1) increased not only the usage amount of HFA, but it also doubled every factor during the preparation of HFA, including, but not limited to: the workload, working hours, and raw materials.
Thus, although increasing the HFA loading can theoretically accelerate the removal rate of p-NP, it must be controlled properly in practical applications. In this work, an HFA loading of 10.0 g L−1 with a degradation rate constant of p-NP of 0.138 min−1 is enough, and increasing the HFA loading further cannot increase the wastewater treatment efficiency obviously any more, but it does raise the treatment costs dramatically.
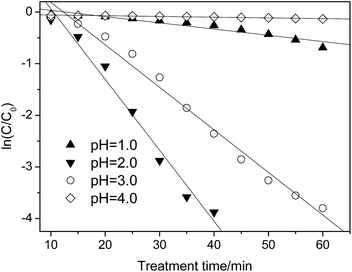 | ||
| Fig. 5 Effect of pH on the p-NP degradation kinetics (Cp-NP = 100 mg L−1, CH2O2 = 170 mg L−1, CHFA = 10.0 g L−1, and T = 25 °C). | ||
| pH | 1.0 | 2.0 | 3.0 | 4.0 |
| kap/min−1 | 0.007 | 0.138 | 0.002 | — |
When the pH is lower or higher than 2.0, the value of kap decreases sharply, i.e., kap = 0.007 versus pH = 1.0 and kap = 0.002 versus pH = 3.0 (Table 5). In this situation, only 44% (pH = 1.0)/12.5% (pH = 3.0) of the p-NP is removed after 60 min. By comparison, controlling the pH at pH = 2.0 is better in the case of pursuing a higher removal efficiency of p-NP.
When the pH increases from 2.0, the oxidation ability of the heterogeneous Fenton-like process decreases due to deactivation of the ferrous ions. At a lower pH range (pH = 1.0), H2O2 could be stabilized to H3O2+, as shown in eqn (15), which can decrease the production rate of ˙OH indirectly.43 In addition, the scavenging effect of ˙OH by H+ becomes obvious as well (eqn (16)), which decreases the effective concentration of ˙OH.44
| H2O2 + H+ → H3O2+ | (15) |
| ˙OH + H+ + e− → H2O | (16) |
In light of the above results, the HFA has a sensitive response to a change in temperature. This feature is beneficial for the treatment of wastewater with a higher temperature than room temperature. The determination of specific degradation kinetics of p-NP within 5 min can be realized by online detection in later work. The previous studies45,46 considered the effect of the temperature as well, but not adequately. Considering the results in this work, a detailed study of the influence of the temperature on the catalytic capacity of modified CFA is necessary.
3.4 Reusability and stability of HFA
For the heterogeneous Fenton-like process, evaluating the reusability and stability of the catalyst is significant for the purpose of industrial implementation because it is related to the cost of the wastewater treatment. The results in this study reveal that the pH has a remarkable effect on the dissolution of Fe due to the reaction of iron oxide on the surface of HFA with H+ in the solution. Considering the fact that the catalytic capacity of HFA is mainly from the Fe element,4,15 the loss/leaching of Fe from the surface of HFA will definitely affect the reusability and stability of HFA and then, inevitably, it will further affect the treatment efficiency of organic wastewater.The reusability of the HFA was evaluated under the reaction conditions of HFA (20.0 g L−1), H2O2 (170 mg L−1), p-NP (100 mg L−1), pH 2.0 and a temperature of 25 °C. The catalytic behaviour of HFA was tested in 14 consecutive experimental runs. As shown in Fig. 6, we can see that the catalytic capacity of HFA in the first nine runs does not obviously decline and the removal rate of p-NP stays >91%. From the tenth run, the catalytic capacity starts to reduce. Thus, HFA can be considered as a stable catalyst for the first nine runs of application.
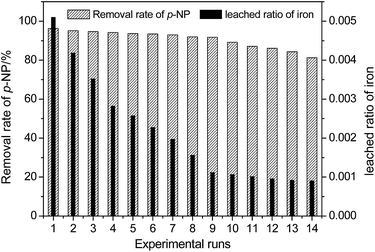 | ||
| Fig. 6 Reusability and stability of the HFA catalyst for the degradation of p-NP (Cp-NP = 100 mg L−1, pH = 2.0, CH2O2 = 170 mg L−1, T = 25 °C, CHFA = 20.0 g L−1, and time = 20 min). | ||
We can observe that the removal rate of p-NP in Fig. 6 did not decrease significantly with the leaching of Fe into the wastewater, which could be caused by the combined action of heterogeneous and homogeneous catalysis as discussed below.
In addition, this also indicates that heterogeneous catalysis could play a more important role than homogeneous catalysis because the leached ratio of Fe became smaller and smaller with the reuse of HFA revealing that there was less and less dissolved Fe in solution with repeated usage (Table 6).
| Experimental runs | 1 | 2 | 3 | 4 | 5 | 6 | 7 | 8 | 9 | 10 | 11 | 12 | 13 | 14 |
| [Fe2+]/mg L−1 | 0.41 | 0.33 | 0.28 | 0.22 | 0.20 | 0.18 | 0.15 | 0.12 | 0.09 | 0.08 | 0.08 | 0.07 | 0.06 | 0.05 |
Compared to previous studies,47–49 the modified CFA catalyst (i.e., HFA) is more stable and reusable than the catalysts in other studies, which can be reused 6 times,47 3 times48 and 4 times.49
The slow decay of the catalytic capacity of HFA contributes to the loss of active sites displayed in the form of Fe2O3 on the surface of the HFA. As for the catalytic capacity of other metal oxides, such as Al2O3, these still need to be further studied individually. In this test, the leaching of Fe (right Y axis in Fig. 6) from the surface of HFA to solution causes a severe loss of active sites even though the leached ratio of iron always decreases in the consecutive experimental runs (from 0.0051 to 0.0009).
3.5 Catalytic mechanism of the HFA catalyzed Fenton-like process
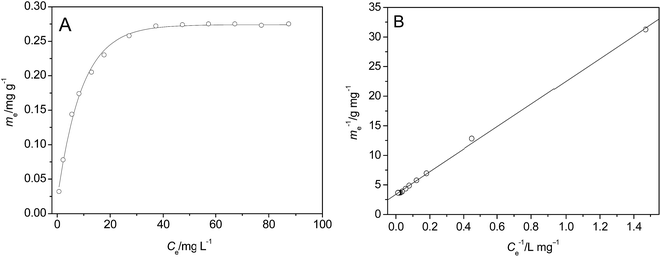 | ||
| Fig. 7 Adsorption isotherms of p-NP on the surface of HFA (A) and the fitting of the data using Langmuir model (B) (T = 25 °C, t = 60 min, pH = 2.0, CHFA = 10.0 g L−1, and Vp-NP = 100 mL). | ||
The line in Fig. 7B was fitted using a Langmuir model (eqn (17)):
 | (17) |
We can calculate from Fig. 7B that ms = 0.296 mg g−1 and K = 0.1769 L mg−1. Assuming Cp-NP = 100 mg L−1, Vp-NP = 100 mL and HFA loading = 1.0 g, under these conditions the maximum adsorption amount of p-NP by HFA is 0.296 mg in theory, accounting for 2.96% of the total amount of p-NP in the 100 mL solution. Actually, with the passage of reaction time, the p-NP concentration decreases continuously, and so the adsorption amount of p-NP cannot reach a final value of 0.296 mg. This actual amount is so little compared to the amount that was removed by oxidation that the adsorption processes can be thought of as negligible.
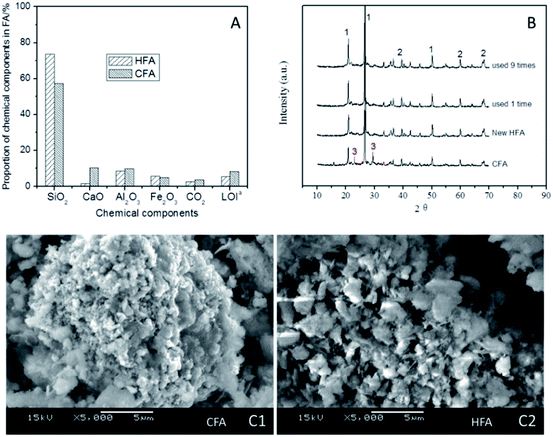
Some studies50–53 show that acidic conditions are appropriate in Fenton/Fenton-like processes; a higher pH could result in a remarkable reduction of the treatment efficiency of organic wastewater. Therefore, the elimination of CaO from CFA is necessary because the dissolution of CaO in water can lead to an obvious increase in the pH by generating CaOH. As shown in Fig. 8A, the proportion of CaO reduced to 1.6% (HFA) from 10.3% (CFA), indicating that the modification of CFA removed most of the CaO. This result is confirmed by the XRD results (Fig. 8B). We can see from Fig. 8B that all of the samples have peak 1 and peak 2 in their spectra, which are the peaks of quartz and mullite, respectively. However, the new and reused HFA lack peak 3, which represents CaO.
Additionally, the mass fraction of Fe2O3 and the LOI changed as well. As shown in Fig. 8A, the HNO3 modification does not decrease the proportion of Fe2O3, but increases it (from 4.9% to 5.7%), which is helpful for increasing the catalytic capacity of the HFA. The LOI is the index of organics that are not burned completely during the burning. The carbon particles included in the LOI can cover the surface of the active sites of HFA and then decrease the catalytic capacity. The HNO3 modification decreased the LOI proportion from 8.2% to 5.5%, and this actually “increases” the number of active sites by reducing the cover area of the carbon particles.
Besides the comparison of the chemical components, an investigation of the physical features of HFA and CFA was conducted as well. The results show that both the specific surface area and pore volume of CFA are increased from 11.9 m2 g−1 (CFA) to 30.0 m2 g−1 (HFA) and from 61.7 μL g−1 (CFA) to 68.0 μL g−1 (HFA), respectively. This result is confirmed qualitatively by the SEM images (Fig. 8C). From Fig. 8C1 we can see that the morphology of CFA is presented as a bulk structure while the HFA in Fig. 8C2 shows a honeycomb structure. This reflects the increase of the specific surface area and pore volume visually.
The above changes have important implications on the increase in the adsorption capacity and the extension of the adsorption time, which is critical to the surface catalytic oxidation of organic pollutants (see Section 3.5.3).
![[triple bond, length as m-dash]](https://www.rsc.org/images/entities/char_e002.gif) FeIII) can be reduced to ferrous ions via reactions (18)–(20), and then ˙OH is generated subsequently on the surface of HFA through reaction (21). During the reaction, p-NP can be adsorbed on the surface of HFA (s-HFA) (eqn (22)) and oxidized by ˙OH directly (eqn (23)) without needing to spread into the solution.
FeIII) can be reduced to ferrous ions via reactions (18)–(20), and then ˙OH is generated subsequently on the surface of HFA through reaction (21). During the reaction, p-NP can be adsorbed on the surface of HFA (s-HFA) (eqn (22)) and oxidized by ˙OH directly (eqn (23)) without needing to spread into the solution.
![[triple bond, length as m-dash]](https://www.rsc.org/images/entities/char_e002.gif) FeIII + H2O2 ↔ FeIII + H2O2 ↔ ![[triple bond, length as m-dash]](https://www.rsc.org/images/entities/char_e002.gif) FeIII(H2O2) FeIII(H2O2)
| (18) |
![[triple bond, length as m-dash]](https://www.rsc.org/images/entities/char_e002.gif) FeIII(H2O2) → FeIII(H2O2) → ![[triple bond, length as m-dash]](https://www.rsc.org/images/entities/char_e002.gif) FeIIOOH + H+ FeIIOOH + H+
| (19) |
![[triple bond, length as m-dash]](https://www.rsc.org/images/entities/char_e002.gif) FeIIOOH ↔ FeIIOOH ↔ ![[triple bond, length as m-dash]](https://www.rsc.org/images/entities/char_e002.gif) FeII + HO2˙/O2˙− FeII + HO2˙/O2˙−
| (20) |
![[triple bond, length as m-dash]](https://www.rsc.org/images/entities/char_e002.gif) FeII + H2O2 → FeII + H2O2 → ![[triple bond, length as m-dash]](https://www.rsc.org/images/entities/char_e002.gif) FeIII + OH− + ˙OH FeIII + OH− + ˙OH
| (21) |
| s-HFA + p-NP ↔ s-HFA(p-NP)n | (22) |
| s-HFA(p-NP)n + ˙OH → s-HFA + product | (23) |
The elimination of p-NP in the solution is analogous to the homogeneous Fenton-like reaction. As shown in eqn (1), ˙OH can be generated by the reaction of dissolved Fe2+ with H2O2 and p-NP can be degraded (eqn (24)) by the diffused ˙OH from the surface of HFA and the generated ˙OH in the solution.
| p-NP + ˙OH → product | (24) |
4. Conclusions
The CFA modified by nitric acid was applied as a catalyst in a Fenton-like process and its performance was studied in p-NP wastewater treatment. The maximum adsorption amount of HFA occupies 2.96% of the total amount of p-NP when the HFA loading is 10.0 mg L−1, indicating that the adsorption can be negligible in the treatment of wastewater. Under the optimum conditions (a reaction time of 60 min, CH2O2 of 170 mg L−1, CHFA of 10.0 g L−1, pH of 2.0, and a mixing speed of 150 rpm), 98% of the p-NP was removed at room temperature. The H2O2 dosage and pH must be controlled at appropriate values (170 mg L−1 and 2.0, respectively) for avoiding the invalid decomposition/consumption of H2O2/˙OH and the oxidation of ferrous ions. The catalytic capacity of HFA is sensitive to the change of treatment temperature and a higher reaction temperature is helpful for simultaneously increasing the treatment efficiency and decreasing the treatment time. HFA has favourable stability and reusability, as it can be used 9 times with a >91% removal rate of p-NP. The nitric acid modification activates the CFA via increasing the Fe2O3 proportion, reducing the CaO and LOI proportion, and via increasing the specific surface area and pore volume. The degradation of p-NP can occur on the surface of HFA and in the solution, and the latter is similar to the homogeneous Fenton-like process.References
- Z. Wan and J. L. Wang, RSC Adv., 2016, 105, 103523–103531 RSC.
- N. Flores, I. Sirés, J. A. Garrido, F. Centellas, R. M. Rodríguez, P. L. Cabot and E. Brillas, J. Hazard. Mater., 2016, 319, 3–12 CrossRef CAS PubMed.
- M. R. Carrasco-Díaz, E. Castillejos-López, A. Cerpa-Naranjo and M. L. Rojas-Cervantes, Chem. Eng. J., 2016, 304, 408–418 CrossRef.
- C. Khatri and A. Rani, Fuel, 2008, 87, 2886–2892 CrossRef CAS.
- K. I. Andersson, M. Eriksson and M. Norgren, Ind. Eng. Chem. Res., 2011, 50, 7733–7739 CrossRef CAS.
- A. M. Cardoso, A. Paprocki, L. S. Ferret, C. M. N. Azevedo and M. Pires, Fuel, 2015, 139, 59–67 CrossRef CAS.
- M. Visa, L. Isac and A. Duta, Appl. Surf. Sci., 2012, 258, 6345–6352 CrossRef CAS.
- M. Visa, Powder Technol., 2016, 294, 338–347 CrossRef CAS.
- M. Visa and A. M. Chelaru, Appl. Surf. Sci., 2014, 303, 14–22 CrossRef CAS.
- Q. Zhou, C. J. Yan and W. J. Luo, Mater. Des., 2016, 92, 701–709 CrossRef CAS.
- P. Duan, C. J. Yan, W. Zhou and D. M. Ren, Ceram. Int., 2016, 42, 13507–13518 CrossRef CAS.
- M. Visa, L. Andronic and A. Duta, J. Environ. Manage., 2015, 150, 336–343 CrossRef CAS PubMed.
- A. M. Cardoso, M. B. Hom, L. S. Ferret, C. M. N. Azevedo and M. Pires, J. Hazard. Mater., 2015, 287, 69–77 CrossRef CAS PubMed.
- G. X. Qi, X. F. Lei, L. Li, C. Yuan, Y. L. Sun, J. B. Chen, J. Chen, Y. Wang and J. M Hao, Chem. Eng. J., 2015, 279, 777–787 CrossRef CAS.
- M. Ahmaruzzaman, Prog. Energy Combust. Sci., 2010, 36, 327–363 CrossRef CAS.
- J. B. Zhang, S. P. Li, H. Q. Li and M. M. He, Fuel Process. Technol., 2016, 151, 64–71 CrossRef CAS.
- Y. Flores, R. Flores and A. A. Gallegos, J. Mol. Catal. A: Chem., 2008, 281, 184–191 CrossRef CAS.
- C. J. An, S. Q. Yang, G. H. Huang, S. Zhao, P. Zhang and Y. Yao, Fuel, 2016, 165, 264–271 CrossRef CAS.
- N. Koshy and D. N. Singh, J. Mater. Civ. Eng., 2016, 28, 04016126 CrossRef.
- S. Subramanian, G. Pande, G. D. Weireld, J. M. Giraudon, J. F. Lamonier and V. S. Batra, Ind. Crops Prod., 2013, 49, 108–116 CrossRef CAS.
- M. Martin-Hernandez, J. Carrera, J. Perez and M. E. Suarez-Ojeda, Water Res., 2009, 43, 3871–3883 CrossRef CAS PubMed.
- K. Huang, K. Inoue, H. Harada, H. Kawakita and K. Ohto, Trans. Nonferrous Met. Soc. China, 2011, 21, 1422–1427 CrossRef.
- F. Pacheco-Torgal and S. Jalali, Construct. Build. Mater., 2009, 23, 3485–3491 CrossRef.
- M. I. Muñoz, A. J. Aller and D. Littlejohn, Mater. Chem. Phys., 2014, 143, 1469–1480 CrossRef.
- B. A. Labaran and M. S. Vohra, Desalin. Water Treat., 2016, 57, 16034–16052 CrossRef CAS.
- N. N. Wang, T. Zheng, G. S. Zhang and P. Wang, J. Environ. Chem. Eng., 2016, 4, 762–787 CrossRef CAS.
- N. N. Wang, T. Zheng, J. P. Jiang and P. Wang, Chem. Eng. J., 2015, 260, 386–392 CrossRef CAS.
- Y. Baba, T. Yatagai, T. Harada and Y. Kawase, Chem. Eng. J., 2015, 277, 229–241 CrossRef CAS.
- S.-Q. Liu, L.-R. Feng, N. Xu, Z.-G. Chen and X.-M. Wang, Chem. Eng. J., 2012, 203, 432–439 CrossRef CAS.
- P. A. Soares, M. Batalha, S. M. A. G. U. Souza, R. A. R. Boaventura and V. J. P. Vilar, J. Environ. Manage., 2015, 152, 120–131 CrossRef CAS PubMed.
- N. Daneshvar, M. A. Behnajady and Y. Z. Asghar, J. Hazard. Mater., 2007, 139, 275–279 CrossRef CAS PubMed.
- S.-P. Sun and A. T. Lemley, J. Mol. Catal. A: Chem., 2011, 349, 71–79 CrossRef CAS.
- D. Wan, W. B. Li, G. H. Wang, L. L. Lu and X. B. Wei, Sci. Total Environ., 2017, 574, 1326–1334 CrossRef CAS PubMed.
- P. F. Collins, H. Diehl and G. F. Smith, Anal. Chem., 1959, 31, 1862–1867 CrossRef CAS.
- H. F. Zhang, X. T. Hong, S. D. Shan and X. L. Yuan, RSC Adv., 2016, 97, 95129–95136 RSC.
- Y. H. Wang, C. J. Feng, Y. Li, J. Y. Gao and C. P. Yu, Chem. Eng. J., 2017, 307, 679–686 CrossRef CAS.
- Z. Wan and J. L. Wang, J. Hazard. Mater., 2017, 324, 653–664 CrossRef CAS PubMed.
- B. Kakavandi and A. A. Babaei, RSC Adv., 2016, 88, 84999–85011 RSC.
- S. H. Chen and D. Y. Du, J. Cent. South Univ., 2014, 21, 1448–1452 CrossRef CAS.
- A. L. Zhang, N. N. Wang, J. T. Zhou, P. Jiang and G. F. Liu, J. Hazard. Mater., 2012, 201–202, 68–73 CrossRef CAS PubMed.
- N. Li, P. Wang, C. Zuo, H. L. Cao and Q. S. Liu, Environ. Eng. Sci., 2010, 27, 271–280 CrossRef CAS.
- N. N. Wang, T. Zheng, J. P. Jiang, W. S. Lung, X. J. Miao and P. Wang, Chem. Eng. J., 2014, 239, 351–359 CrossRef CAS.
- B. G. Kwon, D. S. Lee, N. Kang and J. Yoon, Water Res., 1999, 33, 2110–2118 CrossRef.
- X. J. Ma and H. L. Xia, J. Hazard. Mater., 2009, 162, 386–390 CrossRef CAS PubMed.
- E. Saputra, S. Muhammad, H. Q. Sun, H. M. Ang, M. O. Tade and S. B. Wang, Catal. Today, 2012, 190, 68–72 CrossRef CAS.
- M. R. Becelic-Tomin, M. B. Dalmacija, B. D. Dalmacija, L. M. Rajic and D. D. Tomasevic, Hem. Ind., 2012, 66, 485–494 CrossRef.
- G. Q. Gan, J. Liu, Z. X. Zhu, Z. Yang, C. L. Zhang and X. H. Hou, Chemosphere, 2017, 168, 254–263 CrossRef CAS PubMed.
- M. R. Carrasco-Díaz, E. Castillejos-López, A. Cerpa-Naranjo and M. L. Rojas-Cervantes, Chem. Eng. J., 2016, 304, 408–418 CrossRef.
- J. J. Zhang, X. H. Zhang and Y. F. Wang, RSC Adv., 2016, 16, 13168–13176 RSC.
- M. Usman, K. Hanna and S. Haderlein, Sci. Total Environ., 2016, 569, 179–790 CrossRef PubMed.
- W. Q. Pan, G. S. Zhang, T. Zheng and P. Wang, RSC Adv., 2015, 5, 27043–27051 RSC.
- M. Hartmann, S. Kullmann and H. Keller, J. Mater. Chem., 2010, 20, 9002–9017 RSC.
- M. Moussavi and S. Matavos-Aramyan, Korean J. Chem. Eng., 2016, 33, 2384–2391 CrossRef CAS.
- L. Gu, N. W. Zhu and P. Zhou, Bioresour. Technol., 2012, 118, 638–642 CrossRef CAS PubMed.
- I. S. X. Pinto, P. H. V. V. Pacheco, J. V. Coelho, E. Lorenc, J. D. Ardisson, J. D. Fabris, P. P. de Souza, K. W. H. Krambrock, L. C. A. Oliveira and M. C. Pereira, Appl. Catal., B, 2012, 119–120, 175–182 CrossRef CAS.
- R. C. C. Costa, F. C. C. Moura, J. D. Ardisson, J. D. Fabris and R. M. Lago, Appl. Catal., B, 2008, 83, 131–139 CrossRef CAS.
| This journal is © The Royal Society of Chemistry 2017 |

