 Open Access Article
Three Pt(II) complexes based on thiosemicarbazone: synthesis, HSA interaction, cytotoxicity, apoptosis and cell cycle arrest†
Xu-Dong Lin‡
 a,
Ya-Hong Liu‡a,
Cheng-Zhi Xie
 a,
Wei-Guo Baoa,
Jun Shen
 *b and
Jing-Yuan Xu*a
aDepartment of Chemical Biology, Tianjin Key Laboratory on Technologies Enabling Development of Clinical Therapeutics and Diagnostics (Theranostics), School of Pharmacy, Tianjin Medical University, Tianjin 300070, P. R. China. E-mail: xujingyuan@tmu.edu.cn; Tel: +86 022 83336929
bDepartment of Sanitary Chemistry, School of Public Health, Tianjin Medical University, Tianjin 300070, P. R. China. E-mail: shenjun@tmu.edu.cn; Tel: +86 022 83336638
First published on 17th May 2017
Abstract
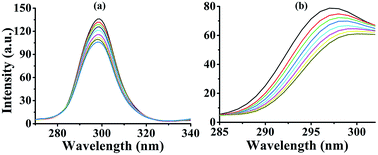
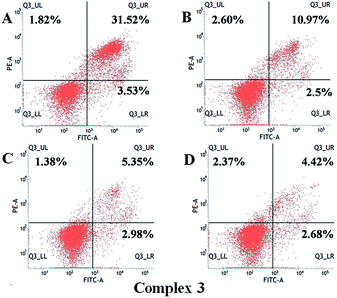
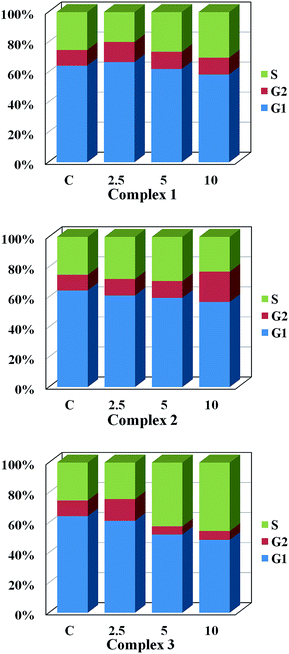
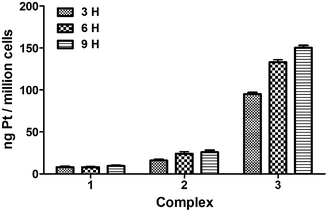
Three thiosemicarbazone-based platinum(II) complexes [Pt(MH-TSC)Cl] (1), [Pt(ME-TSC)Cl] (2) and [Pt(NH-TSC)2]Cl (3) (MH-TSC = (E)-2-(1-(pyridin-2-yl)ethylidene)hydrazinecarbothioamide, ME-TSC = (E)-N-ethyl-2-(1-(pyridin-2-yl)ethylidene) hydrazinecarbothioamide, NH-TSC = (Z)-2-(amino(pyridin-2-yl)methylene)hydrazinecarbothioamide) were synthesized and structurally characterized. X-ray analyses revealed that 1 and 2 possessed similar a neutral mononuclear unit in which one tridentate TSC ligand and one leaving group (Cl−) coordinated to Pt(II) ion, while 3 was cationic and formed by two NH-TSC ligands surrounding one Pt atom in a meridional arrangement. UV-visible and fluorescence spectra of human serum albumin (HSA) with the complexes displayed that the quenching mechanism of HSA by 1–3 might be a static binding mode. Moreover, synchronous fluorescence experiments proved that 1–3 affected the microenvironment of tryptophan residues of HSA. In addition, the antiproliferative activities against MCF-7 (human breast cancer lines), HepG-2 (human liver hepatocellular carcinoma cell line), NCI-H460 (non-small cell lung cancer lines) and HeLa (human epithelial cervical cancer cell line) were screened for 1–3. Inspiringly, their cytotoxic activity (IC50 = 1.7–9.6 μM) appeared much better than that of cisplatin (IC50 = 5.2–13.5 μM) against different cell lines, respectively. Among them, complex 3 exhibited the strongest inhibition on the viability of all tested cell lines with IC50 values of 1.7–2.2 μM. Inductively-coupled plasma mass spectrometry (ICP-MS) showed that 3 accumulated rapidly in cells and reached intracellular levels of up to 10-fold higher than those determined for 1 and 2. Furthermore, fluorescence microscopic observation and flow cytometric analysis revealed that 1–3 could effectively induce apoptosis of HeLa cells, which were arrested in the S phase after treatment with 1 (30.31%) and 3 (46.96%), and in G2 phase with 2 (20.2%). All the results mentioned above suggest that complexes 1–3 might be efficient antitumor agents.
Introduction
Cisplatin (cis-diamminedichloroplatinum(II)), capable of efficiently binding to and damaging DNA,1 has been widely used in the clinical treatment of various cancers since 1978. It functions in particular with respect to the therapy of head and neck, testicular, small lung cell and ovarian cancers.2–5 Unfortunately, cisplatin exhibits some drawbacks including severe side effects,6 acquired drug resistance7 and low water-solubility,8 which seriously limit its clinical applications. To combat those limitations, researchers have been exploring new Pt-compounds to improve antitumor efficiency.Optimizing ligand structure is a usual strategy to design and construct new platinum antitumor agents. Therefore, a large number of so-called non-classical platinum complexes, which are structurally different from classical Pt drugs, have recently attracted researchers' attention.9 These complexes usually have monofunctional, cationic or high-valence Pt(IV) features, which might lead to a distinctly different manner of antitumor activity compared to current cisplatin-like drugs.10
Thiosemicarbazone (TSC) includes thousands of compounds, and many of them may possess various biological activities. It was reported that 2-formylpyridine TSC could have anti-leukemic activity in mice.11 Additionally, 3-AP (3-aminopyridine-2-carboxaldehyde thiosemicarbazone) is an inhibitor of ribonucleotide reductase (RNR) that catalyzes the reductive conversion of RNA building blocks into DNA building blocks for DNA replication and repair.12,13 So, 3-AP exhibites efficient antitumor activities and have undergone phase II clinical trials. Meanwhile, combination of 3-AP and cisplatin could enhance the clinical efficacy.14,15 Moreover, Dp44mT is a terminally dimethylated derivative of 3-AP, and it was shown to be 100-fold more potent than 3-AP with respect to cytotoxicity to tumor cells.16 Not only as antitumor agents, but also TSC could be applied in molecular imaging, metal-sensing, anti-viral, anti-microbial, and anti-inflammatory.17–19
Previously, our group synthesized a tetranuclear TSC-based Pt(II) complex in the laboratory.20 It showed intense nuclease activity that could degrade DNA completely. However, this complex was little cytotoxic to tumor cells, probably because of its low solubility and difficulty in the uptake by cells. In this work, we designed and synthesized three mononuclear complexes 1–3 based on ligands MH-TSC, ME-TSC, and NH-TSC, respectively, attempting to improve solubility and cytotoxicity, and explore the structure-activity relationship. The HSA-binding, cytotoxicity, and apoptotic induction and celluar uptake of the complexes were investigated.
Experimental
Materials and physical measurements
All chemicals were purchased from commercial sources and used without further purification. Tris–HCl buffer solution was prepared using triple-distilled water. Reactions were typically carried out in air, all chemical solvents were dried and distilled by standard methods before use (cautious: MeOH must dry over Mg and I2). IR spectra were recorded on a Nicolet 380 spectrometer as KBr pellets in the range 4000–375 cm−1 with the OMNIC software. NMR measurements were recorded on a Bruker AVANCE III 400 spectrometer with tetramethylsilane as the internal standard. Electrospray ionization mass spectrometry (ESI-MS) was analyzed using an Agilent MS instrument with an ion spray source using electrospray ionization in positive-ion mode. Single crystal data were collected on a Rigaku Saturn X-ray CCD diffractometer using MoKα radiation. UV spectra were measured using a JASCO V-770 spectrophotometer. Fluorescence spectral data were obtained using a Shimadzu RF-5301 fluorescence spectrophotometer at the approved temperature. 3-(4,5-Dimethyl-2-thiazolyl)-2,5-diphenyl-2-H-tetrazolium bromide (MTT), Crystal Violet, Hoechst 33342, Propidium Iodide (PI), and HSA were purchased from Sigma-Aldrich Corporation. DMEM was obtained from Gbico and Fetal Bovine Serum (FBS) was from Hyclone. Annexin V-FITC/PI Apoptosis Detection Kit was purchased from MBL. Human cervical cancer cell lines (HeLa), human breast cancer lines (MCF-7), human hepatoma cell lines (HepG-2) and non-small cell lung cancer lines (NCI-H460) were obtained from American Type Culture Collection (Rockville, MD, USA). All the cells were cultured with DMEM which contained 10% FBS, 100 μg mL−1 penicillin and 100 μg mL−1 streptomycin in a humidified atmosphere including 5% CO2 at 37 °C.Synthesis of MH-TSC and ME-TSC
The synthetic route of all ligands are based on literatures reported previously:21–23 2-acetylpyridine (6.65 g, 0.054 mol) was dissolved in a solution of sodium in MeOH which had been dried over CaSO4 under stirring for 0.5 h. The thiosemicarbazide (5 g, 0.054 mol) or N(4)-ethylthiosemicarbazide (6.43 g, 0.054 mol) was added in small portions to the above solution, then the mixture was refluxed for another 4 h. The solution was cooled to room temperature and filtered, after that, the yellowish residue was dissolved and recrystallized from methanol. MH-TSC: yield: 9.26 g (ca. 79.5%). IR, 1H and 13C NMR analysis data of MH-TSC were listed in ESI.† 1H NMR (DMSO-d6, δ/ppm): 10.30 (s, 1H), 8.57 (d, 1H), 8.41 (d, 2H), 8.17–8.06 (m, 1H), 7.78 (td, 1.5 Hz, 1H), 7.37 (dd, 1H), 2.38 (s, 3H). 13C NMR (DMSO-d6, δ/ppm): 179.07 (s), 154.62 (s), 148.37 (s), 148.21 (s), 136.34 (s), 123.90 (s), 120.84 (s), 12.08 (s). ME-TSC: yield: 10.73 g (ca. 82%). 1H NMR (DMSO-d6, δ/ppm): 10.27 (s, 1H), 8.70 (t, 1H), 8.59 (ddd, 1H), 8.42 (d, 1H), 7.83 (tt, 1H), 7.40 (ddd, 1H), 3.64 (m, 2H), 2.40 (s, 3H), 1.17 (t, 3H). 13C NMR (DMSO-d6, δ/ppm): 177.60 (s), 154.68 (s), 148.43 (s), 147.91 (s), 136.28 (s), 123.85 (s), 120.75 (s), 38.51 (s), 14.43 (s), 12.09 (s).Synthesis of NH-TSC
This compound was synthesized in a similar way to that of MH-TSC, using 2-cyanopyridine (5.63 g, 0.054 mol) instead of 2-acetylpyridine (6.65 g, 0.054 mol). Yield: 6.38 g (ca. 60%). 1H NMR (d6-DMSO, δ/ppm): 10.06 (s, 1H), 8.55 (d, 1H), 8.44 (d, 1H), 7.95 (s, 1H), 7.86–7.75 (m, 2H), 7.43 (dd, 1H), 6.92 (s, 2H). 13C NMR (d6-DMSO, δ/ppm): 176.64 (s), 150.15 (s), 147.85 (s), 141.86–140.20 (m), 136.64 (s), 124.48 (s), 121.10 (s).Synthesis of complexes
X-ray crystallographic studies
Crystals were picked up with a glass fiber and immediately mounted in a cold nitrogen stream to prevent loss of solvent. Intensity data were collected by a Rigaku Saturn CCD diffractometer using MoKα radiation (λ = 0.71073 Å) with the ω–2θ scan technique at 113(2) K. An empirical absorption correction was applied to the raw intensities. The structures were solved by direct methods SHELXS-97 and refined with full matrix least-squares technique on F2 using SHELXL-97.24 The hydrogen atoms were added theoretically, riding on the concerned atoms, and refined with fixed thermal factors. Structures were checked for higher symmetry using PLATON.25 Further crystallographic data and experimental details for structural analyses of 1–3 are summarized in Table 1. Selected bond lengths (Å) and bond angles (°) of 1–3 are listed in Table 2. Crystallographic data for the structures reported in this article have been deposited at the Cambridge Crystallographic Data Centre, CCDC No. 1471505–1471507 for 1–3.†| Complex | 1 | 2 | 3 |
| Empirical formula | C8H9ClPtN4S | C10H13ClPtN4S | C14H19ClPtN10S2O |
| Formula weight | 423.79 | 451.84 | 638.04 |
| Temperature/K | 113(2) | 113(2) | 113(2) |
| Wavelength/Å | 0.71073 | 0.71073 | 0.71073 |
| Space group | P21/n | C2/c | P1 |
| a/Å | 7.4429(7) | 15.957(3) | 8.101(2) |
| b/Å | 13.5839(13) | 15.120(2) | 9.3191(19) |
| c/Å | 10.5375(10) | 12.362(2) | 14.094(3) |
| α/° | 90 | 90 | 92.2270(10) |
| β/° | 95.673(2) | 122.314(2) | 99.051(8) |
| γ/° | 90 | 90 | 104.437(8) |
| Volume/Å3 | 1060.16(17) | 2520.7(7) | 1014.2(4) |
| Z | 4 | 8 | 2 |
| ρ calcd/mg m−3 | 2.655 | 2.387 | 2.089 |
| F (000) | 784 | 1704 | 616 |
| Crystal size/mm | 0.15 × 0.12 × 0.10 | 0.20 × 0.15 × 0.12 | 0.20 × 0.18 × 0.15 |
| θ limits/° | 3.00–27.50 | 1.84–27.91 | 3.22–27.52 |
| Reflections collected | 13436 | 15956 | 13023 |
| Unique reflections | 2437 [R(int) = 0.0437] | 2885 [R(int) = 0.0276] | 4552 [R(int) = 0.0357] |
| Data/restraints/parameters | 2437/0/136 | 2885/3/166 | 4552/0/278 |
| Goodness of fit on F2 | 0.784 | 0.941 | 0.891 |
| R1(I > 2σ(I)) | R1 = 0.0161 | R1 = 0.0159 | R1 = 0.0202, |
| wR2 (all data) | wR2 = 0.0384 | wR2 = 0.0326 | wR2 = 0.0504 |
| Largest diff. peak and hole/e Å3 | 1.049 and −1.295 | 0.561 and −0.899 | 1.827 and −1.282 |
| 1 | |||
| Pt(1)–N(2) | 1.951(2) | N(2)–Pt(1)–N(1) | 80.77(9) |
| Pt(1)–N(1) | 2.041(2) | N(2)–Pt(1)–S(1) | 85.27(7) |
| Pt(1)–S(1) | 2.2557(7) | N(1)–Pt(1)–S(1) | 166.02(7) |
| Pt(1)–Cl(1) | 2.3233(7) | N(2)–Pt(1)–Cl(1) | 178.59(7) |
| N(1)–Pt(1)–Cl(1) | 98.25(6) | S(1)–Pt(1)–Cl(1) | 95.69(2) |
| C(8)–S(1)–Pt(1) | 94.14(9) | C(6)–N(2)–Pt(1) | 117.8(2) |
![[thin space (1/6-em)]](https://www.rsc.org/images/entities/char_2009.gif) |
|||
| 2 | |||
| Pt(1)–N(2) | 1.959(2) | N(2)–Pt(1)–N(1) | 80.79(10) |
| Pt(1)–N(1) | 2.039(2) | N(2)–Pt(1)–S(1) | 85.24(7) |
| Pt(1)–S(1) | 2.2568(8) | N(1)–Pt(1)–S(1) | 165.98(7) |
| Pt(1)–Cl(1) | 2.3145(7) | N(2)–Pt(1)–Cl(1) | 177.77(7) |
| N(1)–Pt(1)–Cl(1) | 97.17(7) | C(8)–S(1)–Pt(1) | 94.33(10) |
| S(1)–Pt(1)–Cl(1) | 96.82(3) | C(1)–N(1)–Pt(1) | 129.0(2) |
![[thin space (1/6-em)]](https://www.rsc.org/images/entities/char_2009.gif) |
|||
| 3 | |||
| Pt(1)–N(3) | 1.971(2) | N(3)–Pt(1)–N(1) | 80.43(10) |
| Pt(1)–N(1) | 2.059(2) | N(3)–Pt(1)–S(1) | 84.54(7) |
| Pt(1)–S(1) | 2.2529(8) | N(3)–Pt(1)–S(2) | 173.39(7) |
| Pt(1)–S(2) | 2.3049(8) | N(1)–Pt(1)–S(1) | 164.96(7) |
| N(1)–Pt(1)–S(2) | 99.68(7) | C(7)–S(1)–Pt(1) | 94.86(10) |
| S(1)–Pt(1)–S(2) | 95.31(3) | C(14)–S(2)–Pt(1) | 108.46(10) |
HSA binding studies
Fluorescence quenching and UV spectrophotometry were used to carry out the protein (HSA) binding experiments. The protein was prepared in the phosphate buffer solution (containing 0.01 M NaH2PO4 and Na2HPO4 in aqueous medium at pH = 7.2). HSA solution concentration was controlled at 5 × 10⁻⁷ M (based on the molecular weight of HSA 66 kD), and then the solution was kept in the dark at 277 K overnight. Fluorescence quenching measurements were performed by keeping the concentration of HSA constant while gradually increasing the concentration of 1–3 at 25° (298 K), respectively. Fluorescence spectra were recorded at an excitation wavelength of 290 nm and emission wavelength range from 300 to 500 nm. UV spectrometry was performed using a JASCO V-770 spectrophotometer equipped with a 2 cm quartz cell. Absorption titration experiments were done by keeping the concentration of HSA constant (5 × 10⁻⁶ M) while adding the same concentration solution of 1–3, respectively. Synchronous fluorescence spectral experiments were operated with the same method as above while keeping the D values (Δλ) between excitation and emission wavelengths, which are stabilized at 15 and 60 nm respectively, at room temperature. All the data were obtained after each successive addition of HSA solution and equilibration (ca. 10 min).Cytotoxicity evaluation
Apoptosis evaluation
Cell proliferation assay
Monoclonal formation assay
Cellular proliferation, an ability of cancer cells maintaining clonogenic capacity, was assessed by monoclonal formation assay. HeLa cells were plated with a density of 300 in 6 well-plate and incubated for 3 days until the cells attached to wells, complex 3 was added to the cells with various amounts (0, 2.5, 5, 10 μM) for 48 h, and then the medium containing 3 was changed with fresh medium and continuously incubated for two weeks. After this period of time, cells were washed twice with PBS (pH = 7.4) and fixed with methanol–acetic acid (3![[thin space (1/6-em)]](https://www.rsc.org/images/entities/char_2009.gif) :
:![[thin space (1/6-em)]](https://www.rsc.org/images/entities/char_2009.gif) 1) solution for 15 min, stained with crystal violet solution (1% crystal violet, 20% ethanol) for 30 min, washed with PBS and examined with an inverted fluorescence microscope.
1) solution for 15 min, stained with crystal violet solution (1% crystal violet, 20% ethanol) for 30 min, washed with PBS and examined with an inverted fluorescence microscope.
Platinum uptake assay
To assess the absorption capability of tumor cells to the three complexes, we examined the intracellular platinum content.26 In brief, cells (1 × 10⁶ per well) were placed in 6-well plates and incubated for 24 h. Then, cells were treated with complexes (4 μM) at 37 °C for 3, 6 and 9 h, respectively. After treatment, the cells were washed three times with PBS, digested with trypsinization, collected with cold PBS and centrifuged at 1500 rpm for 5 min. Finally, supernatant was discarded and samples were lyophilized using a freeze dry system.Prior to analysis, the lyophilized samples were digested with 0.2 mL highpurity nitric acid at room temperature for 4 h, diluted with 2 mL deionized water, centrifuged at 5000 rpm for 15 min, and transferred with an aliquot 0.2 mL to an ICP-MS autosampler tube for determining the Pt content. Thermo iCAP Q ICP-MS was calibrated with a Pt-containing acid matrix. The platinum content under each time point was expressed as ng Pt per million cells.
Results and discussion
X-ray structure characterization
Complexes 1–3 have been structurally characterized by single crystal X-ray analysis. A labelled plot of 1–3 is shown in Fig. 1. Complex 1 crystallizes in the monoclinic system with space group P21/n and consists of neutral asymmetric mononuclear platinum(II) units without crystallization water. The structure of 1 consists of neutral asymmetric mononuclear unit, in which Pt(II) ion is tetracoordinated. The basal plane is formed by imine nitrogen N(1) [Pt(1)–N(1) = 2.041(2) Å], N(2) [Pt(1)–N(2) = 1.951(2) Å], thione S(1) [Pt(1)–S(1) = 2.2557(7) Å] from MH-TSC ligand and one chlorine Cl(1) [Pt(1)–Cl(1) = 2.3233(7) Å]. The donor atoms, N(1), N(2), S(1) and Cl(1), show a relatively good planarity, and Pt(1) displaced out of the basic plane towards the apex by 0.0151 Å. For 2, it crystallizes in monoclinic C2/c space group and presents a quite similar mononuclear Pt(II) structure to 1 owing to its slight ligand modification with ethyl instead of hydrogen in 1. As Fig. 1 shown, central Pt(II) ion in 2 is tetracoordinated, showing a good square planar geometry, surrounded by imine nitrogen N(1), N(2) and carboxylate thione S(1) from ME-TSC ligand and one chlorine Cl(1). Complex 3 crystallizes in the triclinic crystal system with P1 space group and consists of one [Pt(NH-TSC)2]+ cation, one non-coordinating chloride anion, and one water solvent molecule. Each Pt centre is coordinated with two NH-TSC ligands, by virtue of two nitrogen and one sulfur atoms from one ligand [Pt(1)–N(1) 2.059(2), Pt(1)–N(3) 1.971(2) and Pt(1)–S(1) 2.2529(8) Å], as well as one S atom from the other ligand [Pt(1)–S(2) 2.3049(8) Å] to build the square-planar coordination geometry. The bond distance Pt(1)–S(1) [2.2529(8) Å] is shorter than Pt(1)–S(2) [2.3049(8) Å]. Therefore, the two ligands do not display a similar coordinating pattern as common cases. The thiosemicarbazone moieties, C6–N3–N4–C7–S1 and C13–N8–N9–C14–S2 have mean plane deviations of 0.020(6) and 0.018(6) Å, respectively, and are at an angle to each other of 74.3°. Meanwhile, no interesting hydrogen bond and π–π stacking were found in these three complexes. | ||
| Fig. 1 DIAMOND views of 1–3 with the selected atom labeling scheme (hydrogen atoms omitted for clarity). | ||
HSA binding experiments
| F0/F = 1 + Kqt0[Q] = 1 + Ksv[Q] | (1) |
In this equation, F0 and F represent the fluorescence intensities in the absence and presence of the quencher, respectively. Kq is the biomolecular quenching rate constant, Ksv is the quenching constant, t0 is the average life-time of the biomolecule without the quencher (t0 = 6.2 ns) and [Q] is the concentration of quencher. The effect of complex 3 on HSA fluorescence intensity with Stern–Volmer plots are shown in Fig. 2. The corresponding Stern–Volmer quenching rate constant Kq of 1–3 were 4.25 × 10¹³, 7.09 × 10¹³ and 10.64 × 10¹³ L mol−1 s−1, respectively. The results showed that quenching constant Kq for 1–3 was on the order of 1013 L mol−1 s−1, which was 1000-fold higher than the maximum value possible for diffusion controlled quenching (i.e. 2.0 × 10¹⁰ L mol−1 s−1).28 This revealed that the quenching was not caused by dynamic collision but by a static one. The quenching mechanism should be further explored by UV-vis absorption spectrometry.
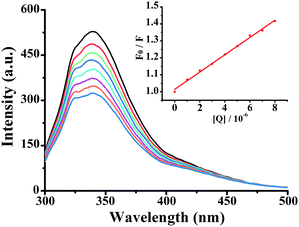 | ||
| Fig. 2 Fluorescence spectra of HSA in the different concentrations of 3 at room temperature, [HSA] = 5 × 10⁻⁷ M, complex 3 (0–8 μM). Inset: plot of F0/F vs. [complex]. | ||
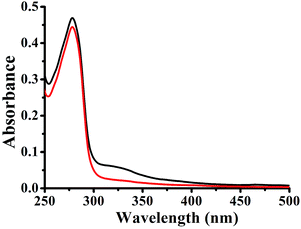
In a dynamic quenching mechanism, with the addition of a quencher, the absorption spectrum of the fluorescent substance is not changed, which due to the excited states of the fluorophore is not affected. While, the absorption spectrum will change in a static quenching, because new compound is formed between the quencher and HSA. The influences of the absorbance of HSA were observed by adding the same concentration of 1–3. From Fig. 3, the fluorescence of HSA caused by tryptophan, tyrosine, and phenylalanine residues exists.29 For 1–3, the absorption spectra decreased in the presence of the complex, indicating that the microenvironment of the three aromatic acid residues was changed, and this can prove that 1–3 formed a novel complex with HSA. These data suggested that the Pt(II) complex could interact with HSA through a static quenching mode.
| Cell | Complex IC50 (μmol L−1) | ||||
|---|---|---|---|---|---|
| 1 | 2 | 3 | Cisplatin | ||
| MCF-7 | 6.6 ± 2.1 | 8.3 ± 3.3 | 1.7 ± 0.4 | 13.5 ± 4.3 | |
| HepG-2 | 4.8 ± 1.6 | 7.2 ± 1.9 | 2.6 ± 0.6 | 9.71 ± 2.7 | |
| NCI-H460 | 9.6 ± 3.1 | 6.6 ± 2.0 | 2.8 ± 1.1 | 5.2 ± 2.2 | |
| HeLa | 7.4 ± 3.5 | 6.4 ± 2.4 | 2.2 ± 0.8 | 13.6 ± 4.6 | |
As three complexes exhibited strong antitumor effect, we determined to investigate the action manner of them by MTT assay. As shown in Fig. 5, complexes 1 and 3 exerted antitumor activity in a dose- and time-dependent behavior except 2. Along with the increasing concentration and time, the antitumor effect of 1–3 were strikingly enhanced. We did not expect that antitumor effect of 1 and 3 gradually reduced with the time extending while 2 exerted antiproliferation activity in a rapid manner. For example, when the HeLa cells were treated with 2 for 24 h, the IC50 values was lower 2 times than that of 1 and 3 with the same processing time. When the cells were incubated with 2 for 48 h, the IC50 values remained unchanged while that of 1 and 3 decreased two times than that of 2.
Apoptosis evaluation
Conclusions
In this work, three new platinum(II) complexes [Pt(MH-TSC)Cl] (1), [Pt(ME-TSC)Cl] (2) and [Pt(NH-TSC)2]Cl (3) were synthesized and characterized. According to the results obtained from the HSA interaction experiments, we concluded that the fluorescence quenching mechanism of HSA by 1–3 might be a static binding process. Complexes 1–3, with monofunctional or cationic features, showed higher cytotoxic activity towards four tumor cell lines than that of cisplatin under the same condition, and also superior to other thiosemicarbazone-based metal complexes with similar structure published in literatures.37–39 Previous reports displayed that bi-ligand complexes like 3, exhibited prominent anticancer activity with an extra ligand changing physicochemical features such as planarity, hydrophobicity and coordination geometry of metal complex.40–42 Consistently, cationic complex 3 had a distinct transport manner, resulted in higher ability for cellular uptake, which might explain its superior cytotoxic activity. Comparing the structures of 1 and 2, we see that there is one primary amine (–NH2) group for the ligand in 1, instead of secondary amine in 2, which might be available for hydrogen bonding with DNA base pairs and promising to improve the biological activity. So, it demonstrates that different transport manners or structural units will play a key role in the complexes' antiproliferative activity to cancer cells. In addition, the apoptotic study exhibited that complexes 1–3 could effectively induce apoptosis of HeLa cells. Meanwhile, cell proliferation assay demonstrated that treatments of HeLa cells with 1 and 3 hindered the cancer cells in S phase, while 2 processed a G2 phase arrest. These agents might trigger different signal pathways that eventually result in cell cycle arrest in different checkpoints. Further studies to elaborate its cytotoxicity mechanism are currently underway.Acknowledgements
This work was supported by National Natural Science Foundation of China (No. 21371135), Tianjin Municipal Natural Science Foundation (Nos 13JCZDJC28200 & 17JCZDJC33100).Notes and references
- T. C. Johnstone, K. Suntharalingam and S. J. Lippard, Chem. Rev., 2016, 116, 3436–3486 CrossRef CAS PubMed.
- D. Rades, D. Seidl, S. Janssen, A. Bajrovic, S. G. Hakim, B. Wollenberg and S. E. Schild, Oral Oncol., 2016, 57, 40–45 CrossRef CAS PubMed.
- M. Bandak, N. Jorgensen, A. Juul, J. Lauritsen, M. G. G. Kier, M. S. Mortensen and G. Daugaard, Eur. Urol. Focus, 2016 DOI:10.1016/j.euf.2016.11.018.
- Z. Xiao, C. Wang, L. Chen, X. Tang, L. Li, N. Li, J. Li, Q. Gong, F. Tang and J. Feng, Oncotarget, 2017, 8, 1329–1342 Search PubMed.
- X. Zhu, H. Shen, X. Yin, L. Long, C. Xie, Y. Liu, L. Hui, X. Lin, Y. Fang and Y. Cao, Oncogene, 2016, 35, 323–332 CrossRef CAS PubMed.
- E. Wong and C. M. Giandomenico, Chem. Rev., 1999, 99, 2451–2466 CrossRef CAS PubMed.
- L. Kelland, Nat. Rev. Cancer, 2007, 7, 573–584 CrossRef CAS PubMed.
- P. J. Loehrer, S. D. Williams and L. H. Einhorn, J. Natl. Cancer Inst., 1988, 80, 1373–1382 CrossRef PubMed.
- K. S. Lovejoy and S. J. Lippard, Dalton Trans., 2009, 10651–10659 RSC.
- J. Zhang, D. Liu, Y. Li, J. Sun, L. Wang and A. Zang, Mini-Rev. Med. Chem., 2009, 9, 1357–1366 CrossRef CAS PubMed.
- R. W. Brockman, J. R. Thomson, M. J. Bell and H. E. Skipper, Cancer Res., 1956, 16, 167–170 CAS.
- K. Agrawal and A. Sartorelli, Prog. Med. Chem., 1978, 15, 321–356 CrossRef CAS PubMed.
- M. Miller 3rd, C. Stineman, J. Vance, D. West and I. Hall, Anticancer Res., 1997, 18, 4131–4139 Search PubMed.
- C. A. Kunos, T. Radivoyevitch, S. Waggoner, R. Debernardo, K. Zanotti, K. Resnick, N. Fusco, R. Adams, R. Redline and P. Faulhaber, Gynecol. Oncol., 2013, 130, 75–80 CrossRef CAS PubMed.
- C. A. Kunos, T. Radivoyevitch, J. Pink, S. M. Chiu, T. Stefan, J. Jacobberger and T. J. Kinsella, Radiat. Res., 2010, 174, 574–581 CrossRef CAS PubMed.
- K. Ishiguro, Z. P. Lin, P. G. Penketh, K. Shyam, R. Zhu, R. P. Baumann, Y. L. Zhu, A. C. Sartorelli, T. J. Rutherford and E. S. Ratner, Biochem. Pharmacol., 2014, 91, 312–322 CrossRef CAS PubMed.
- A. E. Stacy, D. Palanimuthu, P. V. Bernhardt, D. S. Kalinowski, P. J. Jansson and D. R. Richardson, J. Med. Chem., 2016, 59(10), 4965–4984 CrossRef CAS PubMed.
- E. M. Jouad, G. Larcher, M. Allain, A. Riou, G. M. Bouet, M. A. Khan and X. Do Thanh, J. Inorg. Biochem., 2001, 86, 565–571 CrossRef CAS PubMed.
- B. S. Holla, K. Malini, B. S. Rao, B. Sarojini and N. S. Kumari, Eur. J. Med. Chem., 2003, 38, 313–318 CrossRef CAS PubMed.
- J. Shao, W. G. Bao, H. Tian, B. Li, X. F. Zhao, X. Qiao and J. Y. Xu, Dalton Trans., 2014, 43, 1663–1671 RSC.
- A. Castiñeiras, I. Garcia, E. Bermejo and D. X. West, Polyhedron, 2000, 19, 1873–1880 CrossRef.
- M. Carcelli, D. Delledonne, A. Fochi, G. Pelizzi, M. C. Rodríguez-Argüelles and U. Russo, J. Organomet. Chem., 1997, 544, 29–35 CrossRef CAS.
- D. X. West, G. A. Bain, R. J. Butcher, J. P. Jasinski, Y. Li, R. Y. Pozdniakiv, J. Valdés-Martínez, R. A. Toscano and S. Hernández-Ortega, Polyhedron, 1996, 15, 665–674 CrossRef CAS.
- G. Sheldrick, Acta Crystallogr., Sect. E: Struct. Rep. Online, 1997, 1600–5368 Search PubMed.
- A. Spek, Acta Crystallogr., Sect. A: Found. Crystallogr., 1990, 46, c34–c34 Search PubMed.
- A. Ghezzi, M. Aceto, C. Cassino, E. Gabano and D. Osella, J. Inorg. Biochem., 2004, 98, 73–78 CrossRef CAS PubMed.
- J. Toneatto and G. A. Argüello, J. Inorg. Biochem., 2011, 105, 645–651 CrossRef CAS PubMed.
- P. Kandagal, S. Ashoka, J. Seetharamappa, V. Vani and S. Shaikh, J. Photochem. Photobiol., A, 2006, 179, 161–166 CrossRef CAS.
- F. Wang, W. Huang and Z. Dai, J. Mol. Struct., 2008, 875, 509–514 CrossRef CAS.
- L. N. Hordge, K. L. McDaniel, D. D. Jones and S. O. Fakayode, Talanta, 2016, 152, 401–409 CrossRef CAS PubMed.
- M. B. Bolattin, S. T. Nandibewoor, S. D. Joshi, S. R. Dixit and S. A. Chimatadar, RSC Adv., 2016, 6, 63463–63471 RSC.
- W. He, Y. Li, C. Xue, Z. Hu, X. Chen and F. Sheng, Bioorg. Med. Chem., 2005, 13, 1837–1845 CrossRef CAS PubMed.
- G. Zhang, Y. Wang, H. Zhang, S. Tang and W. Tao, Pestic. Biochem. Physiol., 2007, 87, 23–29 CrossRef CAS.
- J. Seo, B. Kim, D. N. Dhanasekaran, B. K. Tsang and Y. S. Song, Cancer Lett., 2016, 371, 30–37 CrossRef CAS PubMed.
- L. Sun and J. Fang, Cell Cycle, 2016, 15, 2647–2655 CrossRef CAS PubMed.
- G. Chandrasekher and D. Sailaja, Invest. Ophthalmol. Visual Sci., 2004, 45, 3577–3588 Search PubMed.
- M. Mohamed Subarkhan, R. N. Prabhu, R. Raj Kumar and R. Ramesh, RSC Adv., 2016, 6, 25082 RSC.
- B. Q. Zou, X. Lu, Q. P. Qin, Y. X. Bai, Y. Zhang, M. Wang, Y. C. Liu, Z. F. Chen and H. Liang, RSC Adv., 2017, 7, 17923 RSC.
- J. Shao, Z. Y. Ma, A. Li, Y. H. Liu, C. Z. Xie, Z. Y. Qiang and J. Y. Xu, J. Inorg. Biochem., 2014, 136, 13 CrossRef CAS PubMed.
- A. Li, Y. H. Liu, L. Z. Yuan, Z. Y. Ma, C. L. Zhao, C. Z. Xie, W. G. Bao and J. Y. Xu, J. Inorg. Biochem., 2015, 146, 52–60 CrossRef CAS PubMed.
- V. Gandin, M. Porchia, F. Tisato, A. Zanella, E. Severin, A. Dolmella and C. Marzano, J. Med. Chem., 2013, 56, 7416–7430 CrossRef CAS PubMed.
- C. Rajarajeswari, M. Ganeshpandian, M. Palaniandavar, A. Riyasdeen and M. A. Akbarsha, J. Inorg. Biochem., 2014, 140, 255–268 CrossRef CAS PubMed.
Footnotes |
| † Electronic supplementary information (ESI) available: 1H and 13C NMR of ligand, corresponding figures of 1 and 2. CCDC 1471505–1471507 for 1–3. For ESI and crystallographic data in CIF or other electronic format see DOI: 10.1039/c7ra04443g |
| ‡ These authors contributed equally to this work. |
| This journal is © The Royal Society of Chemistry 2017 |

