 Open Access Article
Creative Commons Attribution 3.0 Unported Licence
Gas detection based on quantum dot LEDs utilizing differential optical absorption spectroscopy
Siyao Yua,
Long Yana,
Tieqiang Zhangb,
Yu Zhang a,
Xiaoyu Zhanga,
Guang Sun
 *c and
William W. Yu
 *ad
*ad
aState Key Laboratory on Integrated Optoelectronics, College of Electronic Science and Engineering, Jilin University, Changchun 130012, China. E-mail: wyu6000@gmail.com
bState Key Laboratory of Superhard Materials, College of Physics, Jilin University, Changchun 130012, China
cChina-Japan Union Hospital, Jilin University, Changchun 130012, China. E-mail: guangsun2013@163.com
dDepartment of Chemistry and Physics, Louisiana State University, Shreveport, LA 71115, USA
First published on 9th June 2017
Abstract
Near-infrared quantum dot light emitting diodes (QD-LEDs) were adopted to detect acetylene and ammonia based on differential optical absorption spectroscopy (DOAS). Three sizes of PbSe QDs were loaded on three GaN LED chips respectively to fabricate a near-infrared light source with three wavelengths and each could be modulated separately. An optical detector was used instead of a spectrograph to reduce the complexity of the detection system. The corresponding detection limits for two gases were both 10 ppm, with an accuracy of 2%.
1. Introduction
In recent years, semiconductor quantum dots (QDs),1–4 nanowires,5–7 and nanotubes8 have been investigated widely. Because of the unique properties, such as high photoluminescence (PL) quantum yield (QY) and size dependent tunable wavelength emissions, QDs are utilized in many areas including light emitting diodes (LEDs),9–11 solar cells,12–14 liquid-core optical fibers,15–17 biofluorescence imaging18,19 and temperature sensing.20,21 Among them, PbSe QDs show very strong quantum confinement and high PLQY in the near-infrared (NIR) region.12 Their PL can cover a wide infrared wavelength region of 1–4 μm.22–25 The PL wavelength can be simply adjusted by changing the particle size to cover the particular absorption frequencies of many kinds of gases in the NIR region. These characteristics make PbSe QDs promising materials for light conversion.In our previous work, a GaN LED and three sized PbSe QDs were utilized as excitation light source and light conversion materials to fabricate a new sort of NIR light source which was used to detect three gases by direct absorption spectroscopy (DAS) technique.26 To further improve the design and performance, we intend to take advantage of differential optical absorption spectroscopy (DOAS) technique instead of DAS. DOAS was firstly introduced in the late 70s by U. Platt and D. Perner.27,28 Since then, DOAS has been widely adopted to determine the concentrations and species of poisonous gases. It has the advantages of multi-gas simultaneous sensing, high resolution and accuracy. With this method, a tiny optical detector to significantly reduce the volume and cost of the detection system could replace the optical spectrometers. In our previous LED structure, three sized QDs were deposited on one chip and their emission could not be modulated separately, which makes it impossible to detect the three wavelengths respectively without filters.
In this work, a NIR light source was fabricated on a three-chip GaN LED and three sized PbSe QDs were placed on the three chips respectively to fabricate a NIR LED with three independently modulated wavelengths. The three GaN chips can be driven at different time intervals by a frequency controller. Therefore, the three NIR beams can be separately detected and transferred to electric signal by an optical detector. Two wavelengths corresponded to the particular absorption frequencies of ammonia and acetylene, and the third one was used as a reference wavelength. The DOAS technique was employed to eliminate the error caused by the instability influence of light intensity for higher precision and sensitivity. Compared to the previous structure, the optical spectrometer was replaced by a tiny optical detector. Therefore, the detection system could be greatly simplified.
2. Theoretical analysis
When gases were detected by single light path with two wavelengths, the Beer–Lambert law29 and the interference factor of light path should be considered. After the incident light passing through the gases, the intensity of emergent light is:| I(λ) = I0(λ)e−[g(λ)cl+β(λ)] | (1) |
| i1(λ) = K1(λ)D1(λ)I01(λ)e−[g1(λ)cl+β1(λ)] | (2) |
The signal achieved by detector is the sum of all the wavelength of emission peak.
 | (3) |
Assume the mid-value wavelength of gas absorption spectrum as ![[small lambda, Greek, macron]](https://www.rsc.org/images/entities/i_char_e0cc.gif) :
:
i1 = K1D1I01(λ)e−g1(![[small lambda, Greek, macron]](https://www.rsc.org/images/entities/i_char_e0cc.gif) )cle−β( )cle−β(![[small lambda, Greek, macron]](https://www.rsc.org/images/entities/i_char_e0cc.gif) )Δλ1 )Δλ1
| (4) |
In the same way, we can get:
i2 = K2D2I02(![[small lambda, Greek, macron]](https://www.rsc.org/images/entities/i_char_e0cc.gif) )e−g2( )e−g2(![[small lambda, Greek, macron]](https://www.rsc.org/images/entities/i_char_e0cc.gif) )cle−β( )cle−β(![[small lambda, Greek, macron]](https://www.rsc.org/images/entities/i_char_e0cc.gif) )Δλ2 )Δλ2
| (5) |
From the above two eqn (4) and (5), we get:
 | (6) |
![[small lambda, Greek, macron]](https://www.rsc.org/images/entities/i_char_e0cc.gif) ) ≈ β2(
) ≈ β2(![[small lambda, Greek, macron]](https://www.rsc.org/images/entities/i_char_e0cc.gif) ).
).
K and D do not change with the gas concentration: K2D2 = K1D1. By adjusting the circuit, we can make I01(![[small lambda, Greek, macron]](https://www.rsc.org/images/entities/i_char_e0cc.gif) ) = I02(
) = I02(![[small lambda, Greek, macron]](https://www.rsc.org/images/entities/i_char_e0cc.gif) ). Suppose
). Suppose  ,
,  ,
,  , the original equation can be simplified as
  .
.
3. Experimental
3.1 Materials and apparatuses
Lead(II) oxide (PbO, 99.99%), selenium powder (Se, 100 mesh, 99.99%), oleic acid (OA, 90%), 1-octadecene (ODE, 90%), tributylphosphine (TBP, 95%) and trioctylphosphine (TOP, 90%) were purchased from Alfa Aesar. Methanol, acetone, tetrachloroethylene, chloroform, hexane and toluene were obtained from Sigma-Aldrich. All chemicals were used directly without further treatment. The PL spectra were recorded using an Omni-λ300 Monochromator/Spectrograph. The light was detected by a UPD-3N-IR2-P InGaAs detector.3.2 Synthesis of PbSe QDs
We employed a solution-phase synthesis approach to prepare monodisperse, high quality PbSe QDs in the noncoordinating solvent.26 For 4.83 nm and 6.88 nm QDs, the whole synthetic system was a three-neck flask equipped with condenser, magnetic stirrer, thermocouple, and heating mantle. 0.892 g yellow lead oxide, 2.26 g oleic acid, and 12.848 g 1-octadecene were loaded into a 100 ml three-neck flask, respectively. The air in the three-neck flask was removed completely by 10 minutes nitrogen flow to avoid oxidation of reactants. The PbO powder would be dissolved in the solvent completely and the solution became colorless upon heating to around 170 °C. Shaking the flask was executed to help dissolve the PbO powder. Then, 6.9 ml Se–trioctylphosphine (Se–TOP) solution (containing 0.637 g Se) in a syringe was swiftly injected into the vigorously stirred hot solution. The temperature of the reaction mixture decreased to 143 °C for the growth of the PbSe QDs. At a certain reaction time, the reaction was quenched by injecting 30 ml of toluene and the flask was immersed into water immediately until the solution reached room temperature.For the synthesis of 2.53 nm QDs, the reaction step was the same as the one above but TBP was used instead of TOP for Se.12 0.892 g PbO, 4.45 g OA and 9.47 ml ODE was loaded into the three-neck flask. After nitrogen flow and dissolution procedure, the temperature was kept at 90 °C. 8 ml of TBP–Se solution (containing 0.64 g Se) was injected into the flask and the temperature was maintained at 74.3 °C for 2 minutes and 25 seconds. The quenching method was the same as above.
To remove excess reaction precursors and ODE, a series of purification operation procedures were carried out immediately following literature.2,26 The final PbSe QDs were dispersed in chloroform and stored in an argon filled glove box.
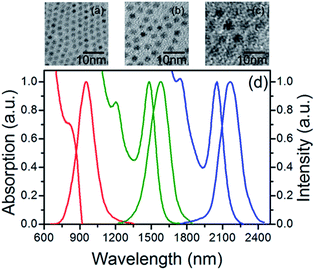
The Fig. 1a–(c) shows the TEM photographs of 2.53, 4.83 and 6.88 nm sized PbSe QDs. The Fig. 1d shows the absorption and PL spectra of these three PbSe QDs in tetrachloroethylene. The first exciton absorption peaks were 815, 1482 and 2053 nm, respectively, and the PL peaks located at 954, 1573 and 2163 nm correspondingly. It is clear to see the PL spectra with perfect Gaussian shapes.
3.3 Fabrication of PbSe QDs based NIR LEDs
For the fabrication of NIR LEDs, 20 mg PbSe QDs were dispersed in 0.5 ml chloroform to achieve a homogeneous solution. Then the solution was mixed with 0.4 g UV glue (NOA60 from LIENHE Fiber Optics). In order to disperse QDs into UV glue uniformly, vortex mixing and ultrasonic treatment were executed. Finally, the mixture was transferred into a vacuum chamber to remove chloroform and bubbles thoroughly. Then PbSe QD/UV glue composite was ready for utilization. A thin layer composite was deposited on one GaN chip carefully and the composite would be solidified adequately after being loaded into a ultra-violet lamp box. Repeat the operation of deposition and solidification until the blue light emitted by the GaN chip was completely absorbed. There sized QDs were deposited on three GaN chips separately. It is worth noting that each layer composite should be thin enough (about 0.3 mm) otherwise it was difficult to solidify it completely.3.4 Detection system
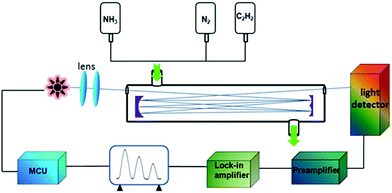
The experimental setup is shown in Fig. 2. The three chips were driven one after another by a frequency controller and the lights emitted by the QD-LED became parallel lights after crossing two lenses. Afterwards, the lights were guided into a gas cell with a reflection structure and optical path of totaling 16 m. In the end, the light was detected by an NIR detector which could transfer optical signal into an electrical signal. With the help of a preamplifier (reducing the noise signal) and a lock-in amplifier (amplifying the signal), three electrical output signals were obtained by time-sharing sampling.4. Results and discussion
4.1 The spectra matching between PbSe QD-LED and the gases
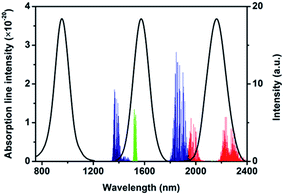
As industrial gases, C2H2 and NH3 are extremely explosive when their concentrations reach 2.5–80% and 16–25% in the air, respectively. Thus, it is important to detect their concentrations accurately, from production, transportation, to storage.The absorption spectra of NH3 (red lines) and C2H2 (green lines) are shown in Fig. 3. Water vapor (H2O) is an important part of air; therefore, the influence of H2O has to be eliminated in the detection process. The absorption spectrum of H2O (blue lines) is exhibited in Fig. 3. We chose three sized (2.53, 4.83, and 6.88 nm) PbSe QDs as conversion materials and the GaN LED as excitation light source to fabricate an NIR LED with three wavelengths. As shown in Fig. 3, the emission spectrum of LED demonstrates three wavelengths peaked at 954, 1573, and 2163 nm. The peaks had perfect Gaussian shapes and clearly indicated pure band-gap emissions.20 The full width at half maximum (FWHM) of each emission peak was 132, 145 and 175 nm, respectively. The absorption spectrum of C2H2 located in between 1510 nm and 1550 nm and the emission spectrum of 4.83 nm PbSe QDs covered the entire absorption spectrum of C2H2 gas completely. The emission spectrum of 6.88 nm PbSe QDs corresponded to the NH3 absorption spectrum. The emission peak of 2.53 nm QDs was used as a reference emission because there was no absorption in its emission region, while the ones of 4.83 and 6.88 nm QDs were treated as the detection emissions.
The picture of the GaN LED is exhibited in Fig. 4a. It has three chips. The positive electrodes of all the chips are connected with the metal electrode named B that located on the aluminium substrate. Then the three negative electrodes are soldered together with the other three metal electrode named C, R and G, respectively. As the excitation light source, this GaN LED owns three independent chips that can be driven separately. Following that, 2.5, 4.8, and 6.9 nm PbSe QDs were mixed with UV glue and dropped on three chips one by one to fabricate an NIR LED30 whose picture is shown in Fig. 3b. Ultimately, the QD LED was utilized as the light source to detect gas concentrations by driving the three chips separately.
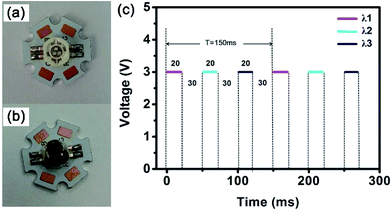 | ||
| Fig. 4 The camera pictures of 3-chip GaN LED (a) and the as-prepared QD-LED (b); (c) shows the driving voltage and frequency of the QD-LED. | ||
We used the method of time-sharing measurement based on microcontroller unit (MCU) to drive the three chips. The LED frequency of 6.67 Hz was adjusted with the duty cycle of 13.33%. 3.0 V voltage was applied onto the three chips as shown in Fig. 4c. The first chip was applied 3.0 V for 20 ms while the light with the wavelength of λ1 would be emitted, and then there was no voltage applied for 30 ms. The same profile was executed for the second and the third chips. There was only one chip actuated at one time for 20 ms.
4.2 Calibration and detection
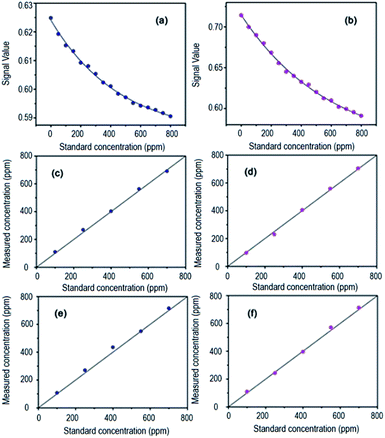
Introducing nitrogen and the target gases into the gas cell in the same time but with different flow rates, different gas concentrations were obtained. The concentrations of a series of prepared C2H2 samples within 0–800 ppm were loaded into the designed detection system (20 °C, 101.325 kPa) by using the designed system. The result of the detection signal divided by the reference signal was regarded as the detection result. In Fig. 5a, 16 standard concentrations of C2H2 and the output signals are shown. We employed Matlab to plot the curve fitting and the fitting formula was obtained as y = 0.04056 × e−x/461.17 + 0.58354, where y is the ratio of detection signal and reference signal, x is the gas concentration. Different concentration of C2H2 and NH3 were detected for one more time separately and used the calibrated formula to calculate the measured concentration to check the accuracy of the system. We repeated the experiment for many times to check the sensitivity and precision of the system. The accuracy curves were shown in Fig. 5c and d. The sensitivities of C2H2 and NH3 were confirmed to be 1 × 10⁻⁵ (10 ppm) and 1 × 10⁻⁵ (10 ppm) and their accuracies were 2% which were better than our previous results using the direct absorption spectroscopy (DAS) technology.4.3 Result analysis
In this work, we adjust the corresponding size of PbSe QDs based on the absorption spectra of NH3 and C2H2. Following the same principle, we can find the properly sized PbSe QDs as the conversion materials to detect CO2 and CH4 whose absorptions are located at 2.1 μm and 1.6 μm. Therefore, this method can be used to monitor the concentration of other kind of gases.
5. Conclusion
In summary, we adopted DOAS technique to detect two explosive gases of C2H2 and NH3. An NIR LED with three wavelengths was used as the light source owing to its advantages including high modulate rate without the large thermal inertia, narrow emitting band without obvious interference, low cost and small volume. Two wavelengths were regarded as detection wavelength and one wavelength was used as the reference wavelength. The result demonstrated high selectivity and accuracy. After eliminating the gas impacts in the air, the detection system is applied to actual detections.Acknowledgements
This work was financially supported by the National Natural Science Foundation of China (61475062, 61675086), the Jilin Province Key Fund (20140204079GX), BORSF RCS/SURE/Endowed Professor programs, the Jilin Province Development and Reform Commission (2015Y035-02), the Research Fund for the Doctoral Program of Higher Education of China (20130061110046), and the National Postdoctoral Program for Innovative Talents (BX201600060).References
- A. P. Alivisatos, Science, 1996, 271, 933–937 CAS.
- Y. Zhang, Q. Dai, X. Li, B. Zou, Y. Wang and W. W. Yu, J. Nanopart. Res., 2011, 13, 3721–3729 CrossRef CAS.
- X. G. Peng, L. Manna, W. D. Yang, J. Wickham, E. Scher, A. Kadavanich and A. P. Alivisatos, Nature, 2000, 404, 59–61 CrossRef CAS PubMed.
- X. Bai, G. Caputo, Z. Hao, V. T. Freitas, J. H. Zhang, R. L. Longo, O. L. Malta, R. A. S. Ferreira and N. Pinna, Nat. Commun., 2014, 5, 5702 CrossRef CAS PubMed.
- J. Hu, T. W. Odom and C. M. Lieber, Acc. Chem. Res., 1999, 32, 435–445 CrossRef CAS.
- A. M. Morales and C. M. Lieber, Science, 1998, 279, 208–211 CrossRef CAS PubMed.
- E. W. Wong, P. E. Sheehan and C. M. Lieber, Science, 1997, 277, 1971–1975 CrossRef CAS.
- Y. Zhang, T. Ichihashi, E. Landree, F. Nihey and S. Iijima, Science, 1999, 285, 1719–1722 CrossRef CAS PubMed.
- J. S. Steckel, S. Coe-Sullivan, V. Bulovi and M. G. Bawendi, Adv. Mater., 2003, 15, 1862–1866 CrossRef CAS.
- W. Hu, R. Henderson, Y. Zhang, G. You, L. Wei, Y. Bai, J. Wang and J. Xu, Nanotechnology, 2012, 23, 375202 CrossRef PubMed.
- C. Sun, Y. Zhang, S. Kalytchuk, Y. Wang, X. Zhang, W. Gao, J. Zhao, K. Cepe, R. Zboril, W. W. Yu and A. L. Rogach, J. Mater. Chem. C, 2015, 3, 6613–6615 RSC.
- X. Zhang, Y. Zhang, L. Yan, C. Ji, H. Wu, Y. Wang, P. Wang, T. Zhang, Y. Wang, T. Cui, J. Zhao and W. W. Yu, J. Mater. Chem. A, 2015, 3, 8501–8507 CAS.
- R. D. Schaller and V. I. Klimov, Phys. Rev. Lett., 2004, 92, 186601 CrossRef CAS PubMed.
- S. A. McDonald, G. Konstantatos, S. G. Zhang, P. W. Cyr, E. J. D. Klem, L. Levina and E. H. Sargent, Nat. Mater., 2005, 4, 138–142 CrossRef CAS PubMed.
- L. Zhang, Y. Zhang, S. V. Kershaw, Y. Zhao, Y. Wang, Y. Jiang, T. Zhang, W. W. Yu, P. Gu, Y. Wang, H. Zhang and A. L. Rogach, Nanotechnology, 2014, 25, 105704–105711 CrossRef PubMed.
- H. Wu, Y. Zhang, L. Yan, Y. Jiang, T. Zhang, Y. Feng, H. Chu, Y. Wang, J. Zhao and W. W. Yu, Opt. Mater. Express, 2014, 4, 1856–1862 CrossRef CAS.
- L. Zhang, Y. Zhang, T. Zhang, P. Gu, H. Chu, T. Cui, Y. Wang, H. Zhang, J. Zhao and W. W. Yu, J. Nanopart. Res., 2013, 15(2000), 1–10 Search PubMed.
- M. Bruchez, M. Moronne, P. Gin, S. Weiss and A. P. Alivisatos, Science, 1998, 281, 2013–2016 CrossRef CAS PubMed.
- I. L. Medintz, H. T. Uyeda, E. R. Goldman and H. Mattoussi, Nat. Mater., 2005, 4, 435–446 CrossRef CAS PubMed.
- P. F. Gu, Y. Zhang, Y. Feng, T. Q. Zhang, H. R. Chu, T. Cui, Y. D. Wang, J. Zhao and W. W. Yu, Nanoscale, 2013, 5, 10481–10486 RSC.
- C. Ji, Y. Zhang, T. Zhang, W. Liu, X. Zhang, H. Shen, Y. Wang, W. Gao, Y. Wang, J. Zhao and W. W. Yu, J. Phys. Chem. C, 2015, 119, 13841–13846 CAS.
- C. B. Murray, S. H. Sun, W. Gaschler, H. Doyle, T. A. Betley and C. R. Kagan, IBM J. Res. Dev., 2001, 45, 47–56 CrossRef CAS.
- H. Du, C. Chen, R. Krishnan, T. D. Krauss, J. M. Harbold, F. W. Wise, M. G. Thomas and J. Silcox, Nano Lett., 2002, 2, 1321–1324 CrossRef CAS.
- J. M. Pietryga, R. D. Schaller, D. Werder, M. H. Stewart, V. I. Klimov and J. A. Hollongsworth, J. Am. Chem. Soc., 2004, 126, 11752–11753 CrossRef CAS PubMed.
- B. L. Wehrenberg, C. J. Wang and P. Guyot-Sionnest, J. Phys. Chem. B, 2002, 106, 10634–10640 CrossRef CAS.
- L. Yan, Y. Zhang, T. Zhang, Y. Feng, K. Zhu, D. Wang, T. Cui, J. Yin, Y. Wang, J. Zhao and W. W. Yu, Anal. Chem., 2014, 86, 11312–11318 CrossRef CAS PubMed.
- U. Platt, Chemical Analysis Series, 1994, vol. 127, pp. 27–84 Search PubMed.
- D. Perner and U. Platt, Geophys. Res. Lett., 1979, 6(12), 917–920 CrossRef CAS.
- V. Nagali, S. I. Chou, D. S. Baer, R. K. Hanson and J. Segall, Appl. Opt., 1996, 35, 4026–4032 CrossRef CAS PubMed.
- L. Yan, X. Shen, Y. Zhang, T. Zhang, X. Zhang, Y. Feng, J. Yin, J. Zhao and W. W. Yu, RSC Adv., 2015, 5, 54109–54114 RSC.
| This journal is © The Royal Society of Chemistry 2017 |

