 Open Access Article
Concentration-dependent self-assembly structures of an amphiphilic perylene diimide with tri(ethylene glycol) substituents at bay positions†
Xin Wang‡
a,
Ting Zeng‡a,
Mohamed Nourreina,
Bo-Han Laib,
Kaiwen Shena,
Chien-Lung Wang*b,
Bin Sun *a and
Meifang Zhu*a
aState Key Laboratory for Modification of Chemical Fibers and Polymer Materials, College of Materials Science and Engineering, Center for Advanced Low-dimension Materials, Donghua University, 201620, Shanghai, P. R. China. E-mail: sunbin@dhu.edu.cn; zmf@dhu.edu.cn
bDepartment of Applied Chemistry, National Chiao Tung University, 1001 Ta Hsueh Road, Hsin-Chu, 30010, Taiwan. E-mail: kclwang@nctu.edu.tw
First published on 16th May 2017
Abstract
In this work, an amphiphilic perylene diimide (1,7-TEG-PDI-C12) that bears two hydrophilic triethylene glycol (TEG) chains at its bay position, and two hydrophobic dodecyl chains at its imide position was synthesized to identify the roles of concentration and H-bonding on the self-assembly morphology of the amphiphilic PDI. Since 1,7-TEG-PDI-C12 was prepared from the reaction of two bifunctional reactants, TEG and N,N′-bis(n-dodecyl)-1,7-dibromo-perylene-3,4:9,10-tetracarboxylic diimide, careful choices of solvent, base, and the stoichiometry of crown ether and base were found to be critical in reaching high reaction yield under mild conditions. TEM and SEM results revealed the abundant concentration-dependent self-assembly morphologies of 1,7-TEG-PDI-C12. Characterization results including UV-vis, fluorescence, NMR, IR and XRD analysis show that the formation of the self-assembled structure is a synergetic result of the intermolecular π–π interaction and H-bonding of 1,7-TEG-PDI-C12.
Introduction
Over the years, supramolecular self-assembly has attracted increasing attention as an interdisciplinary breakthrough research field in nanotechnology and biological sciences.1 In consideration of their potential applications in diverse fields, supramolecular self-assembly exploits non-covalent interactions between molecules to form miscellaneous architectures.2 Moreover, it offers an attractive pathway to construct well-organized functional nanomaterials, which help bridge the gap between natural and artificial systems.3These nanostructures are cooperatively controlled by noncovalent forces including H-bonding, dipole–dipole attraction, π–π stacking, van der Waals force, hydrophobic effect, electrostatic interaction, and metal–ligand coordination.4 Under the multiple interactions, advanced materials built by supramolecular self-assembly have made some effective progress.3 Shape, size, and intermolecular interactions of the individual building blocks are important factors which drive the self-assembly process toward their supramolecular architecture.5–9
Self-assembly of amphiphilic molecules is usually conducted in the solution phase and is governed by weak non-covalent interactions, which is a fundamental process not only in nature but also in supra-molecular chemistry.1 Despite many efforts, self-assembly of amphiphilic molecules to form complex functional architectures by multi-physical interaction (the synergistic effects of the π–π stacking, hydrophobic effect and the hydrogen bond interaction) represents still a very challenging and unsolved task.10 Moreover, adjustable and controllable ordered structure by multi-physical interaction certainly merit additional study with novel optical and electronic functionalities.11
As good building blocks for self-organized molecular materials with highly ordered structure, perylene diimides (PDI) attract a great interest owing to their applications in diverse fields of physical organic chemistry.4 Up to now, they were widely studied as n-type semiconductors and attracted increasing attention due to their wide optical absorption in the visible to near-infrared spectral region and significant charge transport properties. Therefore, PDI-based materials have been used as prominent chromophores in the fluorescence probe, field effect transistor,12 molecular electronics, solar cells and emitting diodes and other fields owing to their unique spectroscopic properties and extraordinary photostability.13
To achieve better control of the steerable spatial organization of PDIs in solid-state or supramolecular aggregates, significant efforts have been dedicated to develop new amphiphilic PDI derivatives over the past few years.14,15 Based on their molecular structures, the current amphiphilic PDI derivatives can be largely divided into two groups. In the first group, the PDI derivatives have one hydrophobic segment and one hydrophilic segment at the two imide positions of the molecule. In the second group, units with different hydrophilicity are placed at the imide positions and the bay positions of a PDI derivative, respectively. Würthner and coworkers synthesized the wedge- and dumbbell-shaped amphiphilic PDIs16 and reported the first example on the morphological control of PDI nanoaggregates by co-assembly of the two PDI derivatives in aqueous solution. Yao and co-workers17 synthesized an amphiphilic PDI that has two pyridyloxyl groups at the bay position and manipulated the self-assembly morphology of the PDI in solution via changing the protonation state of the pyridyl groups. Baram et al. synthesized an amphiphilic bis-PDI derivative that bears two poly(ethylene oxide) chains at the bay position and manipulated the self-assembly morphology via reversible charging of the bis-PDI derivative.15 Although solution concentration has been known as an important factor in the self-assembly morphology of amphiphilic molecules, its role in the self-assembly of amphiphilic PDIs was not clearly identified in the previous studies, because the roles of concentration were concealed by the more dominating factors such as molecular geometry, ionic interactions, and oxidation states of the PDI molecules.
To reveal the influences of solution concentration on the self-assembly morphology of amphiphilic PDI, in this work, a novel amphiphilic PDI (1,7-TEG-PDI-C12) that bear two hydrophilic triethylene glycol (TEG) chains at its bay position, and two hydrophobic dodecyl chains at its imide position was synthesized according to Scheme 1. Hydroxyl group was kept as the end-group of the TEG segment to introduce H-bond interaction along the lateral direction of the PDI molecule. Careful choices of solvent, base and the stoichiometries of crown ether and base were found to be critical to reach high yield under mild reaction conditions and to avoid polymerization. The change of aggregation states of 1,7-TEG-PDI-C12 was investigated by UV-vis and fluorescence (FL) spectroscopy, and the concentration-dependent self-assembly morphologies of 1,7-TEG-PDI-C12 were studied by scanning electron microscopy (SEM), transmission electron microscopy (TEM), and X-ray diffraction (XRD) analysis. The characterization results reveal the important role of concentration and the bay-position –OH groups in the abundant self-assembly morphologies of amphiphilic PDI molecules.
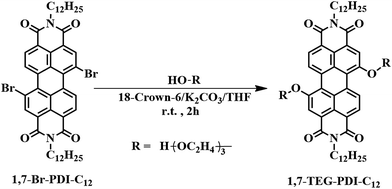 | ||
| Scheme 1 Synthetic conditions of N,N′-bis(n-dodecyl)-1,7-di(triethylene glycol)-perylene-3,4,9,10-tetracarboxyl-diimide (1,7-TEG-PDI-C12). N,N′-Bis(n-dodecyl)-1,7-dibromo-perylene-3,4:9,10-tetracar-boxylic diimide (1,7-Br-PDI-C12) was synthesized according to the literature.18,19 | ||
Results and discussion
Molecular design and synthesis
The synthetic scheme of 1,7-TEG-PDI-C12 is shown in Scheme 1. Although 1,7-disubstituted amphiphilic PDI derivatives have been reported in several works,15,20–23 adding bifunctional substituent, such as TEG, onto 1,7-dibrominated PDI remains unexplored. Because both 1,7-dibrominated PDI and TEG are bifunctional, if the reaction conditions are not optimized, oligo(PDI)s or even poly(PDI) may be generated in the reaction, resulting in the low yield of 1,7-TEG-PDI-C12. To produce 1,7-TEG-PDI-C12 in high yield, an excess amount of TEG (4.5 equiv. to 1,7-Br-PDI-C12) were used, and the reaction conditions were optimized.The influences of solvent, alkali, crown ether and reaction time on the yield of 1,7-TEG-PDI-C12 are summarized shown in Table 1. Due to the low solubility of alkali in organic solvent, the reactions using CHCl3 as a solvent or without the addition of 18-crown-6 did not proceed. The increase of the equiv. of 18-crown-6 or K2CO3 (with respect to the equiv. of 1,7-Br-PDI-C12) improves the reaction yield, as can be seen in entry 8–11. The highest reaction yield of 80% was obtained in entry 12. Comparing the yields of entry 11 and entry 12, the reaction gave almost identical yield at two hours and twelve hours, suggesting the reaction can be completed at room temperature in two hours. The reaction is also sensitive to the basicity of alkali. Entry 4 and entry 5 show that alkali with basicity stronger or weaker than K2CO3 gave lower reaction yield. Changing the alkali from K2CO3 to Na2CO3 (entry 7) also decreased the yield, because 18-crown-6 has a better affinity for potassium cations than sodium cations. 1H NMR, 13C NMR and MALDI-TOF-MS spectra in Fig. S1–S3† confirm the chemical identity of 1,7-TEG-PDI-C12 and the success of the reaction.
| Entry | 18-Crown-6 (equiv.) | Alkali (equiv.) | Solvent | Time [h] | Yield [%] |
|---|---|---|---|---|---|
| 1 | 1.0 | None | THF | 12 | 0 |
| 2 | None | K2CO3 (4.0) | THF | 12 | 0 |
| 3 | 4.0 | K2CO3 (4.0) | CHCl3 | 12 | 0 |
| 4 | 4.0 | KHCO3 (4.0) | THF | 2 | 18 |
| 5 | 4.0 | KOH (4.0) | THF | 2 | 20 |
| 6 | 1.0 | K2CO3 (1.0) | THF | 12 | 45 |
| 7 | 4.0 | Na2CO3 (4.0) | THF | 2 | 57 |
| 8 | 1.0 | K2CO3 (2.0) | THF | 12 | 73 |
| 9 | 1.0 | K2CO3 (4.0) | THF | 12 | 75 |
| 10 | 2.0 | K2CO3 (4.0) | THF | 12 | 77 |
| 11 | 4.0 | K2CO3 (4.0) | THF | 12 | 79 |
| 12 | 4.0 | K2CO3 (4.0) | THF | 2 | 80 |
Photophysical properties of 1,7-TEG-PDI-C12 in solutions
UV-Vis and FL spectra of PDI have been widely used to study the PDI aggregations in the solution phases, due to the sensibility of the spectra to the chromophoric group distance, orientation and therefore.21 Fig. 1a shows the UV-visible absorption spectra of 1,7-TEG-PDI-C12 in CHCl3 at different concentrations. The absorbance of 1,7-TEG-PDI-C12 increases with the increases of solution concentration. The characteristic absorption peaks of PDI appeared at 570, 530 and 492 nm due to π–π* electronic transitions, which represent three electronic vibration levels of 0–0, 0–1 and 0–2, respectively. The absorption peak at 395 nm is derived from the n–π* transition between n electrons of oxygen atom and π-orbital of carbon–carbon double bond of triethylene glycol.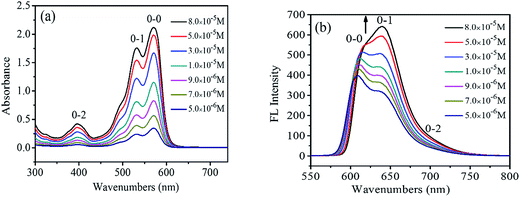 | ||
| Fig. 1 (a) UV-vis absorption spectra and (b) FL spectra of 1,7-TEG-PDI-C12 in CHCl3 at different concentrations. | ||
The FL spectra of 1,7-TEG-PDI-C12 in CHCl3 at different concentrations were recorded in Fig. 1b. At the lower concentrations (5.0 × 10⁻⁶ to 3.0 × 10⁻⁵ mol L−1), the λmax of FL was located at around 604 nm, corresponding to the 0–0 vibronic transition. As the concentration increases, the 0–1 vibronic transition at 639 nm ascends and exceeds the level of 0–0, becoming the main emission peak and following with the gradually red shift in the spectrum. The results suggest that the increase of solution concentration increases the proportion of PDI aggregates in the solution, resulting in the decrease of monomolecular emission and the increase of the aggregation emission.
The UV-vis adsorption spectra of 1,7-TEG-PDI-C12 in hexanol are shown in Fig. 2. The positions of the adsorption bands are similar to those of 1,7-TEG-PDI-C12 in CHCl3. Noteworthy, as the solution concentration increases, the absorbance of the 0–1 vibronic transition gradually becomes higher than that of the 0–0 vibronic transition. It is an indication of strong π–π interaction between the molecules, which reflects the aggregation of 1,7-TEG-PDI-C12. In CHCl3, the absorbance of the 0–0 vibronic transition is always higher than that of the 0–1 transition. Since hexanol has higher polarity than CHCl3, the different concentration dependence thus indicates that aggregation of 1,7-TEG-PDI-C12 can be promoted by the increase of solvent polarity. The FL spectra of 1,7-TEG-PDI-C12 in hexanol are shown in Fig. 2b. The increase of the solution concentration causes great changes in the shape, intensity and the location of the emission band. Fig. 2b and c are used to emphasize the changes in the emission spectra of 1,7-TEG-PDI-C12 at the higher concentrations (3.0 × 10⁻⁶ to 1.0 × 10⁻⁴ mol L−1), and at the lower concentrations (9.0 × 10⁻⁸ to 3.0 × 10⁻⁶ mol L−1), respectively. The FL intensity of 1,7-TEG-PDI-C12 increases first with solution concentration from 9.0 × 10⁻⁸ to 3.0 × 10⁻⁶ mol L−1, but above 3.0 × 10⁻⁶ mol L−1, the further increase of solution concentration decreases the FL intensity. Moreover, the intensity of the 0–0 emission decreases significantly with the increase of solution concentration. At 1.0 × 10⁻⁴ mol L−1, the 0–0 emission almost disappeared, and the unimodal FL band, which has a significant red shift was observed. The quench of the FL occurs because the short-wavelength FL band (535 nm) overlapped with the absorption band of 1,7-TEG-PDI-C12 at 527 nm. At the higher concentrations, self-quenching of FL becomes more significant and decreases the FL intensity. Moreover, 1,7-TEG-PDI-C12 molecules aggregate at high solution concentration. Since the FL intensity of aggregates are weaker, a decline in the overall FL intensity was observed.24
Solvent, concentration and temperature effects on the 1,7-TEG-PDI-C12 aggregates
Fig. 3a shows the normalized UV absorption spectra of the hexanol solution and the CHCl3 solution of 1,7-TEG-PDI-C12 at the same concentration (8.0 × 10⁻⁵ mol L−1). The ratio of the absorption maxima of the 0–1 vibronic transition (A0–1) and the absorption maxima of the 0–0 vibronic transition (A0–0), i.e. A0–1/A0–0, is used to qualitatively evaluate the proximity of the PDI units in solution. As indicated by Fimmel et al.25 PDI foldamers in the folded state give a higher A0–1/A0–0 ratio than those in the unfolded state. In other words, a closer PDI aggregate in solution leads to the increase of the A0–1/A0–0 ratio. Accordingly, because in Fig. 3a, the A0–1/A0–0 ratio of 1,7-TEG-PDI-C12 is larger in hexanol than it is in CHCl3, it can be found that hexanol promotes the aggregate of 1,7-TEG-PDI-C12 more than CHCl3 does.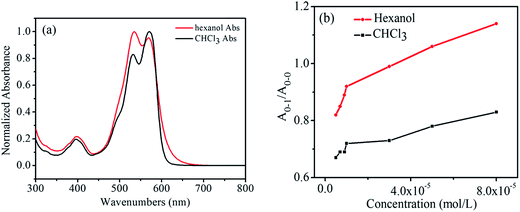 | ||
| Fig. 3 (a) Normalized UV-visible absorption spectra of 1,7-TEG-PDI-C12 at 8.0 × 10⁻⁵ mol L−1; (b) the A0–1/A0–0 ratios of 1,7-TEG-PDI-C12 at different concentrations in CHCl3 and hexanol. | ||
In Fig. 3b, the A0–1/A0–0 ratio of the hexanol and CHCl3 solutions of 1,7-TEG-PDI-C12 also increases as the solution concentration increases. Besides, in the 1H-NMR spectra (Fig. 4), the proton signals of the perylene core (at 10.0–8.0 ppm) shows clear upfield shifts as the solution concentration increases. The upfield shift of these protons also supports that the increased solution concentration promotes a more proximal packing of 1,7-TEG-PDI-C12 molecules in solution. Based on the UV-vis and 1H-NMR results, it is evident that 1,7-TEG-PDI-C12 molecules are more strongly aggregate, and experience stronger intermolecular interactions at higher solution concentrations.
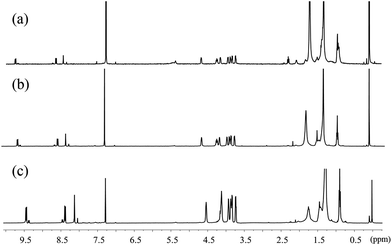 | ||
| Fig. 4 1H-NMR spectra of 1,7-TEG-PDI-C12 in CDCl3 at concentrations of (a) 1.0 × 10⁻⁵ mol L−1, (b) 5.0 × 10⁻⁵ mol L−1, and (c) 1.0 × 10⁻⁴ mol L−1. | ||
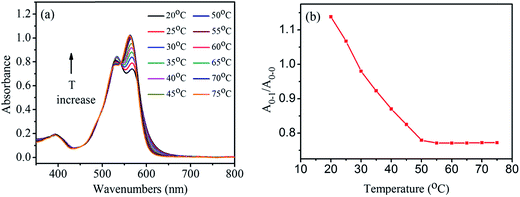
To study how temperature affects the aggregates, the absorption spectra of 1,7-TEG-PDI-C12 solution in hexanol (8.0 × 10⁻⁶ mol L−1) were measured at temperatures from 20 °C to 75 °C. As shown in Fig. 5a, the increase of solution temperature decreases the A0–1/A0–0 ratio of the 1,7-TEG-PDI-C12 solution. Fig. 5b schematically displays the temperature dependence of the A0–1/A0–0 ratios. The increase of the thermal energy thus interrupts the intermolecular interaction and disrupts aggregate state of 1,7-TEG-PDI-C12.
Self-assembled morphologies of 1,7-TEG-PDI-C12 via rapid solution mixing method
In the previous sections, the UV-vis and 1H NMR results have shown that 1,7-TEG-PDI-C12 molecules aggregate differently at different solution concentrations. To study the influences of solution concentration on the self-assembled morphology of 1,7-TEG-PDI-C12, 100 μL of the THF solutions of 1,7-TEG-PDI-C12 at concentrations of 1 × 10⁻⁵ mol L−1, 1 × 10⁻⁴ mol L−1, and 1 × 10⁻³ mol L−1 were directly mixed with 3 mL of distilled water to reach the volume ratio of VTHF/Vwater = 1/30, and then balanced under room temperature for 24 hours. In Fig. 6, the different A0–1/A0–0 ratios of the THF solutions of 1,7-TEG-PDI-C12 indicate that 1,7-TEG-PDI-C12 molecules are at different aggregation states at the concentrations of 1 × 10⁻⁵ mol L−1, 1 × 10⁻⁴ mol L−1, and 1 × 10⁻³ mol L−1. Rapidly mixing these THF solutions with large amount of water, which is a poor solvent for 1,7-TEG-PDI-C12, allows the observation of the concentration effects on the self-assembly morphology of 1,7-TEG-PDI-C12.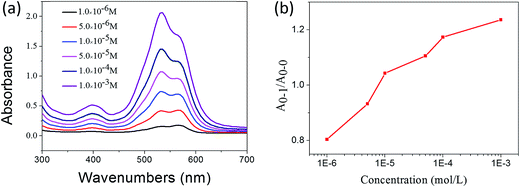 | ||
| Fig. 6 (a) The UV-visible absorption spectra of the THF solutions of 1,7-TEG-PDI-C12 at different concentrations; (b) the concentration dependence of the A0–1/A0–0 ratio of the THF solutions. | ||
The TEM images for the 1,7-TEG-PDI-C12 aggregates formed at the three concentrations are shown in Fig. 7. 1,7-TEG-PDI-C12 molecules self-assemble into thin nanofibers at the low concentration (Fig. 7a), nanotubes or nanosheet at the medium concentration (Fig. 7b), and nanoparticles at the high concentration (Fig. 7c). The enlarged images for the nanotube and the π–π stacking in a nanoparticle are shown in Fig. 8a and b, respectively. The evidently different morphologies in Fig. 7 indicate the important role of concentration in the self-assembly behaviors of 1,7-TEG-PDI-C12. The UV-vis absorption spectra in Fig. 6a show that the proportion of 1,7-TEG-PDI-C12 aggregates in THF solution increases with the solution concentration. Thus, when dispersed into water, 1,7-TEG-PDI-C12 molecules in THF solution are more exposed to the surrounding water molecules at the lower solution concentrations than at the higher concentrations. This may be the reason why at the lower solution concentration (1 × 10⁻⁵ mol L−1), 1,7-TEG-PDI-C12 molecules in the less aggregated state formed thin nanofibers with more surface area exposed to the surrounding water molecules, whereas at the higher concentrations (1 × 10⁻⁴ mol L−1, and 1 × 10⁻³ mol L−1), the molecules assembled into nanotubes, nanoplates, and nanoparticles because of the increased proportion of the 1,7-TEG-PDI-C12/1,7-TEG-PDI-C12 aggregates, and the decreased proportion of the 1,7-TEG-PDI-C12/water interaction.
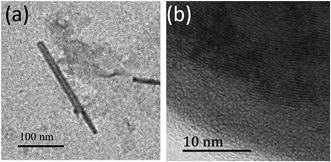 | ||
| Fig. 8 The enlarged TEM images of (a) the nanotube in Fig. 7b and (b) the π–π stacking in the nanosphere in Fig. 7c. | ||
Self-assemble morphology of 1,7-TEG-PDI-C12 under slow liquid–liquid diffusion
To study the self-assembly morphology of 1,7-TEG-PDI-C12 developed under the slow THF/water mixing process, as illustrated in Fig. 9a, the THF solution of 1,7-TEG-PDI-C12 (1 × 10⁻³ mol L−1) was carefully added to the top of the water to allow the slow diffusion of the THF solution into water. As shown in Fig. 9b, purple fibers grow and align perpendicular to the THF/water interface, as the THF solution diffuse into the water. Compared to the rapid solution mixing method, which produces a powder of 1,7-TEG-PDI-C12, the slow liquid–liquid diffusion method gives solid sample of 1,7-TEG-PDI-C12 with larger sizes and more continuous morphology. The optical microscope (OM) image, and polarized light optical microscope (POM) image, and SEM images of the fibers are shown in Fig. 10. In Fig. 10a, the fibers show birefringence under POM, indicating that 1,7-TEG-PDI-C12 molecules form ordered packing in the fibers. The XRD pattern of the fibers is shown in Fig. 11. The four diffraction peaks at the lower 2θ angle have d-spacing of 34.9 Å, 20.0 Å, 17.4 Å, and 13.1 Å, respectively. The reciprocal ratio for the d-spacing of the peaks is 1![[thin space (1/6-em)]](https://www.rsc.org/images/entities/char_2009.gif) :
:![[thin space (1/6-em)]](https://www.rsc.org/images/entities/char_2009.gif) √3
√3![[thin space (1/6-em)]](https://www.rsc.org/images/entities/char_2009.gif) :
:![[thin space (1/6-em)]](https://www.rsc.org/images/entities/char_2009.gif) √4
√4![[thin space (1/6-em)]](https://www.rsc.org/images/entities/char_2009.gif) :
:![[thin space (1/6-em)]](https://www.rsc.org/images/entities/char_2009.gif) √7, indicating that 1,7-TEG-PDI-C12 molecules pack into a hexagonal columnar phase with a = b = 40.3 Å, and γ = 120°. In addition, a broad diffraction hump with d-spacing of 3.49 Å, showing the π–π stacking of the 1,7-TEG-PDI-C12 molecules, was also observed at the higher 2θ angle. The lateral dimension of the hexagonal lattice matches with the lateral dimension of a 1,7-TEG-PDI-C12 molecule. Thus, it is confirmed that the purple fibers formed in the slow liquid–liquid diffusion process are constructed with the columns of 1,7-TEG-PDI-C12 molecules that are arranged in the hexagonal lattice.
√7, indicating that 1,7-TEG-PDI-C12 molecules pack into a hexagonal columnar phase with a = b = 40.3 Å, and γ = 120°. In addition, a broad diffraction hump with d-spacing of 3.49 Å, showing the π–π stacking of the 1,7-TEG-PDI-C12 molecules, was also observed at the higher 2θ angle. The lateral dimension of the hexagonal lattice matches with the lateral dimension of a 1,7-TEG-PDI-C12 molecule. Thus, it is confirmed that the purple fibers formed in the slow liquid–liquid diffusion process are constructed with the columns of 1,7-TEG-PDI-C12 molecules that are arranged in the hexagonal lattice.
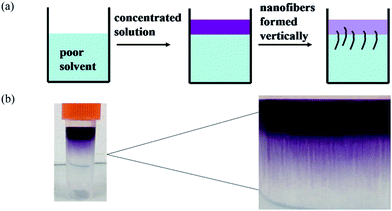 | ||
| Fig. 9 (a) The illustration and (b) the experimental image of the thick nanofibers prepared via the slow solvent-diffusion of the THF solution of 1,7-TEG-PDI-C12 (1 × 10⁻³ mol L−1) into water. | ||
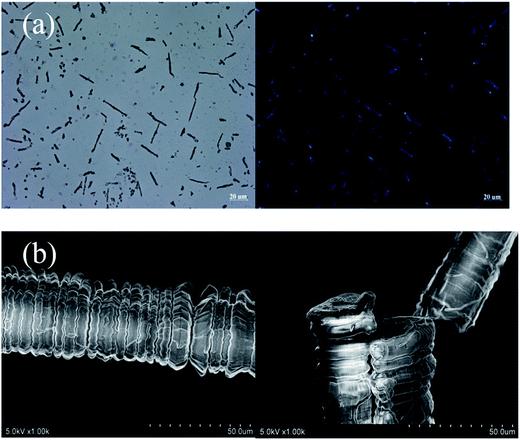 | ||
| Fig. 10 (a) OM (left) and POM (right) images, and (b) SEM images of the 1,7-TEG-PDI-C12 fibers prepared from the slow liquid–liquid diffusion method. | ||
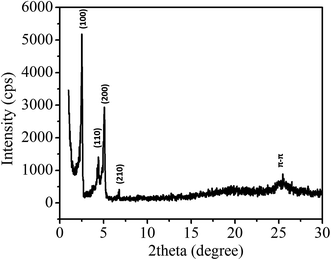 | ||
| Fig. 11 XRD pattern of the 1,7-TEG-PDI-C12 fibers prepared from the slow liquid–liquid diffusion method. | ||
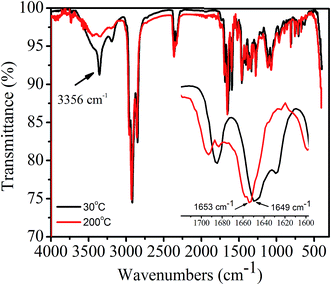
In order to confirm whether or not intermolecular H-bonding is present in 1,7-TEG-PDI-C12 aggregates, as shown in Fig. 12, the IR absorption spectra of 1,7-TEG-PDI-C12 were measured at 30 °C and 200 °C, respectively. At 30 °C, the absorption band at 3356 cm−1 indicating the presence of H-bonding among the PDI molecules. The decrease of the absorption intensity at 3356 cm−1 and the increase of the wavenumber of the C![[double bond, length as m-dash]](https://www.rsc.org/images/entities/char_e001.gif) O stretching at high temperature further confirmed that the intermolecular H-bonds are disrupted by the enhanced thermal motion of 1,7-TEG-PDI-C12 at high temperature.
O stretching at high temperature further confirmed that the intermolecular H-bonds are disrupted by the enhanced thermal motion of 1,7-TEG-PDI-C12 at high temperature.
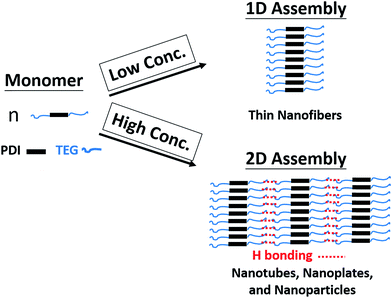
Since both π–π interaction and hydrogen bonding are involved in the self-assembly process of 1,7-TEG-PDI-C12, a model intending to explain the concentration-dependent self-assembled morphologies of 1,7-TEG-PDI-C12 was proposed and shown in Fig. 13. In the fast solution mixing process, the formation of the thin nanofibers at the lower solution concentration suggests that π–π interaction works as the driving force for the formation of the 1D stacking of the 1,7-TEG-PDI-C12 molecules. The nanotubes, nanoplates and nanospheres were not observed at this concentration because the formation of 2D assembly structure requires additional 1,7-TEG-PDI-C12/1,7-TEG-PDI-C12 H-bonding along the lateral direction. Therefore, the formation of the 2D assembly structures requires higher 1,7-TEG-PDI-C12 concentrations or slower liquid–liquid diffusion process, so that the 1,7-TEG-PDI-C12 molecules can either pre-aggregate in the THF solution, or have sufficient time to develop the lateral hydrogen bonds with their neighboring molecules to form the 2D structures. Otherwise, the thin nanofibers will be simply surrounded by water molecules and have only limited lateral dimensions. In Fig. 10b, another interesting feature of the 1,7-TEG-PDI-C12 fibers developed under slow liquid–liquid diffusion process is the uneven surface of fibers. The enlarged SEM image near the tip of a fiber shows that the macroscopic structure of the 1,7-TEG-PDI-C12 fiber is similar to the shape of a Chinese herb, Cordyceps sinensis, or like a stack of flat plates, which have diameters around 15 μm. Such self-assembled morphology was not reported in the literature for the PDI derivatives. Mechanism regarding how the π–π interaction and H-bonding of 1,7-TEG-PDI-C12 synergetically assemble the molecules into this macroscopic structure will be further studied.
Conclusions
In this study, the synthesis and self-assembly behaviors of an amphiphilic PDI derivative, 1,7-TEG-PDI-C12, which contains –OH groups at its bay positions were studied. The difficulty in adding the bifunctional TEG substituents onto the bay position of 1,7-dibrominated PDI in high yield was overcome by the careful choice of base, and the optimization of the reaction conditions. Under the synergetic effects of π–π interaction and hydrogen bonding, 1,7-TEG-PDI-C12 demonstrated abundant concentration-dependent self-assembly morphologies. Nanofibers, nanotubes, nanoplates and nanospheres were observed form samples prepared from the solutions of 1,7-TEG-PDI-C12 at different concentrations. Although Yao and co-workers17 have observed that the amphiphilic PDI can self-assemble into nanoplates and nanoparticles in MeOH/H2O solution, and Baram et al.15 have reported the self-assembled nanofibers and nanospheres of an amphiphilic bis-PDI derivative; the transformation of the self-assembled morphologies requires either dynamically protonating a 1,7-bis(pyridyloxyl)PDI derivative or reversible charging of the bis-PDI derivative. The roles of solution concentration and the bay-position –OH groups in the self-assembled morphology of amphiphilic PDI derivatives have never been investigated to the best of our knowledge. Our study reveals the importance of concentration and bay-position –OH groups in the formation of lateral TEG-PDI-C12/1,7-TEG-PDI-C12 hydrogen bonds, which are critical in the formation of 2D assembly morphology, and provides a facile physical methodology to manipulate the assembly morphology of amphiphilic PDI molecules.Acknowledgements
This work was supported by the Program for Changjiang Scholars and Innovative Research Team in University (T2011079, IRT1221), Science and Technology Commission of Shanghai Municipality (16JC1400700).References
- S. S. Babu, V. K. Praveen and A. Ajayaghosh, Chem. Rev., 2014, 114, 1973–2129 CrossRef CAS PubMed
.
- S. Chen, P. Slattum, C. Wang and L. Zang, Chem. Rev., 2015, 115, 11967–11998 CrossRef CAS PubMed
.
- Y. Li, T. Liu, H. Liu, M. Z. Tian and Y. Li, Acc. Chem. Res., 2014, 47, 1186–1198 CrossRef CAS PubMed
.
- F. Wurthner, Chem. Commun., 2004, 1564–1579 RSC
.
- P. D. Frischmann, K. Mahata and F. Wurthner, Chem. Soc. Rev., 2013, 42, 1847–1870 RSC
.
- Y. Shao, G.-Z. Yin, X. Ren, X. Zhang, J. Wang, K. Guo, X. Li, C. Wesdemiotis, W.-B. Zhang, S. Yang, M. Zhu and B. Sun, RSC Adv., 2017, 7, 6530–6537 RSC
.
- Y. Shao, X. Zhang, K. Liang, J. Wang, Y. Lin, S. Yang, W.-B. Zhang, S. Yang, M. Zhu and B. Sun, RSC Adv., 2017, 7, 16155–16162 RSC
.
- S. L. Wu, C. Y. Hong, K. Y. Wu, S. T. Lan, C. T. Hsieh, H. L. Chen and C. L. Wang, Chem.–Asian J., 2016, 11, 2011–2015 CrossRef CAS PubMed
.
- W. W. Liang, C. F. Huang, K. Y. Wu, S. L. Wu, S. T. Chang, Y. J. Cheng and C. L. Wang, Chem. Sci., 2016, 7, 2768–2774 RSC
.
- D. Meng, D. Sun, C. Zhong, T. Liu, B. Fan, L. Huo, Y. Li, W. Jiang, H. Choi, T. Kim, J. Y. Kim, Y. Sun, Z. Wang and A. J. Heeger, J. Am. Chem. Soc., 2016, 138, 375–380 CrossRef CAS PubMed
.
- Y. Huang, J. Wang, H. Zhai, L. Zhu and Z. Wei, Soft Matter, 2014, 10, 7920–7924 RSC
.
- K. Balakrishnan, A. Datar, T. Naddo, J. Huang, R. Oitker, M. Yen, J. Zhao and L. Zang, J. Am. Chem. Soc., 2006, 128, 7390–7398 CrossRef CAS PubMed
.
- P. R. L. Malenfant, C. D. Dimitrakopoulos, J. D. Gelorme, L. L. Kosbar, T. O. Graham, A. Curioni and W. Andreoni, Appl. Phys. Lett., 2002, 80, 2517–2519 CrossRef CAS
.
- P. Rajasingh, R. Cohen, E. Shirman, L. J. Shimon and B. Rybtchinski, J. Org. Chem., 2007, 72, 5973–5979 CrossRef CAS PubMed
.
- J. Baram, E. Shirman, N. Ben-Shitrit, A. Ustinov, H. Weissman, I. Pinkas, S. G. Wolf and B. Rybtchinski, J. Am. Chem. Soc., 2008, 130, 14966–14967 CrossRef CAS PubMed
.
- X. Zhang, Z. Chen and F. Würthner, J. Am. Chem. Soc., 2007, 129, 4886–4887 CrossRef CAS PubMed
.
- Z. Zhang, C. Zhan, X. Zhang, S. Zhang, J. Huang, A. D. Li and J. Yao, Chem.–Eur. J., 2012, 18, 12305–12313 CrossRef CAS PubMed
.
- Y. Chen, Y. Feng, J. Gao and M. Bouvet, J. Colloid Interface Sci., 2012, 368, 387–394 CrossRef CAS PubMed
.
- L. Fan, Y. Xu and H. Tian, Tetrahedron Lett., 2005, 46, 4443–4447 CrossRef CAS
.
- X. Zhang, S. Pang, Z. Zhang, X. Ding, S. Zhang, S. He and C. Zhan, Tetrahedron Lett., 2012, 53, 1094–1097 CrossRef CAS
.
- D. Ke, C. Zhan, S. Xu, X. Ding, A. Peng, J. Sun, S. He, A. D. Li and J. Yao, J. Am. Chem. Soc., 2011, 133, 11022–11025 CrossRef CAS PubMed
.
- Y. Tsarfati, V. Strauss, S. Kuhri, E. Krieg, H. Weissman, E. Shimoni, J. Baram, D. M. Guldi and B. Rybtchinski, J. Am. Chem. Soc., 2015, 137, 7429–7440 CrossRef CAS PubMed
.
- G. Golubkov, H. Weissman, E. Shirman, S. G. Wolf, I. Pinkas and B. Rybtchinski, Angew. Chem., Int. Ed., 2009, 48, 926–930 CrossRef CAS PubMed
.
- A. E. Clark, C. Qin and A. D. Li, J. Am. Chem. Soc., 2007, 129, 7586–7595 CrossRef CAS PubMed
.
- B. Fimmel, M. Son, Y. M. Sung, M. Grüne, B. Engels, D. Kim and F. Würthner, Chem.–Eur. J., 2015, 21, 615–630 CrossRef CAS PubMed
.
Footnotes |
| † Electronic supplementary information (ESI) available: The synthetic details, 1H NMR, 13C NMR and mass spectra of 1,7-TEG-PDI-C12 are available. See DOI: 10.1039/c7ra04296e |
| ‡ These authors contribute equally to the work. |
| This journal is © The Royal Society of Chemistry 2017 |


