DOI:
10.1039/C7RA04271J
(Paper)
RSC Adv., 2017,
7, 29883-29898
Investigation of myrrh extract as a new corrosion inhibitor for α-brass in 3.5% NaCl solution polluted by 16 ppm sulfide
Received
15th April 2017
, Accepted 25th May 2017
First published on 8th June 2017
Abstract
This study investigates the performance of myrrh plant extract as a corrosion inhibitor for a copper–zinc alloy in 3.5 wt% NaCl solution polluted by 16 ppm sulfide. The inhibition behavior was determined through a gravimetric method, electrochemical measurements, AFM, UV spectroscopy and FTIR. The results demonstrated that the efficiency of inhibition increases with increasing concentration of the myrrh extract and decreases with temperature. The corrosion rate of a copper –zinc alloy was decreased in the presence of myrrh extract. The corrosion inhibition efficiency was found to increase with myrrh concentration to a value of 67% at 300 ppm and 25 °C. The thermodynamic activation parameters that govern the process were deduced from the temperature dependence. Potentiodynamic polarization curves indicated that the myrrh extract behaves as a mixed-type inhibitor. This extract was adsorbed on a copper alloy surface following the Langmuir adsorption isotherm and a kinetic model adsorption isotherm. The adsorption free energy of the myrrh extract on the copper zinc alloy reveals a physical adsorption of myrrh on the alloy surface. The results of atomic force microscopy, and Fourier transform infrared and UV-visible spectrophotometric methods support the electrochemical measurements and gravimetric method.
1. Introduction
Corrosion of copper and its alloys has attracted much attention from many researchers because copper and its alloys have a wide variety of applications in industry and technology which we use extensively in many types of chemical equipment including pumps, valves, evaporators, fans and fractionating columns. Large quantities of pipes made out of copper and copper alloys are used to make heat exchangers and condensers, where fresh or salt water is used for cooling. Use in all of these applications is because copper and its alloys have thermal and electrical conductivity, and also they have good mechanical workability, low cost and excellent resistance to corrosion in neutral aggressive media. For this reason and because electrodissolution of copper in chloride solutions is important in electropolishing and electromachining, there is an interest in inhibitors that can be used in marine environments.1–5 The pollution of seawater with sulfide in coastal areas can occur due to bacteriological and biological processes taking place in seawater and also because of industrial waste water discharge into the sea. Thus, corrosion of copper alloys in seawater polluted with sulfide ions is a serious problem.
Alloys of copper have sufficient resistance to corrosion in seawater. However, they corrode under special conditions. The anodic dissolution mechanism of brass in neutral chloride media can be demonstrated as follows: in the first stage of corrosion, a ZnO layer is formed on the brass surface via the reaction:
or
| Zn + 4Cl− → ZnCl42− + 2e− |
In the presence of chloride, cuprous ions are stable, and this species forms CuCl, which will then be transformed into CuCl2− ions.6,7
The presence of CuCl
2− at the metal surface leads to the formation of Cu
2O
8| 2CuCl2− + H2O → Cu2O + 4Cl− + 2H+ |
Sulfide is considered as the common pollutant which causes intensive corrosion of copper alloys in seawater where the presence of sulfide ions leads to the modification of the oxide layer on copper based alloys and acceleration of corrosion is due to the enhancement of the cathodic process. From the important parameters playing a major part in the processes of corrosion of copper alloys in seawater polluted with sulfides, one of the most important is their concentration.9,10 The corrosion mechanism of copper in sulfide containing medium will be presented by the following equations:11,12
In the presence of sulfide, HS− will be formed:
Combination of HS− with copper:
Anodic dissolution of copper:
Finally, dissociation and recombination processes:
| 2Cu+ + HS− + OH− → Cu2S + H2O |
The overall reaction:
| 4Cu +2S2− + O2 + 2H2O ↔ 2Cu2S + 4OH− |
The use of inhibitors is one of the techniques for minimizing corrosion. The effectiveness of the inhibitors varies with their concentrations, the corrosive medium and the surface properties of the alloy. Many inhibitors have been used to minimize the corrosion of brass in different media.13–18 Natural products of plant origin are readily available, inexpensive, and eco-friendly corrosion inhibitors.19–21 Extracts from their leaves, barks, seeds, and roots are composed of a mixture of organic compounds and some have been reported as effective inhibitors for various metals and alloys. These organic compounds usually contain polar functions with nitrogen, sulfur or oxygen atoms and have triple or conjugated double bonds with aromatic rings in their molecular structures, which are the major adsorption centers.22,23
The aim of this paper is to explore, for the first time, the use of myrrh extract as a corrosion inhibitor for α-brass in 3.5% NaCl solution polluted by 16 ppm sulfide.
2. Materials and methods
2.1 Materials
The chemical composition of the used α-brass (weight%) is Cu 67.28, Pb 0.029, Fe 0.002 and Zn 32.689. First, the samples were mechanically cut and prepared into five pieces each of dimensions 20 × 20 × 1 mm. Electrodes for electrochemical studies were embedded in Araldite with an exposed surface area of 1 cm2. The exposed area of the electrode was abraded by different grades of emery papers (grades 320–1200), then rinsed and dried according to the standard methods.24 In this study, the solutions used were prepared with reagent grade chemicals. The standard aggressive medium was 3.5 wt% NaCl. The sulfide ions S2− were introduced as Na2S in this solution to a concentration of 16 ppm.
2.2 Chemical composition of myrrh extract
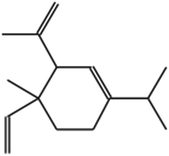
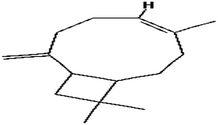
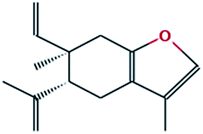
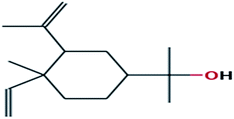
The plant has been extensively studied and its chemical composition is well known.25,26 Table 1 demonstrates the main chemical compounds detected as essential oils in myrrh by GCMS.
Table 1 Names, structural formulas and molecular weights for the investigated extract
| No. |
Name |
Chemical structure |
Formula |
MW |
% composition |
| 1 |
Cyclohexene, 4-ethenyl-4-methyl-3-(1-methylethenyl)-1-(1methylethyl)-, (3R-trans)- |
 |
C15H24 |
204 |
0.3342 |
| 2 |
Longifolene-(V4) |
 |
C15H24 |
204 |
4.048 |
| 3 |
Caryophyllene |
 |
C15H24 |
204 |
0.2976 |
| 4 |
1,4-Methanoazulene, decahydro-4,8,8-trimethyl-9-methylene-, [1S-(1à,3aá,4à,8aá)]- |
 |
C15H24 |
204 |
1.047 |
| 5 |
1,6-Cyclodecadiene, 1-methyl-5-methylene-8-(1-methylethyl)-, [s-(E,E)]- |
 |
C15H24 |
204 |
0.3498 |
| 6 |
Naphthalene, 1,2,3,5,6,7,8,8a-octahydro-1,8a-dimethyl-7-(1-methylethenyl)-, [1S-(1à,7à,8aà)]- |
 |
C15H24 |
204 |
0.3874 |
| 7 |
Benzofuran, 6-ethenyl-4,5,6,7-tetrahydro-3,6-dimethyl-5-isopropenyl-, trans- |
 |
C15H20O |
216 |
26.63 |
| 8 |
1H-Cycloprop[e]azulene, decahydro-1,1,7-trimethyl-4-methylene-, [1aR-(1aà, 4aá,7à,7aá,7bà)] |
 |
C15H24 |
204 |
0.5777 |
| 9 |
meso-Hydrobenzoin |
 |
C14H14O2 |
214 |
0.3437 |
| 10 |
9(1H)-Phenanthrenone, 2,3,4,4a,10,10a-hexahydro-4a-methyl-, cis- |
 |
C15H18O |
214 |
49.41 |
| 11 |
Benzenemethanol, 3-methoxy-a-phenyl- |
 |
C14H14O2 |
214 |
13.79 |
| 12 |
Cyclohexanemethanol, 4-ethenyl-à,à,4-trimethyl-3-(1-methylethenyl)-, [1R-(1à,3à,4á)]- |
 |
C15H26O |
222 |
0.6306 |
| 13 |
Testosterone |
 |
C19H28O2 |
288 |
2.154 |
2.3 Preparation of myrrh
Myrrh extract was obtained directly from myrrh powder. Myrrh was soaked in methanol and left standing for 5 days. The solution was filtered and further distilled at 40 °C to remove the methanol from the myrrh solution extracts and then concentrated to dryness. 1 g was taken from the extract and dissolved in 1000 ml of water to give a concentration of 1000 ppm; the corrosive medium is a solution of 3.5% NaCl + 16 ppm sulfide. Different volumes were taken from the stock solution of myrrh extract (1000 ppm) to prepare different concentrations of extract with corrosive medium.
2.4 Gravimetric method
The corrosion rates of α-brass were calculated by considering the total affected sample area and immersion time. The test samples were weighed and immersed in 50 mL of 3.5% NaCl polluted by 16 ppm sulfide in the absence and presence of varying concentrations of myrrh extract (50–300 ppm), taken in a beaker at temperatures 25–55 °C maintained in a thermostat water bath. The α-brass pieces were weighed and suspended in the beaker with the help of hooks. Each piece was taken out of the test solution, rinsed and dried according to the standard method.24 The difference in weight for an exposure time of 4 hours was taken as the total weight loss. In order to get good results, the experiments were carried out in triplicate. From the average weight loss results, the corrosion rate, the percentage of inhibition efficiency (% IE) and the degree of surface coverage (θ) were calculated using the following equations:| | |
Corrosion rate = ΔW/At
| (1) |
| | |
(% IE) = θ × 100 = [(W1 − W2)/W1] × 100
| (2) |
where ΔW is the weight loss in mg, A is the area of the specimen in cm2 and t is the exposure time in min, and where W2 and W1 are the weight losses for the α-brass sample in the presence and absence of the myrrh extract.
2.5 Electrochemical measurements
We carried out the electrochemical measurements by using a conventional cell with three electrodes. The α-brass was the working electrode, the counter electrode was Pt wire and the reference electrode was a saturated calomel electrode (SCE). The electrochemical measurements were performed using a Gamry Instrument (PCI 300/4) Potentiostat/Galvanostat/ZRA. This instrument includes a Gamry framework system based on the ESA 400. Gamry inclusive DC105 software was used for potentiodynamic polarization measurements, and EFM 140 software was used for electrochemical frequency modulation measurements along with a computer for collecting data and EIS300 software for electrochemical impedance spectroscopy. For plotting, graphing, and fitting data, Echem Analyst 6.03 software was used.
2.6 FTIR analysis
FTIR analysis was carried out to determine the functional groups present in the solutions of the 300 ppm myrrh extract + 3.5% NaCl solution polluted by 16 ppm sulfide, and the other analysis for functional groups present in the 300 ppm myrrh extract + 3.5% NaCl polluted by 16 ppm sulfide after the specimen of α-brass was immersed for 24 h. FTIR analysis was carried out using a FT/IR-4100 type A serial number B117761016.
2.7 UV-visible spectroscopy
The UV-visible absorption spectra of a solution of 3.5% NaCl polluted by 16 ppm sulfide containing 300 ppm myrrh extract before and after immersion of the α-brass for 24 h was studied.
2.8 AFM analysis
The analysis of AFM is one of the major analyses of the surface study, which is used for further investigation of the formation of a protective film on the surface of the α-brass. Atomic force microscopy (AFM) was used to investigate the topography of the α-brass surface immersed for one day in 3.5% NaCl polluted by 16 ppm sulfide in the absence and presence of 300 ppm myrrh extract.
3. Results and discussion
3.1 Gravimetric measurements
The data of the corrosion rate were plotted against different concentrations of the myrrh extract in 3.5% NaCl polluted by 16 ppm sulfide, as shown in Fig. 1. The corrosion rate values of α-brass decrease when the concentration of myrrh extract increases and the magnitude of surface coverage and adsorption by extracts on the α-brass surface increases with concentration of the myrrh extract. Fig. 2 demonstrates that the inhibition efficiency increases with increasing concentration of myrrh extract. Tables 2 and 3 include the experimental data of weight loss (ΔW), percentage of inhibition efficiency (% IE), corrosion rate (C.R.) and degree of surface coverage (θ) for α-brass in 3.5% NaCl + 16 ppm sulfide in the absence and presence of various concentrations of myrrh extract at different temperatures (25–55 °C).
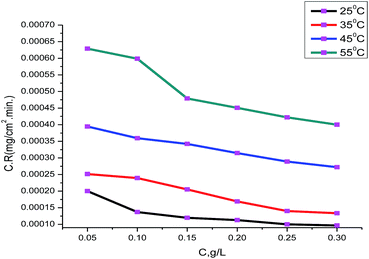 |
| | Fig. 1 Corrosion rates of various concentrations of myrrh extract on α-brass in 3.5% NaCl + 16 ppm sulfide at 25–55 °C. | |
 |
| | Fig. 2 The variation of inhibition efficiency with myrrh extract concentration of α-brass in 3.5% NaCl + 16 ppm sulfide solutions. | |
Table 2 Data of weight loss of α-brass in a solution of 3.5% NaCl polluted by 16 ppm sulfide for various concentrations of myrrh extract after 180 min, at (25, 35 °C)
| Conc., ppm |
25 °C |
35 °C |
| ΔW, mg cm−2 |
θ |
% IE |
C.R., mg cm−2 min−1 |
ΔW, mg cm−2 |
θ |
% IE |
C.R., mg cm−2 min−1 |
| Blank |
0.053 |
— |
— |
0.00030 |
0.066 |
|
|
0.00037 |
| 0.05 |
0.034 |
0.360 |
36.0 |
0.00020 |
0.044 |
0.338 |
33.8 |
0.00025 |
| 0.10 |
0.025 |
0.536 |
53.6 |
0.00014 |
0.039 |
0.409 |
40.9 |
0.00024 |
| 0.15 |
0.022 |
0.594 |
59.4 |
0.00012 |
0.037 |
0.443 |
44.3 |
0.00021 |
| 0.20 |
0.020 |
0.618 |
61.8 |
0.00011 |
0.030 |
0.541 |
54.1 |
0.00017 |
| 0.25 |
0.018 |
0.660 |
66.0 |
0.00010 |
0.025 |
0.621 |
62.1 |
0.00014 |
| 0.30 |
0.017 |
0.672 |
67.0 |
0.00009 |
0.024 |
0.636 |
63.6 |
0.00013 |
Table 3 Data of weight loss of α-brass in a solution of 3.5% NaCl polluted by 16 ppm sulfide for various concentrations of myrrh extract after 180 min, at (45, 55 °C)
| Conc., ppm |
45 °C |
55 °C |
| ΔW, mg cm−2 |
θ |
% IE |
C.R., mg cm−2 min−1 |
ΔW, mg cm−2 |
θ |
% IE |
C.R., mg cm−2 min−1 |
| Blank |
0.106 |
— |
— |
0.00059 |
0.146 |
— |
— |
0.00081 |
| 0.05 |
0.071 |
0.331 |
33.1 |
0.00039 |
0.113 |
0.224 |
22.4 |
0.00063 |
| 0.10 |
0.065 |
0.391 |
39.1 |
0.00036 |
0.108 |
0.261 |
26.1 |
0.00060 |
| 0.15 |
0.062 |
0.42 |
42 |
0.00034 |
0.086 |
0.409 |
40.9 |
0.00048 |
| 0.20 |
0.057 |
0.467 |
46.7 |
0.00031 |
0.081 |
0.444 |
44.4 |
0.00045 |
| 0.25 |
0.052 |
0.509 |
50.9 |
0.00029 |
0.076 |
0.479 |
47.9 |
0.00042 |
| 0.30 |
0.049 |
0.538 |
53.8 |
0.00027 |
0.072 |
0.507 |
50.7 |
0.00040 |
Adsorption isotherm. The action of inhibition in solutions containing 3.5% NaCl +16 ppm sulfide is a result of adsorption at the α-brass/solution interface. The adsorption mode will be dependent on different factors such as the extract composition, chemical changes to the extract and the nature of the surface charge on the metal. For obtaining the adsorption isotherm, the degree of surface coverage (θ) of the extract must be calculated. Many mathematical expressions have thus been developed to take into consideration non-ideal effects. The most used isotherms are Frumkin, Temkin, De Boer, Parsons, Flory–Huggins and Bockris–Swinkels.27–31 The values of surface coverage (θ) corresponding to different concentrations of myrrh extract at different temperatures (25–55 °C) have been used to determine the best adsorption isotherm. Fig. 3 and 4 confirm that the inhibition process is due to adsorption of the extract components on the ass surface. This is because a straight line is obtained when log(C/θ) is plotted against log![[thin space (1/6-em)]](https://www.rsc.org/images/entities/char_2009.gif) C and the linear correlation coefficient of the fitted data is close to 1. Also this was found with the kinetic thermodynamic model of El-Awady. This indicates that the adsorption of the extract molecules obeys the Langmuir adsorption model and the kinetic-thermodynamic model of El-Awady32,33 which are expressed as:where C is the concentration of myrrh extract and K is the equilibrium constant for the adsorption/desorption process of the extract molecules on the α-brass surface.
C and the linear correlation coefficient of the fitted data is close to 1. Also this was found with the kinetic thermodynamic model of El-Awady. This indicates that the adsorption of the extract molecules obeys the Langmuir adsorption model and the kinetic-thermodynamic model of El-Awady32,33 which are expressed as:where C is the concentration of myrrh extract and K is the equilibrium constant for the adsorption/desorption process of the extract molecules on the α-brass surface.| |
log(θ/1 − θ) = log![[thin space (1/6-em)]](https://www.rsc.org/images/entities/char_2009.gif) K + y K + y![[thin space (1/6-em)]](https://www.rsc.org/images/entities/char_2009.gif) log log![[thin space (1/6-em)]](https://www.rsc.org/images/entities/char_2009.gif) C C
| (4) |
where y is number of myrrh extract molecules occupying one active site, when a value of 1/y less than unity implies the formation of a multilayer of the myrrh extract on the α-brass surface, while a value of 1/y greater than unity means that a given extract occupies more than one active site.34–36 θ is the surface coverage. C is the concentration and K is the constant related to the equilibrium constant of the adsorption process. Kads = K1/y.
 |
| | Fig. 3 Langmuir isotherm for myrrh extract adsorption on α-brass in a solution of 3.5% NaCl polluted by 16 ppm sulfide at different temperatures. | |
 |
| | Fig. 4 Kinetic thermodynamic isotherm for myrrh extract adsorption on α-brass in solution of 3.5% NaCl polluted by 16 ppm sulfide at different temperatures. | |
The R2 values for the Langmuir isotherm were more accurate than those for the kinetic model isotherm. Therefore, the Langmuir adsorption isotherm was found to be the best description of the adsorption behaviour of the myrrh extract on the α-brass surface.
From the obtained data, the values of Kads decrease with increasing temperature. This demonstrates that the strength of adsorption decreases with increasing temperature and the inhibitor species are more readily removed from the α-brass surface.37–39
The relationship between the equilibrium constant of adsorption (K) and the standard adsorption free energy (ΔG0ads) can be calculated from the following eqn (5):40
| |
K = 1/55.5![[thin space (1/6-em)]](https://www.rsc.org/images/entities/char_2009.gif) exp[−ΔG0ads/RT] exp[−ΔG0ads/RT]
| (5) |
The values of free energy of adsorption isotherm which were calculated from the above equation using K values obtained from the Langmuir adsorption and kinetic-thermodynamic model of El-Awady adsorption isotherms are presented in Table 4. The negative values of ΔG0ads demonstrate spontaneous adsorption of inhibitors on the α-brass surface.41 In general, values of ΔG0ads up to −20 kJ mol−1 are consistent with physisorption, while those around −40 kJ mol−1 or higher are associated with chemisorption as a result of the sharing or transfer of electrons from extract molecules to the metal surface to form a co-ordinate bond.42
Table 4 Parameters of the Langmuir adsorption and kinetic model adsorption for adsorption of myrrh extract on α-brass in 3.5% NaCl for a 180 min immersion period at different temperatures
| Temp. °C |
Langmuir isotherm |
Kinetic model |
| Kads |
R2 |
−ΔG0ads (kJ mol−1) |
−ΔH0ads (kJ mol−1) |
−ΔS0ads (J mol−1 K−1) |
1/y |
log![[thin space (1/6-em)]](https://www.rsc.org/images/entities/char_2009.gif) Kads Kads |
R2 |
−ΔG0ads (kJ mol−1) |
−ΔH0ads (kJ mol−1) |
−ΔS0ads (J mol−1 K−1) |
| 25 |
14.44 |
0.997 |
16.57 |
18.53 |
117.8 |
1.41 |
1.010 |
0.959 |
15.71 |
29.93 |
153.1 |
| 35 |
11.02 |
0.917 |
16.43 |
|
113.5 |
1.30 |
0.810 |
0.932 |
15.06 |
|
146.1 |
| 45 |
9.88 |
0.983 |
16.67 |
|
111.0 |
2.11 |
0.610 |
0.960 |
14.33 |
|
139.2 |
| 55 |
6.99 |
0.968 |
16.26 |
|
106.0 |
1.29 |
0.546 |
0.923 |
14.38 |
|
135.1 |
For the investigated extract, the calculated ΔGads less than −20 kJ mol−1 indicates that the adsorption mechanism of the myrrh extract on α-brass in 3.5% NaCl solution polluted by 16 ppm sulfide was typical of physisorption.
We calculated the heat of adsorption ΔH0ads using the Van’t Hoff eqn (6):43
| |
log![[thin space (1/6-em)]](https://www.rsc.org/images/entities/char_2009.gif) Kads= (−ΔH0ads/2.303RT) + constant Kads= (−ΔH0ads/2.303RT) + constant
| (6) |
A straight line obtained by plotting Kads against 1/T is shown in Fig. 5; the slope of the straight line gave (ΔH0ads/2.303R); from this slope, the values of ΔH0ads were calculated and are listed in Table 4. Then, the values of ΔS0ads were calculated using eqn (7):
| | |
ΔG0ads = ΔH0ads − TΔS0ads
| (7) |
 |
| | Fig. 5 log Kads vs. (1/T) curves for the corrosion of α-brass in 3.5% NaCl polluted by 16 ppm sulfide in the absence and presence of different concentrations of myrrh extract at different temperatures. | |
A negative sign of ΔH0ads demonstrates that the adsorption of the myrrh extract on the α-brass surface is an exothermic process. The results in Table 4 reveal that the value of Kads is not high and when increasing the temperature, it decreased. The results in Table 4 indicate the more positive sign of ΔSads when the concentration of myrrh extract increases, revealing that the substitution process can be attributed to the increase in the solvent entropy and more positive water desorption entropy. It also inferred that there is an increase in disorder due to there being more water molecules which can be desorbed from the α-brass surface by one molecule from myrrh extract.44,45 This is deduced from the principles of thermodynamics, since the adsorption is an exothermic process and accompanied by a decrease of entropy.46
The effect of temperature on the efficiency of inhibition. From our investigation, the protection efficiency decreases with an increase in temperature. This could be due to the weakness of the adsorption process at higher temperature, suggesting physical adsorption of the myrrh extract on the α-brass surface. Also, the data of Tables 2 and 3 revealed that the weight loss of α-brass increases with increasing the temperature, indicating that the rate of corrosion of the alloy increases with increasing the temperature. The dependence of the rate of corrosion (C.R.) on the temperature can be expressed by the Arrhenius eqn (8):| |
 | (8) |
where  is the apparent activation energies for the corrosion process in the absence and presence of the myrrh extract and A = pre-exponential factor.
Fig. 6 demonstrates Arrhenius plots of the corrosion of α-brass in 3.5% NaCl polluted by 16 ppm sulfide with and without different concentrations of the myrrh extract. The linear regression (R2) is close to 1 which led to the conclusion that the corrosion of α-brass in 3.5% NaCl solution polluted by 16 ppm sulfide ions can be studied using the kinetic model. From Table 5 the data of  indicates that
  values increase in the presence of the myrrh extract compared to in its absence. From these data we can say: the molecules of myrrh extract are adsorbed on the α-brass surface physically.
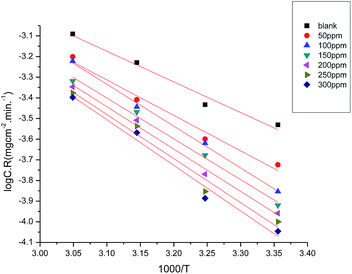 |
| | Fig. 6 Arrhenius plots (log![[thin space (1/6-em)]](https://www.rsc.org/images/entities/char_2009.gif) C.R. vs. 1/T) for α-brass in 3.5% NaCl + 16 ppm sulfide without and with different concentrations of myrrh extract. C.R. vs. 1/T) for α-brass in 3.5% NaCl + 16 ppm sulfide without and with different concentrations of myrrh extract. | |
Table 5 Kinetics parameters of the Arrhenius equation and the transition state equation
| Conc. ppm |

, kJ mol−1 |
−ΔH*, kJ mol−1 |
−ΔS*, J mol−1 K−1 |
| Blank |
28.39 |
25.78 |
226.49 |
| 50 |
32.84 |
30.24 |
215.02 |
| 100 |
38.76 |
36.16 |
197.86 |
| 150 |
37.70 |
35.21 |
201.43 |
| 200 |
39.10 |
36.64 |
197.97 |
| 250 |
40.86 |
38.27 |
193.65 |
| 300 |
42.26 |
39.67 |
189.78 |
In the process of corrosion, the entropy and enthalpy of activation were calculated from the transition state theory as demonstrated in eqn (9):
| | |
C.R. = (RT/Nh)exp(ΔS*/R)exp(−ΔH*/RT)
| (9) |
where
N is Avogadro’s number and
h is Planck’s constant.
ΔS* is the entropy of activation and ΔH* is the enthalpy of activation. Fig. 7 shows a plot of log(C.R./T) vs. (1/T). We obtained straight lines with slopes of (ΔH*/2.303R) and intercepts of (log![[thin space (1/6-em)]](https://www.rsc.org/images/entities/char_2009.gif) R/Nh + ΔS*/2.303R). ΔH* and ΔS* values were calculated and are listed in Table 5. The negative values of ΔH* demonstrate that the corrosion process is an exothermic one. When the values of enthalpy of activation are lower than 41.86 kJ mol−l, this demonstrates physical adsorption, and when the values are approaching 100 kJ mol−1, this reveals chemical adsorption.47 In our study, the values of ΔH* are lower than 41.86 kJ mol−1, confirming physical adsorption. The values of the entropy (ΔS*) in the presence of the myrrh extract are negative; this reflects that the activated complex in the rate determining step represents an association rather than a step of dissociation. This demonstrates that the initial state was of lower order than the activated molecules.48
R/Nh + ΔS*/2.303R). ΔH* and ΔS* values were calculated and are listed in Table 5. The negative values of ΔH* demonstrate that the corrosion process is an exothermic one. When the values of enthalpy of activation are lower than 41.86 kJ mol−l, this demonstrates physical adsorption, and when the values are approaching 100 kJ mol−1, this reveals chemical adsorption.47 In our study, the values of ΔH* are lower than 41.86 kJ mol−1, confirming physical adsorption. The values of the entropy (ΔS*) in the presence of the myrrh extract are negative; this reflects that the activated complex in the rate determining step represents an association rather than a step of dissociation. This demonstrates that the initial state was of lower order than the activated molecules.48
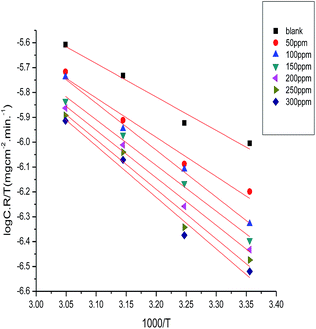 |
| | Fig. 7 Plots of log![[thin space (1/6-em)]](https://www.rsc.org/images/entities/char_2009.gif) C.R./T vs. 1000/T for α-brass in 3.5% NaCl polluted by 16 ppm sulfide without and with different concentrations of myrrh extract at 25 °C. C.R./T vs. 1000/T for α-brass in 3.5% NaCl polluted by 16 ppm sulfide without and with different concentrations of myrrh extract at 25 °C. | |
3.2 Open circuit potential measurements
The variation of the open circuit potential (OCP) of α-brass electrodes as a function of time was studied against a saturated calomel electrode (SCE) in the absence and presence of various concentrations of myrrh extract as indicated in Fig. 8. This study demonstrated that the corrosion potential (Ecorr) of the α-brass electrode in 3.5% NaCl solution polluted by 16 ppm sulfide ions tends to shift to a more noble direction until a steady state potential is established. This suggests that the kinetics of the anodic reaction of α-brass in 3.5% NaCl solution polluted by 16 ppm sulfide ions was affected more strongly in the presence of the myrrh extract.49,50
 |
| | Fig. 8 Potential–time curves for α-brass in 3.5% NaCl solution with 16 ppm sulfide ions in the absence and presence of different concentrations of myrrh extract at 25 °C. | |
3.3 Potentiodynamic polarization
Potentiodynamic polarization curves for α-brass in 3.5% NaCl solution polluted by 16 ppm sulfide ions in the absence and presence of different concentrations of myrrh extract at 25 °C are shown in Fig. 9, and the polarization parameters [Ecorr, icorr; anodic and cathodic Tafel slopes (βa, βc) and resistance polarization (RP)] are registered in Table 6. Both the anodic and cathodic Tafel slopes were slightly changed on increasing the concentration of myrrh extract. This means that the mechanism of inhibition not in the presence and absence of myrrh extract affects both the cathodic and anodic reactions, i.e. it is a mixed-type inhibitor. The Ecorr values show that the myrrh extract behaves as a mixed type, because the variation is small in the Ecorr.51–53 The results from Fig. 9 and Table 6 demonstrate that the presence of myrrh extract and the increase of its concentration decrease the values of the corrosion rate and raise the values of RP and IE%. We calculated the degree of surface coverage (θ) and inhibition efficiency (% IE) using the following equation:| | |
% IE = θ × 100 = [1 − (icorr/i0corr)] × 100
| (10) |
where, i0corr and icorr are the corrosion current densities without and with the myrrh extract, respectively. The anodic polarization curves show three important regions; namely, the Tafel region at lower overpotentials extending to the peak current density due to the dissolution of copper to Cu+ ions, a region of decreasing current density until a minimum (imin) is reached due to the formation of CuCl, and a region of sudden increase in current density leading to a limiting value (ilim), due to the formation of CuCl2.54,55 Tafel polarization plots were obtained using a scan rate of 1 mV s−1 in the potential range from −1000 to +1000 mV with respect to the open circuit potential (Eocp).
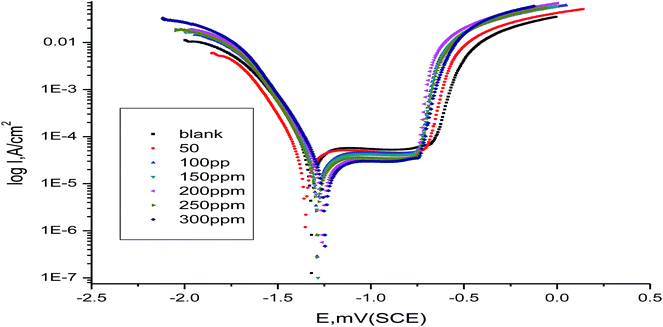 |
| | Fig. 9 Anodic and cathodic polarization curves for α-brass in 3.5% NaCl solution polluted by 16 ppm sulfide ions in the absence and presence of different concentrations of myrrh extract at 25 °C. | |
Table 6 Potentiodynamic polarization parameters for α-brass corrosion in 3.5% NaCl polluted by 16 ppm sulfur ions in the absence and presence of different concentrations of myrrh extract at 25 °C
| Conc., ppm |
−Ecorr, mV vs. SCE |
icorr, μA cm−2 |
RP, ohm |
βa, mV dec−1 |
−βc, mV dec−1 |
θ |
% IE |
mpy |
| Blank |
1320 |
92.7 |
29.03 |
197.0 |
252 |
|
|
33.09 |
| 50 |
1290 |
54.8 |
32.79 |
190.0 |
220.0 |
0.409 |
40.9 |
25.08 |
| 100 |
1290 |
52.5 |
33.20 |
139.8 |
187.3 |
0.433 |
43.3 |
20.60 |
| 150 |
1280 |
49.3 |
34.10 |
164.0 |
187.0 |
0.468 |
46.8 |
19.23 |
| 200 |
1260 |
37.0 |
36.79 |
196.0 |
189.6 |
0.601 |
60.1 |
15.87 |
| 250 |
1290 |
33.4 |
42.46 |
174.4 |
176.0 |
0.640 |
64.0 |
15.36 |
| 300 |
1250 |
30.5 |
65.38 |
190.0 |
166.3 |
0.670 |
67.0 |
13.53 |
3.4 Electrochemical impedance spectroscopy
The impedance data of the α-brass electrode in the presence of different concentrations of myrrh extract were studied using the equivalent circuit shown in Fig. 10. This circuit includes constant phase elements (CPE) in place of capacitors to represent various types of non-homogeneities typical of corroding electrodes such as roughness of the surface, insufficient polishing, grain boundaries and impurities of the surface.56 The impedance of α-brass is dependent on frequency, and can be expressed mathematically using two parameters, Y0 and n as:57where Y0 is the CPE coefficient, j2 = −1 is the imaginary number and ω is the sine wave modulation angular frequency and equals 2πf, where f is the AC frequency. In real experimental conditions, the n values are between 0 and 1 as a result of the influence of many factors such as electrode roughness, surface heterogeneity, and the dielectric constant.58 The slightly lower values of n for the blank compared to the inhibited systems suggest that the α-brass surface is relatively more homogeneous, which may be due to uniform adsorption of the myrrh extract molecules on the α-brass surface. We calculated the double layer capacitance (Cdl) from the following equation.59| | |
Cdl = Y0ωn−1/sin[n(π/2)]
| (12) |
 |
| | Fig. 10 Equivalent circuit proposed to fit the EIS experimental data. | |
From the following equation we calculated the degree of surface coverage (θ) and the inhibition efficiency (% IE)
| | |
% IE = θ × 100 = [1 − (R0ct/Rct)] × 100
| (13) |
where
Rct and
R0ct are the charge transfer resistances with and without myrrh extract, respectively;
θ and % IE are also listed in
Table 7. The interface of the α-brass surface and the aqueous electrolyte is a complex process consisting of a line of positively and negatively charged ions. Also, it contains a coating or film formation on the surfaces. Capacitance is the result of an electrical double layer (
Cdl), charge transfer resistance (
Rct), solution resistance (
Rs), and diffusion of ions; movement of charge in or away from the α-brass surface and adsorption of cations and anions gives various impedances. The data which are listed in
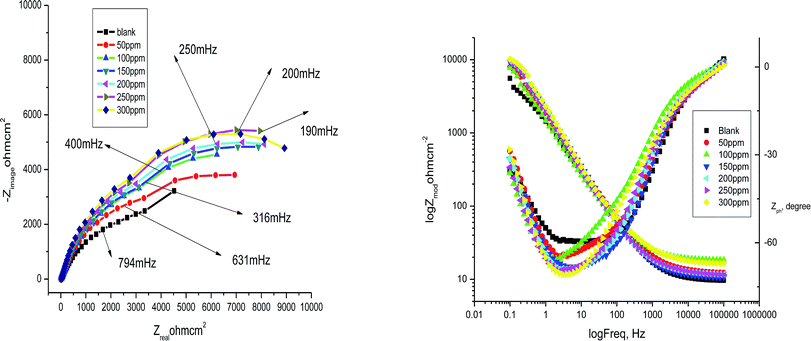
Table 7 show impedance for α-brass in 3.5% NaCl polluted by 16 ppm of sulfide ions without and with various concentrations of myrrh extract. The diagrams of impedance (Nyquist and Bode plots) obtained for α-brass in the presence of various concentrations of myrrh extract are depicted in
Fig. 11. The charge transfer resistance of the corrosion reaction increases as a result of increasing the diameter of the semicircle which increases with increasing the concentration of myrrh extract. This is attributed to high resistance shown by the adsorbed myrrh extract components at the α-brass alloy–solution interface.
60 The Nyquist plots do not close as a semicircle, as expected from the theory of EIS. The deviation from an ideal semicircle was generally attributed to the frequency dispersion as well as to the inhomogeneities of the surface.
61,62 The decrease in
Cdl in comparing with that in the blank solution (without different concentrations of myrrh extract) is a result of the decreasing local dielectric constant and/or an increase in the thickness of the electrical double layer. This is because of the adsorption of extract molecules at the alloy/solution interface.
63 The obtained impedance diagrams have an almost semicircular appearance, indicating a charge transfer process which mainly controls the corrosion of α-brass.
64,65 Electrochemical impedance spectroscopy was studied at corrosion potentials,
Ecorr, over a frequency range of 10
5 Hz to 0.1 Hz with a signal amplitude perturbation of 10 mV.
Table 7 EIS parameters for corrosion of α-brass in 3.5% NaCl polluted by 16 ppm sulfide ions in the absence and presence of different concentrations of myrrh extract at 25 °C
| Conc., ppm |
Rct, Ω cm−2 |
RS, Ω cm−2 |
Y0 × 106, μΩ−1 Sn |
n |
Cdl × 105, F cm−2 |
θ |
% IE |
| Blank |
5.95 × 10³ |
9.38 × 10⁻³ |
170 |
0.716 |
1.24 |
— |
— |
| 50 |
9.15 × 10³ |
12.68 × 10⁻³ |
130.2 |
0.742 |
0.716 |
0.349 |
34.9 |
| 100 |
10.32 × 10³ |
10.97 × 10⁻³ |
101.8 |
0.791 |
0.110 |
0.423 |
42.3 |
| 150 |
11.2 × 10³ |
12.37 × 10⁻³ |
107.6 |
0.796 |
0.119 |
0.469 |
46.9 |
| 200 |
15.1 × 10³ |
17.93 × 10⁻³ |
98.82 |
0.793 |
0.111 |
0.606 |
60.6 |
| 250 |
16.41 × 10³ |
12.41 × 10⁻³ |
117.4 |
0.788 |
0.140 |
0.637 |
63.7 |
| 300 |
17.9 × 10³ |
18.89 × 10⁻³ |
172.9 |
0.731 |
0.257 |
0.667 |
66.7 |
 |
| | Fig. 11 Nyquist and Bode plots for corrosion of α brass in 3.5% NaCl polluted in the absence and presence of different concentrations of myrrh extract at 25 °C. | |
3.5 Electrochemical frequency modulation (EFM) measurements
The electrochemical frequency modulation technique is considered to be a non-destructive technique and a rapid test, which directly gives data of the corrosion current without knowledge of the constants of Tafel, and this technique has great strength because of the causality factors, which are considered as an internal check on the validity of the EFM measurements.66 This technique has a small AC signal like EIS, but there is a difference between the two techniques, because EFM has two sine waves (at different frequencies) which are applied to the cell simultaneously. The system responds in a nonlinear way to the potential excitation, because the current is a nonlinear function of potential. The current response contains the input frequencies, and also contains frequency components which are the sum, difference, and multiples of the two input frequencies. The two frequencies must be small, integer multiples of a base frequency that determines the length of the experiment. Table 8 indicates the corrosion parameters such as inhibition efficiency, Tafel constants (βa, βc), corrosion current density (μA cm−2), and causality factors (CF-2, CF-3) at different concentrations of myrrh extract in 3.5% NaCl polluted by 16 ppm sulfide ions at 25 °C. The causality factors in Table 8 demonstrate that the measured values are of good quality. The standard data for CF-2 and CF-3 are 2.0 and 3.0, respectively. If the causality factor data differ significantly from the theoretical values of 2.0 and 3.0, then it can be demonstrated that the measured values are influenced by noise. If the experimental causality factors are approximately equal to the theoretical values, there is a causal relationship between the perturbation signal and the response signal. Then, the values are assumed to be reliable.67 Table 8 indicates that, by increasing the concentrations of myrrh extract, the corrosion current densities decrease. Also, the inhibition efficiencies increase by increasing the myrrh extract concentrations. The inhibition efficiencies (% IEEFM) depicted in Table 8 were calculated using eqn (14):| | |
% IEEFM = θ × 100 = [1 − (icorr/i0corr)] × 100
| (14) |
where i0corr and icorr are the corrosion current densities in the absence and presence of myrrh extract. The difference in the inhibition efficiencies (% IEEFM) obtained with the different techniques are a result of the variations between the individual techniques and the different models that were used for the interpretation.68,69 We performed the EFM technique with applying a potential perturbation signal of amplitude 10 mV with two sine waves of 2 and 5 Hz. The choice for the frequencies of 2 and 5 Hz was based on three arguments (Fig. 12).70
Table 8 Electrochemical kinetic parameters obtained using the EFM technique for α-brass in 3.5% NaCl solutions with myrrh extract at 25 °C
| Conc., ppm |
icorr, μA cm−2 |
βa, mV dec−1 |
−βc, mV dec−1 |
CF-2 |
CF-3 |
θ |
% IE |
mpy |
| Blank |
5.62 |
120.2 |
138.3 |
1.90 |
2.80 |
— |
— |
2.753 |
| 50 |
3.35 |
135.3 |
162.2 |
1.87 |
2.77 |
0.404 |
40.4 |
2.46 |
| 100 |
3.20 |
140.2 |
170.0 |
2.06 |
3.20 |
0.431 |
43.1 |
2.331 |
| 150 |
2.97 |
160.0 |
177.0 |
1.69 |
2.98 |
0.471 |
47.1 |
1.75 |
| 200 |
2.23 |
170 |
142.0 |
1.81 |
2.77 |
0.603 |
60.3 |
1.56 |
| 250 |
1.98 |
168 |
174.0 |
1.88 |
3.90 |
0.648 |
64.8 |
1.18 |
| 300 |
1.83 |
178 |
164.0 |
2.30 |
3.40 |
0.674 |
67.4 |
1.09 |
 |
| | Fig. 12 EFM intermodulation spectra (current vs. frequency) without and with different concentrations of myrrh extract for corrosion of α-brass in 3.5% NaCl solution polluted at 25 °C. | |
3.6 AFM (atomic force microscopy)
Scanning force microscopy (SFM) or atomic force microscopy (AFM) is a very high-resolution type of scanning probe microscopy, with demonstrated resolution on the order of fractions of a nanometer, more than 1000 times better than the optical diffraction limit.71,72 Fig. 13 depicts the morphologies of the α-brass specimens after immersion for one day in 3.5% NaCl solution polluted by 16 ppm sulfide without and with 300 ppm of myrrh extract. Table 9 demonstrates the Sa (average roughness), Sq (root-mean-square roughness), and P–V value (the maximum peak-to-valley height values). The average roughness Sa of α-brass in 3.5% NaCl solution polluted by 16 ppm sulfide without myrrh extract was calculated as 694.87 nm by atomic force microscopy (Fig. 13A). In the presence of the myrrh extract, a smoother surface was obtained and the Sa value decreased to 208.34 nm (Fig. 13B) as a consequence of low corrosion damage and the protective formation of a myrrh extract layer on the steel surface. It can be clearly observed that in the absence of the myrrh extract, the α-brass surface was seriously corroded with areas of uniform corrosion. In the presence of the myrrh extract, however, the specimen surface was more smooth. This is due to the involvement of myrrh extract molecules in the interaction with the reaction sites of the α-brass, resulting in a decrease in the contact between the alloy and the aggressive medium and the sequentially exhibited excellent inhibition effect.
 |
| | Fig. 13 (A) Surface of the α-brass electrode imaged using atomic force microscopy after 24 h immersion in 3.5% NaCl solution polluted by 16 ppm sulfur ions. (B) Surface of the α-brass electrode imaged using atomic force microscopy after 24 h immersion in 3.5% NaCl solution polluted by 16 ppm sulfur ions with 300 ppm myrrh extract. | |
Table 9 The morphology data of the surface of the α-brass after immersion for 24 h in 3.5% NaCl solution polluted by 16 ppm sulfide ions without and with 300 ppm of myrrh extract was examined in the light of an atomic force microscope
| Samples |
Sq (nm) |
Sa (nm) |
Maximum peak-to-valley height (nm) |
| 1-α-brass immersed in 3.5% NaCl solution polluted (blank) |
810.95 |
694.87 |
4106 |
| 3-α-brass immersed in 3.5% NaCl solution polluted + 300 ppm (myrrh extract) |
259.32 |
208.34 |
1769 |
3.7 Fourier transform infrared spectroscopy analysis (FT-IR)
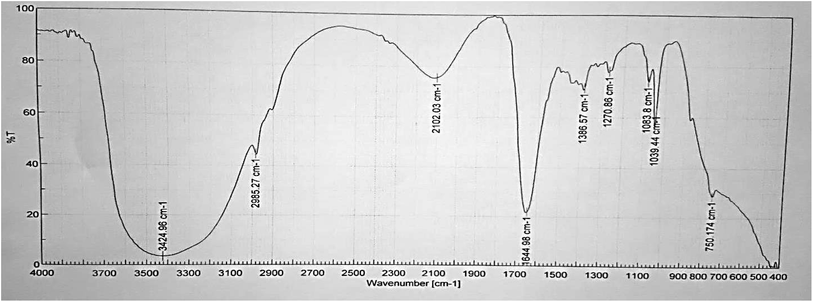
To identify the functional groups present in the myrrh extract we used Fourier transform infrared spectroscopy analysis (FT-IR) using liquid samples. Fig. 14 and 15 demonstrate the FT-IR spectra of the myrrh extract and the corrosion products which are present. The results obtained from our study demonstrated that corrosion inhibition takes place through an adsorption process. The spectrum of the 300 ppm of myrrh extract in 3.5% NaCl solution polluted by 16 ppm sulfide ions (Fig. 14) shows that broad peaks appeared at 3424.96, 1644.98, 1386.57 and 2102.03 cm−1 which correspond to the O–H, C![[double bond, length as m-dash]](https://www.rsc.org/images/entities/char_e001.gif) O, C
O, C![[double bond, length as m-dash]](https://www.rsc.org/images/entities/char_e001.gif) C and aliphatic C–H stretching vibration frequencies, respectively. From the results, there is a shift in the spectra of the myrrh extract when α-brass was immersed in it to form a corrosion product (Fig. 15). This indicates that there is an interaction between the extract and the α-brass substrate which resulted in an inhibition process. The shifts in the spectra are considered to be a result of the interaction between the myrrh extracts and the α-brass, occurring through the functional groups present in them. So, it can be affirmed that the functional group has coordinated with the alloy formed on the surface resulting in the formation of a Cu2+ extract complex on the alloy surface, which promotes the inhibition of the alloy sample.
C and aliphatic C–H stretching vibration frequencies, respectively. From the results, there is a shift in the spectra of the myrrh extract when α-brass was immersed in it to form a corrosion product (Fig. 15). This indicates that there is an interaction between the extract and the α-brass substrate which resulted in an inhibition process. The shifts in the spectra are considered to be a result of the interaction between the myrrh extracts and the α-brass, occurring through the functional groups present in them. So, it can be affirmed that the functional group has coordinated with the alloy formed on the surface resulting in the formation of a Cu2+ extract complex on the alloy surface, which promotes the inhibition of the alloy sample.
 |
| | Fig. 14 FT-IR spectrum of the myrrh extract before adsorption on the α-brass surface. | |
 |
| | Fig. 15 FT-IR spectrum of the myrrh extract after adsorption on the α-brass surface. | |
3.8 UV-visible analysis
Visible absorption spectra obtained from 3.5% NaCl solution polluted by 16 ppm sulfide ions containing 300 ppm myrrh extract before and after the α-brass immersion are shown in Fig. 16, and confirmed the possibility of the formation of an inhibitor–Cu complex. The electronic absorption spectra of the myrrh extract before immersion have an absorption maximum at 240 nm which can be attributed to π–π* and “n–π*” transitions. After 24 h immersion of the α-brass, the change in the position of the absorption maximum or the change in the absorbance values indicate the complex formation between the two species in solution. Furthermore, there is no change in the shape of the absorption spectra. These experimental findings prove the formation of a complex between Cu2+ and the myrrh extract and confirm the inhibition of the α-brass corrosion.73
 |
| | Fig. 16 UV-Visible spectra of the solution of 3.5% NaCl polluted by 16 ppm sulfide ions containing 300 ppm myrrh extract before and after 24 h of α-brass immersion. | |
4. Conclusions
The inhibition effects of the myrrh extract on the corrosion of α-brass in 3.5% NaCl solution polluted by 16 ppm sulfide were studied in the present work using weight loss measurements, electrochemical techniques (potentiodynamic polarization measurements, EIS and EFM) and AFM surface analysis, resulting in the following experimental evidences:
(1) From the weight loss measurements, the corrosion rate decreased by addition of myrrh extract to α-brass in 3.5% NaCl solution polluted by 16 ppm sulfide, while the inhibition efficiency increased when increasing the myrrh extract concentration and decreased with temperature.
(2) The adsorption isotherm of the myrrh extract on the α-brass surface can be described by the Langmuir and kinetic thermodynamic adsorption isotherms. The obtained values of ΔG0ads from the Langmuir and kinetic thermodynamic adsorption isotherms indicate that the physisorption mechanism was an adsorption process.
(3) From the potentiodynamic study, the myrrh extract is found to be a mixed type inhibitor.
(4) AFM indicated that the morphology of the α-brass surface in the presence of the myrrh extract is less damaged due to the formation of the smooth protective film.
(5) Based on the results of weight loss, potentiodynamic polarization measurements, EIS and EFM, the myrrh extract was shown to be an effective inhibitor in 3.5% NaCl polluted by 16 ppm sulfide on α-brass.
References
- E. M. Sherif, R. M. Erasmus and J. D. Comins, J. Colloid Interface Sci., 2007, 309(2), 470–477 CrossRef CAS PubMed.
- M. G. Fontana, Corrosion Engineering, Mc Graw-Hill International, New York, 1987 Search PubMed.
- A. S. El-Amoush, J. Alloys Compd., 2008, 448, 257–262 CrossRef CAS.
- A. Pola, M. Gelfi, L. E. Depero and R. Roberti, Eng. Failure Anal., 2008, 15, 54 CrossRef CAS.
- R. Ravichandran and N. Rajendran, Ap. Surf. Sci.ce, 2005, 241, 449–458 CrossRef CAS.
- G. Kear, B. D. Barker, K. R. Stokes and F. C. Walsh, J. Appl. Electrochem., 2004, 34, 659–669 CrossRef CAS.
- W. A. Badawy, M. M. El-Rabiee, N. H. Helal and H. Nady, Electrochim. Acta, 2012, 71, 50–57 CrossRef CAS.
- G. Kear, B. D. Barker, K. R. Stokes, F. C. Walsh, I. Part and I. I. Part, J. Appl. Electrochem., 2004, 34, 1235–1240 CrossRef CAS.
- D. Féron, “Corrosion behaviour and protection of copper and aluminium alloys in seawater”, Woodhead Publication, Cambridge, England, 1st edn, 2007 Search PubMed.
- P. N. L. Lens and L. Hulshoff Pol, Environmental technologies to treat sulfur pollution, IWA Publication, 1st edn, England, 2000 Search PubMed.
- H. Nady, M. M. El-Rabiei and M. Samy, Egypt. J. Pet., 2017, 26, 79–94 CrossRef.
- K. Rahmouni, M. Keddam, A. Srhiri and H. Takenouti, Corr. Sci.ce, 2005, 47, 3249–3266 CrossRef CAS.
- M. A. Elmorsi and A. M. Hassanein, Corros. Sci., 1999, 41, 2337–2352 CrossRef CAS.
- M. El Bakri, R. Touir, A. Tazouti, N. Dkhireche, M. Ebn Touhami, A. Rochdi and A. Zarrouk, Arabian J. Sci. Eng., 2016, 41, 75–88 CrossRef CAS.
- L. Yohai, W. H. Schreiner, M. Vázquez and M. B. Valcarce, J. Solid State Electrochem., 2015, 19, 1559–1568 CrossRef CAS.
- L. Babouri, K. Belmokre, A. Abdelouas, J. F. Bardeau and Y. El Mendili, Int. J. Electrochem. S.ci, 2015, 10, 7818–7839 CAS.
- A. C. Jayasree and R. Ravichandran, Int. J. Curr. Microbiol. Appl. Sci., 2014, 3, 515–526 CAS.
- J. R. Xavier and R. Nallaiyan, J. Solid State Electrochem., 2012, 16, 391–402 CrossRef CAS.
- I. Batlle and J. Tous, Carob Tree. Ceratonia siliqua L, Promoting the Conservation and Use of Underutilized and Neglected Crops, Plant Genetic Resources Institute, Rome, 1997, p. 92 Search PubMed.
- F. S. De Souza, C. Giacomelli, R. S. Gonçalves and A. Spinelli, Mater. Sci. Eng., C, 2012, 32(8), 2436–2444 CrossRef.
- A. S. Fouda, K. Shalabi and A. A. Idress, Green Chem. Lett. Rev., 2015, 8, 17–29 CrossRef CAS.
- Z. V. P. Murthy and K. Vijayaragavan, Green Chem. Lett. Rev., 2014, 7, 209–219 CrossRef CAS.
- O. E. Nnabuk, A. O. Stevens and N. A. Ibiam, Green Chem. Lett. Rev., 2010, 3, 165–172 CrossRef.
- ASTM, G 31–72, American Society for Testing and Materials, Philadelphia, PA, 1990 Search PubMed.
- S. A. Gadir and I. M. Ahmed, J. Chem. Pharm. Res., 2014, 6(7), 151–156 Search PubMed.
- L. O. Hanuš, T. Řezanka, V. M. Dembitsky and A. Moussaieff, Biomed. Pap., 2005, 149(1), 3–28 CrossRef.
- N. Harckerman and R. M. Hurd, 1st International Congress on Metallic Corrosion, Butterworths, London, vol. 166, 1962 Search PubMed.
- Z. M. Hadi and J. Al-Sawaad, J. Mater. Environ. Sci., 2011, 2(2), 128–147 Search PubMed.
- B. Zerga, M. Sfaira, M. Taleb, M. Ebn Touhami, B. Hammouti, A. Attayibat, S. Radi and A. T. Benjelloun, Der Pharma Chemica, 2012, 4(5), 1887–1896 CAS.
- A. Amin, K. F. Khaled, Q. Mohsen and A. Arida, Corros. Sci., 2010, 52, 1684–1695 CrossRef.
- S. A. Umoren, O. Ogbobe, I. O. Igwe and E. E. Ebenso, Corros. Sci., 2008, 50, 1998–2006 CrossRef CAS.
- M. P. Chakravarthy and K. N. Mohana, ISRN Corros., 2014, 2014, 1–13 CrossRef.
- A. A. El-Awady, B. A. Abd-El-Nabey and S. G. Aziz, J. Electrochem. Soc., 1992, 139, 2149–2154 CrossRef CAS.
- A. K. Singh, S. K. Shukla, M. Singh and M. A. Quraishi, Mater. Chem. Phys., 2011, 129, 68–76 CrossRef CAS.
- A. K. Singh and M. A. Quraishi, Corros. Sci., 2011, 53, 1288–1297 CrossRef CAS.
- A. K. Singh and M. A. Quraishi, J. Appl. Electroch.em, 2011, 41, 7–18 CrossRef CAS.
- S. Keera and M. Deyab, Colloids Surf., A, 2005, 266, 129 CrossRef CAS.
- A. M. Hassan and T. M. H. Abdel-Fatah, Int. J. Electrochem. Sci., 2016, 11, 6959–6975 CrossRef CAS.
- S. Abd El Rehim, H. Hassan and M. Amin, Mater. Chem. Phys., 2002, 78, 337 CrossRef.
- B. Hammouti, A. Dafali, R. Touzani and M. Bouachrine, J. Saudi Chem. Soc., 2012, 16, 413–418 CrossRef CAS.
- A. Amin, Corros. Sci., 2004, 46, 5–25 CrossRef.
- G. Mu, X. Li and G. Liu, Corros. Sci., 2005, 47, 1932–1952 CrossRef CAS.
- A. S. Fouda, G. El-Ewady and A. H. Ali, Green Chem. Lett. Rev., 2017, 10(2), 88–100 CrossRef.
- F. Mohsenifar, H. Jafari and K. Sayin, Journal of Bio- and Tribo-Corrosion, 2016, 2(1), 1–13 CrossRef.
- H. Jafari, K. Akbarzade and I. Danaee, Arabian J. Chem., 2014, 1–8 CAS.
- J. M. Thomas and W. J. Thomas, Introduction to the Principles of Heterogeneous Catalysis, Academic Press, London, 5th edn, 1981, p. 14 Search PubMed.
- M. I. Awad, J. Ap. Electrochem.em, 2006, 36, 1163–1168 CrossRef CAS.
- N. O. Obi-Egbedi, K. E. Essien, I. B. Obot and E. E. Ebenso, Int. J. Electrochem. Sci., 2011, 6, 913–930 CAS.
- M. M. EL-Naggar, J. Mater. Sci., 2000, 35, 6189–6195 CrossRef CAS.
- S. L. Chi-Ucán, A. Castillo-Atoche, P. C. Borges, J. A. Manzanilla-Cano, G. González-García, R. Patiño and L. Díaz-Ballote, J. Chem., 2014, 2014, 1–10 CrossRef.
- H. A. Sing, E. E. Ebenso and M. A. Quraishi, Int. J. Electrochem. Sci., 2012, 7, 3409–3419 Search PubMed.
- P. Bothi Raja and M. G. Sethuraman, Mater. Lett., 2008, 62, 1602–1604 CrossRef.
- Y. Yan, W. Li, L. Cai and B. Hou, Electrochim. Acta, 2008, 53, 5953–5960 CrossRef CAS.
- E. M. Sherif, R. M. Erasmus and J. D. Collins, J. Appl. Electrochem., 2009, 39, 83–91 CrossRef CAS.
- A. M. Alfantazi, T. M. Ahmed and D. Tromans, Mater. Des., 2009, 30, 2425–2430 CrossRef CAS.
- H. Ashassi-Sorkhabi, M. R. Majidi and K. Seyyedi, Appl. Surf. Sci., 2004, 225, 176–185 CrossRef CAS.
- S. Mo, T. Ting Qin, H. Qun Luo and N. B. Li, RSC Adv., 2015, 5, 90542–90549 RSC.
- D. A. Lopez, S. N. Simison and S. R. de Sanchez, Electrochim. Acta, 2003, 48, 845–854 CrossRef CAS.
- Z. Lukacs, J. Electroanal. Chem., 1999, 464, 68–75 CrossRef CAS.
- A. S. Fouda, A. A. Ibrahim and W. T. El- behairy, Der Pharma Chemica, 2014, 6(5), 144–157 Search PubMed.
- A. S. Fouda, A. E. Mohamed and M. A. Khalid, J. Chem. Pharm. Res., 2016, 8(2), 86–98 CAS.
- M. El Achouri, S. Kertit, H. M. Gouttaya, B. Nciri, Y. Bensouda, L. Perez, M. R. Infante and K. Elkacemi, Prog. Org. Coat., 2001, 43, 267–273 CrossRef CAS.
- L. R. Chauhan and G. Gunasekaran, J. Corros. Sci. Eng., 2007, 49, 1143–1161 CrossRef CAS.
- K. R. Ansari, M. A. Quraishi and A. Singh, Corros. Sci., 2014, 79, 5–15 CrossRef CAS.
- M. A. Hegazy, S. S. Abd El Rehim, A. M. Badawia and M. Y. Ahmed, RSC Adv., 2015, 5, 49070–49079 RSC.
- G. Trabanelli, C. Montecelli, V. Grassi and A. J. Frignani, Cem. Concr. Res., 2005, 35(9), 1804–1813 CrossRef CAS.
- E. Barsoukov and J. R. Macdonald, Impedance Spectroscopy, Theory, Experiment and Applications, Wiley Interscience publications, New York, 2nd edn, 2005 Search PubMed.
- M. N. El-Haddad, RSC Adv., 2016, 6, 57844–57853 RSC.
- M. N. EL-Haddad and A. S. Fouda, Chem. Eng. Commun., 2013, 200, 1366–1393 CrossRef CAS.
- R. W. Bosch, W. F. Bogaerts and B. Syrett, Proc. 8th International Symposium on Electrochemical Methods in Corrosion Research modulation (EFM) technique, Nieuwpoort, Belgium, 4–9 May 2003 Search PubMed.
- R. W. Bosch, J. Hubrecht, W. F. Bogaerts and B. C. Syrett, Corrosion, 2011, 57, 60–70 CrossRef.
- N. O. Obi-Egbedia and I. B. Obotb, Arabian J. Chem., 2013, 6, 211–223 CrossRef.
- J. Jeyasundari, S. Rajendran, R. S. Kannan and Y. B. A. Jacob, Eur. Chem. Bull., 2013, 2(9), 585–591 CAS.
|
| This journal is © The Royal Society of Chemistry 2017 |
Click here to see how this site uses Cookies. View our privacy policy here.  Open Access Article
 *a,
M. M. Motaweab and
H. M. Elabbasyc


![[thin space (1/6-em)]](https://www.rsc.org/images/entities/char_2009.gif) C and the linear correlation coefficient of the fitted data is close to 1. Also this was found with the kinetic thermodynamic model of El-Awady. This indicates that the adsorption of the extract molecules obeys the Langmuir adsorption model and the kinetic-thermodynamic model of El-Awady32,33 which are expressed as:
C and the linear correlation coefficient of the fitted data is close to 1. Also this was found with the kinetic thermodynamic model of El-Awady. This indicates that the adsorption of the extract molecules obeys the Langmuir adsorption model and the kinetic-thermodynamic model of El-Awady32,33 which are expressed as:![[thin space (1/6-em)]](https://www.rsc.org/images/entities/char_2009.gif) K + y
K + y![[thin space (1/6-em)]](https://www.rsc.org/images/entities/char_2009.gif) log
log![[thin space (1/6-em)]](https://www.rsc.org/images/entities/char_2009.gif) C
C


![[thin space (1/6-em)]](https://www.rsc.org/images/entities/char_2009.gif) exp[−ΔG0ads/RT]
exp[−ΔG0ads/RT]
![[thin space (1/6-em)]](https://www.rsc.org/images/entities/char_2009.gif) Kads
Kads![[thin space (1/6-em)]](https://www.rsc.org/images/entities/char_2009.gif) Kads= (−ΔH0ads/2.303RT) + constant
Kads= (−ΔH0ads/2.303RT) + constant

 is the apparent activation energies for the corrosion process in the absence and presence of the myrrh extract and A = pre-exponential factor.
 indicates that
  values increase in the presence of the myrrh extract compared to in its absence. From these data we can say: the molecules of myrrh extract are adsorbed on the α-brass surface physically.
![[thin space (1/6-em)]](https://www.rsc.org/images/entities/char_2009.gif) C.R. vs. 1/T) for α-brass in 3.5% NaCl + 16 ppm sulfide without and with different concentrations of myrrh extract.
C.R. vs. 1/T) for α-brass in 3.5% NaCl + 16 ppm sulfide without and with different concentrations of myrrh extract.![[thin space (1/6-em)]](https://www.rsc.org/images/entities/char_2009.gif) R/Nh + ΔS*/2.303R). ΔH* and ΔS* values were calculated and are listed in Table 5. The negative values of ΔH* demonstrate that the corrosion process is an exothermic one. When the values of enthalpy of activation are lower than 41.86 kJ mol−l, this demonstrates physical adsorption, and when the values are approaching 100 kJ mol−1, this reveals chemical adsorption.47 In our study, the values of ΔH* are lower than 41.86 kJ mol−1, confirming physical adsorption. The values of the entropy (ΔS*) in the presence of the myrrh extract are negative; this reflects that the activated complex in the rate determining step represents an association rather than a step of dissociation. This demonstrates that the initial state was of lower order than the activated molecules.48
R/Nh + ΔS*/2.303R). ΔH* and ΔS* values were calculated and are listed in Table 5. The negative values of ΔH* demonstrate that the corrosion process is an exothermic one. When the values of enthalpy of activation are lower than 41.86 kJ mol−l, this demonstrates physical adsorption, and when the values are approaching 100 kJ mol−1, this reveals chemical adsorption.47 In our study, the values of ΔH* are lower than 41.86 kJ mol−1, confirming physical adsorption. The values of the entropy (ΔS*) in the presence of the myrrh extract are negative; this reflects that the activated complex in the rate determining step represents an association rather than a step of dissociation. This demonstrates that the initial state was of lower order than the activated molecules.48


![[double bond, length as m-dash]](https://www.rsc.org/images/entities/char_e001.gif) O, C
O, C![[double bond, length as m-dash]](https://www.rsc.org/images/entities/char_e001.gif) C and aliphatic C–H stretching vibration frequencies, respectively. From the results, there is a shift in the spectra of the myrrh extract when α-brass was immersed in it to form a corrosion product (Fig. 15). This indicates that there is an interaction between the extract and the α-brass substrate which resulted in an inhibition process. The shifts in the spectra are considered to be a result of the interaction between the myrrh extracts and the α-brass, occurring through the functional groups present in them. So, it can be affirmed that the functional group has coordinated with the alloy formed on the surface resulting in the formation of a Cu2+ extract complex on the alloy surface, which promotes the inhibition of the alloy sample.
C and aliphatic C–H stretching vibration frequencies, respectively. From the results, there is a shift in the spectra of the myrrh extract when α-brass was immersed in it to form a corrosion product (Fig. 15). This indicates that there is an interaction between the extract and the α-brass substrate which resulted in an inhibition process. The shifts in the spectra are considered to be a result of the interaction between the myrrh extracts and the α-brass, occurring through the functional groups present in them. So, it can be affirmed that the functional group has coordinated with the alloy formed on the surface resulting in the formation of a Cu2+ extract complex on the alloy surface, which promotes the inhibition of the alloy sample.


