DOI:
10.1039/C7RA04259K
(Paper)
RSC Adv., 2017,
7, 35075-35085
A novel Zn(II) dithiocarbamate/ZnS nanocomposite for highly efficient Cr6+ removal from aqueous solutions
Received
15th April 2017
, Accepted 15th June 2017
First published on 12th July 2017
Abstract
A simple one-step method was designed for the first time to produce a novel Zn(II) dithiocarbamate/ZnS nanocomposite. The developed Zn(II) dithiocarbamate/ZnS nanocomposite was found to exhibit outstanding performance on Cr6+ removal from aqueous solutions and the removal rate could reach more than 98% in just a few seconds. Various influencing factors such as the addition quantity, pH value and reaction temperature were investigated in order to determine the optimal removal conditions. It was shown that the Cr6+ removal ability of the Zn(II) dithiocarbamate/ZnS nanocomposite remained high at almost all the pH values and the degradation rate increased gradually with the reaction temperature up to 323 K. Compared to the traditional catalysts, which usually involve a complex production process with a high cost and a low degradation rate, the novel Zn(II) dithiocarbamate/ZnS nanocomposite has great potential in applications for wastewater treatment.
1. Introduction
Heavy metal pollution in water has been a common concern for the world, since the bioaccumulation of heavy metal ions in living cells brings serious adverse health effects to the functions of organs of both humans and animals, which can cause different progressive diseases, such as lung problems and bone lesions.1 As the main sources of heavy metal pollution, the electroplating industry and tannery wastewater have drawn greater attention since they produce toxic wastes, even when the concentration of metal cations is low.2 Among the various kinds of harmful heavy metal cations, hexavalent chromium (Cr6+) is extremely harmful because of its high solubility in water as well as its carcinogenic and mutagenic effects to the liver.3 For this reason, to develop an economic but effective method to remove the Cr6+ from wastewater is of great importance for protection of the public health and environment. A great deal of work has been explored to develop more effective methods on Cr6+ removal from wastewater. Conventional methods on Cr6+ removal included adsorption,4 ion exchange,5,6 biosorption,7 membrane technology,8 chemical precipitation,9 and photocatalytic technology.10–19 However, the high operational cost, complexity in material synthesis, slow reaction rate and a large volume of secondary hazardous contaminants have hindered the wider applications of the above-mentioned methods in different extents.20–22
Use of dithiocarbamate (DTC) has been one of the solutions attracting increasing attention over the last few years.23 DTC is a substance consisting of micromolecules and macromolecules with single or multiple dithiocarbamate groups. Due to the strong tendency of sharing electrons between elements N and S and heavy metal ions, the dithiocarbamate groups can be strongly bound with various heavy metal ions, exhibiting excellent removal capacity of heavy metal ions.23–26 Recently, new dithiocarbamate-type compounds with a stronger chelating ability have also been developed. Li23 synthesized a carbamide-based dithiocarbamate (CDTC) by the reaction of carbamide and carbon disulfide in an alkaline condition, and discussed its distinctive selectivity on the metal ions removal such as Cd2+, Pb2+, Zn2+, and Cu2+. Abu-El-Halawa et al.27 prepared two types of dithiocarbamate ligands to use them as chelators to remove Pb2+, Cd2+, Cu2+ and Zn2+ from polluted water. The compounds of DTC were usually synthesized from amino compounds and carbon disulfide under an alkaline environment. However, the synthesis conditions were usually very complicated and involved with many operations such as high temperature treatment, evaporation backflow and long reaction period. Meanwhile, the DTC had the drawbacks such as high dosage and poor effectiveness under an acidic environment.28 Moreover, most of these studies have focused on free divalent metal ion (Fe2+, Mn2+, Cu2+, Zn2+, and Ni2+) removal by the dithiocarbamate, while only few on free Cr6+.
This paper aims to develop a novel Zn(II) dithiocarbamate/ZnS nanocomposite, which exhibits an excellent performance on Cr6+ removal in aqueous solutions, through a facile one-step method. The effects of various influencing factors are investigated in order to find a high-performance but cost-effective approach for treatment of the wastewater containing hexavalent chromium metal ion in case of emergency.
2. Materials and methods
2.1. Materials
Analytical grade (AR) of ethylenediamine (Kemiou Chemical Reagent Factory, Tianjin, China), carbon disulfide (Tianli Chemical Reagent Factory, Tianjin, China) and zinc chloride (Zhiyuan Chemical Reagent Factory, Tianjin, China) were used as raw materials. A standard stock solution containing 1000 mg L−1 of Cr6+ was prepared by dissolving a weighed portion of potassium dichromate (K2Cr2O7) in deionized water. The working solutions of Cr6+ were prepared by appropriate dilution of the standard stock solution. The pH value of the solutions was adjusted using 1 mol L−1 HCl and 1 mol L−1 NaOH and calibrated using a pH meter (METTLER TOLEDO FE20K) fitted with a combination glass electrode. Other chemical reagents such as sulfuric acid, phosphate acid and diphenylcarbazide were also of analytical grade.
2.2. Synthesis of Zn(II) dithiocarbamate/ZnS nanocomposite
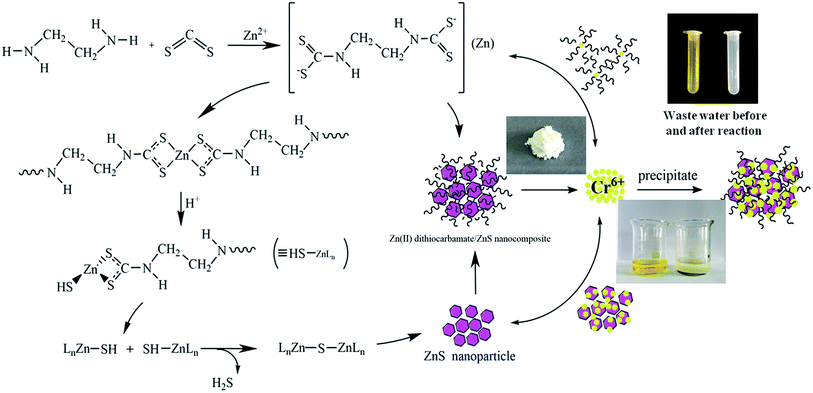
The micromolecular Zn(II) dithiocarbamate/ZnS nanocomposite was synthesized as follows: ethylenediamine (50 mL) was added to three-necked flask and cooled in a ice-water bath. Carbon disulfide solution was then slowly added into the flask while the mixture was stirred. Zinc chloride was dissolved in 200 mL deionized water and then added into the flask after a 10 min reaction. The product was heated to 70 °C and holding time 3 h. The resultant mixture was washed with deionized water for three times and dried it at 60 °C for 48 h. The procedure for the synthesize of Zn(II) dithiocarbamate/ZnS nanocomposite was depicted in Fig. 1.
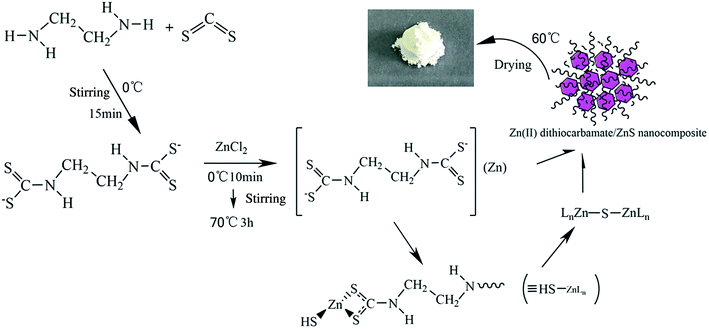 |
| | Fig. 1 Schematic diagram of the synthesize of Zn(II) dithiocarbamate/ZnS nanocomposite. | |
2.3. Characterization of Zn(II) dithiocarbamate/ZnS nanocomposite
The infra-red (FTIR) spectra of samples were obtained on a Bruker Vertex 70 FT-IR Infrared Spectrophotometer by accumulating 16 scans in a region of 4000–400 cm−1 and with a resolution of 4 cm−1. The data was then analyzed with the Omnic analysis software to determine the functional groups. X-ray diffraction (XRD) patterns were collected on a Rigaku D/max-2200VPC diffractometer with the CuKα radiation operated at 40 kV and 50 mA for the analysis of crystalline structure. The samples were dispersed by ethyl alcohol to observe the morphology characteristics, with Field Emission Scanning Electron Microscope (FESEM) images taken on a JEOL JSM-7500F microscope at 15 keV. For transmission electron microscope (TEM) study, the samples were dispersed onto a Cu grid with a holey carbon supporting film and studied at room temperature in an FEI Tecnai 12 microscope operated at 120 kV. The specific surface area was obtained by the Brunauer–Emmett–Teller (BET) method, and the pore size distribution was calculated from the adsorption branch of the isotherm using density functional theory (DFT).
2.4. Cr6+ removal experiments
A series of adsorption experiments were performed to investigate the efficiency of the obtained Zn(II) dithiocarbamate/ZnS nanocomposite in removing Cr6+ from aqueous solutions. The Cr6+ solutions with different concentrations were prepared by dissolving K2Cr2O7 in deionized water. The experiments were carried out with 20 mL of working solution with a certain Cr6+ concentration. The concentration of Cr6+ in the aqueous solutions was measured by the National standard method (GB 7467-87). The dosages of Zn(II) dithiocarbamate/ZnS nanocomposite were set as 0.01, 0.02, 0.05, 0.1, 0.2 and 0.5 g; the pH values of the K2Cr2O7 solutions were adjusted to 1–12 by using 1 mol L−1 HCl and 1 mol L−1 NaOH solutions; temperature experiments were carried out in a constant temperature water bath magnetic stirrer at temperatures ranging from 293 K to 323 K. When the adsorption reached the equilibrium, the residual Cr6+ content in the solution was measured. The adsorption capacity of the Zn(II) dithiocarbamate/ZnS nanocomposite for the Cr6+ removal was then calculated as follows:| |
 | (1) |
where qe is the equilibrium adsorption quantity (mg g−1); C0 and Ce represent the initial and equilibrium concentrations of Cr6+ solution (mg L−1), respectively; V is the volume of the K2Cr2O7 solution (L); m is the quality of Zn(II) dithiocarbamate/ZnS nanocomposite (g). The percentage of chromium removal denoted as R (%) was calculated using the following equation:| |
 | (2) |
3. Results and discussion
3.1. Characterization of Zn(II) dithiocarbamate/ZnS nanocomposite
3.1.2. FESEM and TEM analysis results. FESEM images of Zn(II) dithiocarbamate/ZnS nanocomposite showed that it was formed in a sponge-like hierarchical structure (Fig. 3(a)) with an average diameter of 10 nm. The image of the nanoparticle after the reaction showed a serious skin-core structure, implying that lots of Zn(II) dithiocarbamate/ZnS nanocomposites were consumed during the reaction process (Fig. 3(b)). The EDX analysis results of the element distribution in the Zn(II) dithiocarbamate/ZnS nanocomposite are presented in Fig. 4. The presence of Zn, S, C and N elements, which exist in dithiocarbamate, was confirmed and were exclusively distributed in the core area of the imaged of nanocomposite.31 Both the FESEM and the EDX analyses confirmed the uniform structure of the Zn(II) dithiocarbamate/ZnS nanocomposite. According to the TEM images (Fig. 5), which had a high magnification of Zn(II) dithiocarbamate/ZnS nanocomposite, all the samples were composed of many petty nanoparticles with the size of 1–2 nm, which were slightly agglomerated, implying the prepared nanoparticles has a small and narrow size distribution.
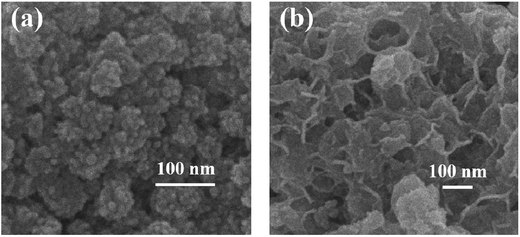 |
| | Fig. 3 (a) FESEM images of Zn(II) dithiocarbamate/ZnS nanocomposite; (b) FESEM image of nanoparticles after adsorption reaction. | |
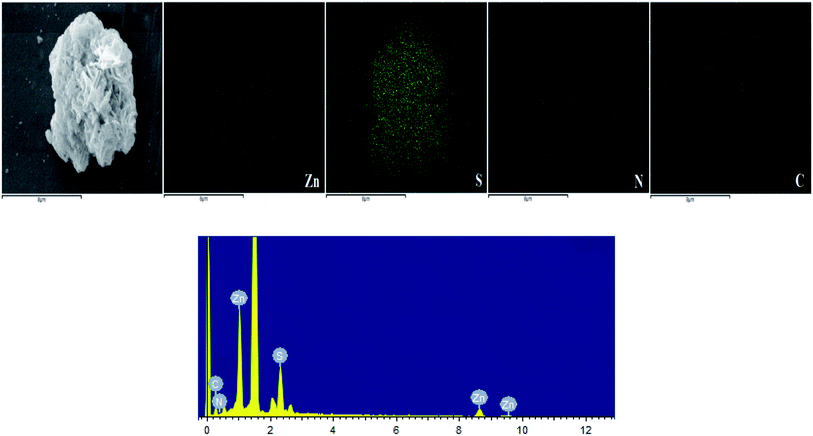 |
| | Fig. 4 FESEM images of Zn(II) dithiocarbamate/ZnS nanocomposite and EDS elemental mapping results of Zn, S, N and C elements (the highest peak in the EDS was background platinum). | |
 |
| | Fig. 5 TEM images of Zn(II) dithiocarbamate/ZnS nanocomposite. | |
3.1.3. XRD analysis results. The XRD pattern of Zn(II) dithiocarbamate/ZnS nanocomposite is showed in Fig. 6. It is showed the sample contained C4H6N2S4Zn (marked with “†”) and ZnS (marked with “#”) with a hexagonal crystals phase (JCPDS card no. 83-1700). The broad peaks at 2θ angles of 27.039°, 29.362° and 48.558° with corresponding Miller indices of (104), (1022) and (0090), respectively, corresponded to ZnS in the nanocomposite. As calculated using the Scherrer equation, D = Rλ/β![[thin space (1/6-em)]](https://www.rsc.org/images/entities/char_2009.gif) cos
cos![[thin space (1/6-em)]](https://www.rsc.org/images/entities/char_2009.gif) θ, in which R is the Scherrer constant, λ is wavelength of the X-ray beam, β is FWHM value in XRD data and θ is the Bragg angle, the average particle size of the C4H6N2S4Zn nanoparticle was about 2 nm, which was consistent with the TEM images.
θ, in which R is the Scherrer constant, λ is wavelength of the X-ray beam, β is FWHM value in XRD data and θ is the Bragg angle, the average particle size of the C4H6N2S4Zn nanoparticle was about 2 nm, which was consistent with the TEM images.
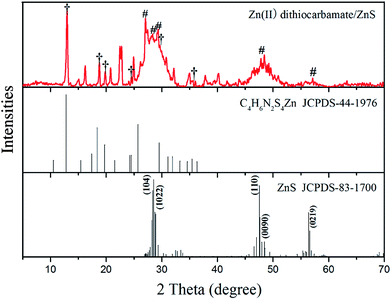 |
| | Fig. 6 XRD patterns of Zn(II) dithiocarbamate/ZnS nanocomposite. | |
3.2. Cr6+ removal efficiency
3.2.1. Effect of Zn(II) dithiocarbamate/ZnS nanocomposite dosage. The effects of different dosages of Zn(II) dithiocarbamate/ZnS nanocomposite on the degradation rate of Cr6+ in aqueous solutions are shown in Fig. 7. It seems that the removal efficiency of Cr6+ increased from 18.9% to 97.2% when the dosage increased from 0.01 to 0.2 g. The corresponding removal efficiency of Cr6+ solutions reached 99% when the dosage reached 0.2 g, beyond which no longer growth was seen, indicating that the available reaction sites became saturated.32,33
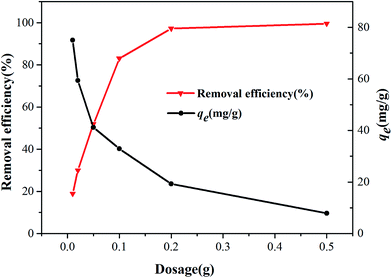 |
| | Fig. 7 Effect of dosage on the Cr6+ removal efficiency of Zn(II) dithiocarbamate/ZnS nanocomposite (conditions: 20 mL medium; 200 mg L−1 initial concentration of Cr6+; pH = 4.5; 10 min contact time; 293 K). | |
3.2.2. Effect of pH value. The Cr6+ can exist in several stable forms such as H2CrO4, HCrO4−, CrO42−, HCr2O7−, Cr2O72−.34 Their relative abundance mainly depends on the pH value of the solution and the total Cr6+ concentration.35 Therefore, the effect of pH value (ranging from 1.0 to 12.0) on the Cr6+ adsorption was observed. As shown in Fig. 8, with the increase of pH value, the Cr6+ removal efficiency decreased slightly from 99.9% (pH = 1.0) to 95.2% (pH = 12.0). The difference in the qe values was only 0.9 mg g−1, which demonstrated the pH value had little impact on the Cr6+ removal. Due to the large quantity of hydronium ions (H+) existing in the solution, thus the samples show a relatively higher removal efficiency in acid environment, which made the nanocomposite surface more positively charged, leading to a higher removal rate of Cr6+. The reason was that binding capacity of anionic Cr6+ ion species with the positively charged groups was enhanced.36,37
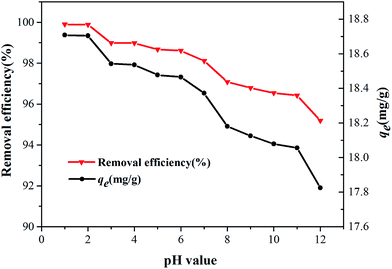 |
| | Fig. 8 Effect of pH value on the removal efficiency (conditions: 20 mL medium; 200 mg L−1 initial concentration of Cr6+; 0.2 g dosage; 10 min contact time; 293 K). | |
3.2.3. Effect of temperature. Temperature is an essential parameter influencing the adsorption behavior and the wastewater temperature does vary widely.35 The effect of reaction temperature on the adsorption was investigated by varying the reaction temperature from 293 K to 323 K with the initial Cr6+ concentration of 1200 mg L−1. Fig. 9 shows that the adsorption capacity increased from 49.4 to 73.2 mg g−1 with the temperature increase from 293 K to 323 K, indicating the endothermic nature of the adsorption reaction of Cr6+ by nanocomposite. As a certain amount of heating can improve the efficiency of adsorption illustrates the potential capacity of nanocomposite was not played out adequately at room temperature, suggests that a greater potential of adsorption capacity was exist for Zn(II) dithiocarbamate/ZnS nanocomposite.
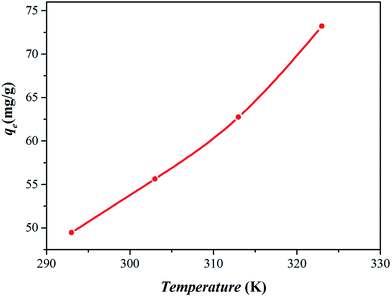 |
| | Fig. 9 Effect of temperature on the removal efficiency (conditions: 20 mL medium; 200 mg L−1 initial concentration of Cr6+; 0.2 g dosage; pH = 4.5; 10 min contact time). | |
3.3. Discussion
3.3.1. Adsorption kinetics. In order to interpret the mechanisms of Cr6+ adsorption processes, the kinetic study provides the adsorption characteristics of adsorption system were carried out in Cr6+ solution. The pseudo first-order, second-order kinetic models and intraparticle diffusion model were all used to describe the kinetic processes and equations were given as follows:2,25The pseudo-first-order rate equation given by Lagergren and Svenskais expressed as
| |
 | (3) |
where
k1 (1 min
−1) is the pseudo-first-order adsorption rate constant,
Qe is the adsorption capacity at equilibrium, and
Qt denotes the adsorption capacity at reaction time
t (min), both in mg g
−1.
The pseudo-second-order rate is based on the sorption capacity of the solid phase and represented as
| |
 | (4) |
where
k2 is the rate constant of pseudo-second-order adsorption model (g (mg min)
−1),
Qe and
Qt are the adsorption capacity of Cr
6+ at equilibrium and time
t (min), respectively, both in mg g
−1.
The intraparticle diffusion rate is expressed according to equation given by Weber and Morris and represented as
where
Qt is the adsorption capacity at time
t (mg g
−1), and
ki are the adsorption rate constants of intraparticle diffusion rate (mg g min
1/2)
−1.
C is a constant related to boundary layer thickness. The value can be obtained from the plot slope of
Qt versus t1/2.
The important kinetic parameters of pseudo first-order, pseudo second-order model and intraparticle diffusion model and the correlation coefficient for the adsorption of Cr6+ by Zn(II) dithiocarbamate/ZnS nanocomposites were tabulated in Table 1 and the fitting lines of pseudo second-order model for the adsorption of Cr6+ was shown in Fig. 10. Evidently, in Table 1, the experimental data were tested with pseudo-first-order model, the correlation coefficient values (R2 = 0.8973) was deviated away from unity, suggested that the pseudo-first-order model was not provide the satisfactory fit for the kinetic. After the data were further fitted with pseudo-second-order model, the correlation coefficient values (R2 = 0.999) was closer to unity and the theoretical Qe values (19.011) were close to the experimental Qe values (18.997), which demonstrated that the adsorption of Cr6+ by Zn(II) dithiocarbamate/ZnS nanocomposite obeys pseudo-second-order model and the chemisorption is the rate-controlling step.25 Meanwhile, it could be inferred by Fig. 10 that the rate-determining step may be a chemical adsorption involving valence forces through sharing or exchanging of electrons between adsorbent and adsorbate,2 which provided evidence for reaction mechanism of Zn(II) dithiocarbamate/ZnS nanocomposites.
Table 1 First-order, second-order and intraparticle diffusion kinetic models constants
| C0 (mg L−1) |
Qe (exp) (mg g−1) |
First-order rate constants |
Second-order rate constants |
Intraparticle diffusion model |
| k1 (1 min−1) |
Qe (theor.) (mg g−1) |
R2 |
k2 (g (mg min)−1) |
Qe (theor.) (mg g−1) |
R2 |
ki (mg (g min1/2)−1) |
C (mg g−1) |
R2 |
| 200 |
18.997 |
3.682 |
18.942 |
0.8973 |
1.299 |
19.011 |
0.9999 |
0.104 |
18.500 |
0.7218 |
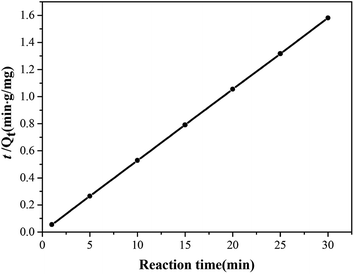 |
| | Fig. 10 Pseudo second-order kinetic model of adsorption for Cr6+ by Zn(II) dithiocarbamate/ZnS nanocomposite. | |
As seen from Fig. 11, the kinetics adsorption of Cr6+ suggested that divided into two stages. Firstly, an initial rapid stage where adsorption was fast which inferred that was the instantaneous adsorption or the adsorption onto external surface and more availability adsorption sites or smaller mass transfer resistance on the surface of adsorbent with the continuation reaction.29 The second stage was a slower rapid to the final equilibrium due to the total metal adsorption sites was relatively small and the intraparticle diffusion controlled the adsorption rate in gradual adsorption stage until the metal uptake reaches equilibrium finally.38 However, intraparticle diffusion was not the sole rate limiting step since the plot was not passed through the origin, and suggested that there were more than one process controlling the adsorption process.39 Meanwhile, the slope of each linear signified the rate of the adsorption process. Consequently, the plot in Table 1 indicated that the process of surface diffusion was faster than the intraparticle diffusion.40
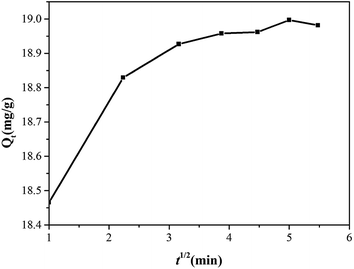 |
| | Fig. 11 Plot of intraparticle diffusion model for the adsorption of Cr6+ by Zn(II) dithiocarbamate/ZnS nanocomposite. | |
3.3.2. Adsorption isotherms. The effect of reaction temperature on adsorption was investigated by varying the initial Cr6+ concentration (200–1200 mg L−1) and reaction temperature (293–323 K) with the equilibration time of 10 min. The adsorption data was analyzed by fitting the Langmuir isotherm model and Freundlich isotherm models as follows.Langmuir adsorption model can be described as
| |
 | (6) |
where
qe and
Ce is the equilibrium adsorption capacity (mg g
−1) and concentration (mg L
−1) for Cr
6+,
Kf (L mg
−1) is the Langmuir sorption constant related to the energy of adsorption,
qm represents the maximum monolayer adsorption capacity. The Langmuir model assumes a homogeneous surface with respect to the energy of adsorption, in which there is no interaction existed between adsorbed species, and all the adsorption sites are equally available to the adsorbed species.
41
Freundlich isotherm model can be described as
| |
 | (7) |
where
qe and
Ce is the equilibrium adsorption capacity on adsorbent (mg g
−1) and the equilibrium concentration of the solute (mg L
−1),
Kf ((mg
1−1/n L
1/n) g
−1) is the Freundlich constant being indicative of the extent of adsorption related to adsorption capacity, and
n is the heterogeneity factor as an indicator of adsorption effectiveness related to adsorption intensity,
Kf and
n can be obtained by a plot of ln(
qe) against ln(
Ce). Freundlich isotherm model can be applied to the non-ideal adsorption on heterogeneous surfaces as well as multilayer adsorption.
25
The effect of initial Cr6+ concentration on the adsorption properties by Zn(II) dithiocarbamate/ZnS nanocomposite was illustrated in Fig. 12. The result showed that the removal capacity of Cr6+ was quickly increased with the increasing of Cr6+ initial concentration ranging from 200 to 1200 mg g−1, especially in higher temperatures. The increasing in loading capacity of the adsorbent with the change of metal ions concentration can be explained with the high driving force for mass transfer24 and the higher mobility of Cr6+ in the solution increased the interaction of Cr6+ with Zn(II) dithiocarbamate/ZnS nanocomposite.42 The constants of Langmuir and Freundlich isotherms were calculated and listed in Table 2. As described in Table 2 and Fig. 13, the experimental data could be well fitted by Langmuir isotherm model as well as Freundlich isotherm model (R2 values were in the range of 0.98–0.99), which indicated that both Langmuir and Freundlich isotherm models were obeyed, suggested that the adsorption of Cr6+ by Zn(II) dithiocarbamate/ZnS nanocomposite was homogeneous and multilayer in nature.43 The results illustrated that the maximum adsorption amount of Cr6+ by Zn(II) dithiocarbamate/ZnS nanocomposite was 50.176, 57.208, 63.654 and 75.301 mg g−1 at 293 to 323 K, respectively.
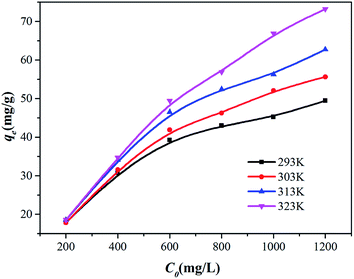 |
| | Fig. 12 Adsorption isotherm of Cr6+ initial concentration. | |
Table 2 Langmuir and Freundlich isotherms constants on Cr6+ removal by Zn(II) dithiocarbamate/ZnS nanocomposite
| Temperature (K) |
Langmuir isotherm |
Freundlich isotherm |
| Kf (L mg−1) |
qm (mg g−1) |
R2 |
Kf (mg1−1/n L1/n g−1) |
n |
R2 |
| 293 |
0.0298 |
50.1756 |
0.9903 |
13.6991 |
0.1996 |
0.9957 |
| 303 |
0.0296 |
57.2082 |
0.9874 |
14.1697 |
0.2177 |
0.9952 |
| 313 |
0.0366 |
63.6537 |
0.9881 |
15.7869 |
0.2248 |
0.9945 |
| 323 |
0.0372 |
75.3012 |
0.9811 |
16.2377 |
0.2541 |
0.9917 |
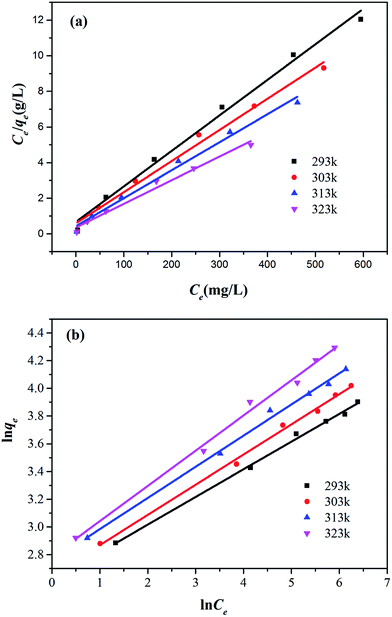 |
| | Fig. 13 (a) Langmuir adsorption isotherms and (b) Freundlich adsorption isotherms at 293 K, 303 K, 313 K and 323 K respectively. | |
RL is another essential characteristic of Langmuir isotherm which can be expressed in terms of dimensionless constant separation factor and assumes significance when it is between 0 and 1 or values greater than unity accounts for unfavorable isotherm.44 The separation factor RL is defined as
| |
 | (8) |
where
RL indicates the favorability and removal capacity of the reaction system,
C0 is the initial concentration (mg L
−1) of Cr
6+ and
Kf is the Langmuir adsorption equilibrium constant (L mg
−1).
RL > 1,
RL = 1, 0 <
RL < 1 and
RL = 0 suggest that the adsorption is unfavorable, linear, favorable and irreversible, respectively.
45 The values of
RL (0.022–0.144) for sorption of Cr
6+ by Zn(
II) dithiocarbamate/ZnS nanocomposite at 293 to 323 K ranging from 200 to 1200 mg g
−1 are all less than 1 and greater than 0, which indicated that the uptake of Cr
6+ onto Zn(
II) dithiocarbamate/ZnS nanocomposite is favorable.
Meanwhile, there was a slightly higher correlation coefficient for the Freundlich isotherm model as seen in Table 2 (R2 > 0.99), the result indicated that some heterostructure which uniformly distributed on the surface of Zn(II) dithiocarbamate/ZnS nanocomposite play a role in Cr6+ adsorption. The value of 1/n ranging between 0 and 1 at all temperatures indicated that the adsorption of Cr6+ by Zn(II) dithiocarbamate/ZnS nanocomposite was favorable, and the value obtained from Freundlich isotherm model reflects the good affinity between Cr6+ and Zn(II) dithiocarbamate/ZnS nanocomposite. The Freundlich constant, Kf, obtained for the adsorption process were 13.699, 14.170, 15.787 and 16.238 at 293 to 323 K, respectively. This indicated that the adsorption capacity of Zn(II) dithiocarbamate/ZnS nanocomposite increased with increasing of temperature, demonstrated the reaction was endothermic adsorption. This is consistent with the effect of the temperature on Cr6+ adsorption.46
3.4. Adsorption mechanism
According to all above-mentioned analyses, the possible reaction mechanism between the Cr6+ and the synthesized Zn(II) dithiocarbamate/ZnS nanocomposite is extrapolated as follows and shown in Fig. 15. The Cr6+ removal by nanocomposite is thought to be involved with two steps. Firstly, the Cr6+ ions were chelated by the functional group of HNC(![[double bond, length as m-dash]](https://www.rsc.org/images/entities/char_e001.gif) S)S– in the Zn(II) dithiocarbamate with a certain molecular ratio. The Zn(II) dithiocarbamate was bonded to the Cr6+ and formed a complexing agent ring surrounding the Cr6+. Secondly, the Cr6+ ions were adsorbed on the ZnS nanocomposite which having open ends with only sulphur atoms, and consequently catalyze adsorption of metal cations on them due to negatively polarized. Meanwhile, the adsorption mechanism of Cr6+ using Zn(II) dithiocarbamate/ZnS nanocomposites is also likely to relied on synergistic combination of electrostatic interaction (between Cr6+ and functional groups such as DTC groups and open ends with only sulphur atoms on ZnS) and some other stronger chemical interactions. In order to confirm this, FTIR was performed. The red-shift and the intensity reduction of characteristic FTIR DTC signals (C–S and C
S)S– in the Zn(II) dithiocarbamate with a certain molecular ratio. The Zn(II) dithiocarbamate was bonded to the Cr6+ and formed a complexing agent ring surrounding the Cr6+. Secondly, the Cr6+ ions were adsorbed on the ZnS nanocomposite which having open ends with only sulphur atoms, and consequently catalyze adsorption of metal cations on them due to negatively polarized. Meanwhile, the adsorption mechanism of Cr6+ using Zn(II) dithiocarbamate/ZnS nanocomposites is also likely to relied on synergistic combination of electrostatic interaction (between Cr6+ and functional groups such as DTC groups and open ends with only sulphur atoms on ZnS) and some other stronger chemical interactions. In order to confirm this, FTIR was performed. The red-shift and the intensity reduction of characteristic FTIR DTC signals (C–S and C![[double bond, length as m-dash]](https://www.rsc.org/images/entities/char_e001.gif) S stretching vibrations) following the adsorption of Cr6+, clearly demonstrated that the coordination interactions between Cr6+ and DTC groups actually occurred (see Fig. 2). BET demonstrated the mesopores in the nanocomposites might make a synergistic effect on the removing of Cr6+. The enhanced degradation rate of Cr6+ might be attributed to the novel configuration of the Zn(II) dithiocarbamate/ZnS heterostructure, which is conductive and enables a large interface for the reactions. The significantly increased adsorption and surface reaction, facilitated a high efficient on Cr6+ removal.
S stretching vibrations) following the adsorption of Cr6+, clearly demonstrated that the coordination interactions between Cr6+ and DTC groups actually occurred (see Fig. 2). BET demonstrated the mesopores in the nanocomposites might make a synergistic effect on the removing of Cr6+. The enhanced degradation rate of Cr6+ might be attributed to the novel configuration of the Zn(II) dithiocarbamate/ZnS heterostructure, which is conductive and enables a large interface for the reactions. The significantly increased adsorption and surface reaction, facilitated a high efficient on Cr6+ removal.
 |
| | Fig. 15 Reaction mechanism during the Cr6+ removal. | |
4. Summary
A simple but efficient method has been developed to prepare a novel Zn(II) dithiocarbamate/ZnS nanocomposite with a high efficiency in removing Cr6+ from aqueous solutions. The removal efficiency of Cr6+ could reach 98% just within a few seconds. It was shown that the Zn(II) dithiocarbamate/ZnS nanocomposite exhibited an excellent capacity on the Cr6+ removal at almost all the pH values, and the degradation rate increased gradually with the reaction temperature up to 323 K. The nanocomposite possesses higher maximum adsorption capacities for Cr6+ of 73.2 mg g−1. The adsorption process for Cr6+ by nanocomposite can be explained with pseudo second-order type kinetic model, which is based on the assumption that the rate-determining step is a chemical adsorption. The adsorption patterns of Zn(II) dithiocarbamate/ZnS nanocomposite were well described by the Freundlich isotherm with high correlation coefficients (>0.99). The values of the thermodynamic parameters show that the Cr6+ adsorption process was endothermic and favorable at high temperatures. Due to its simple, safe and rapid reaction nature, use of the above novel Zn(II) dithiocarbamate/ZnS nanocomposite has great potential in practical applications for removing the Cr6+ from wastewater.
Acknowledgements
The authors of this contribution gratefully acknowledge support of the ongoing project of National Natural Science Foundation of China (Contract No. 51420105015), 973 Program (Contract No. 2015CB655100) and 111 Program. This work was also supported by the National Natural Science Foundation of China (51508293), the National science foundation of China project (51478406), the Qingdao applied research project (17-1-1-87-jch), the China Postdoctoral Science Foundation Funded Project (2016M600527). The first author also would like to acknowledge the fellowship support received from the Hong Kong Scholar Programme (G-YZ78).
References
- L. J. Guo, C. G. Niu, X. Y. Wang, X. J. Wen and G. M. Zeng, Water, Air, Soil Pollut., 2016, 227, 1–11 CrossRef CAS.
- H. B. Zhen, Q. Xu, Y. Y. Hu and J. H. Cheng, Chem. Eng. J., 2012, 209, 547–557 CrossRef CAS.
- B. B. Jia, J. N. Wang, J. Wu and C. J. Li, Chem. Eng. J., 2014, 254, 98–105 CrossRef CAS.
- L. Zhang and Y. G. Zhang, Appl. Surf. Sci., 2014, 316, 649–656 CrossRef CAS.
- N. N. Das, J. Konar, M. K. Mohanta and S. C. Srivastava, J. Colloid Interface Sci., 2004, 270, 1–8 CrossRef CAS PubMed.
- F. B. Liang, Y. L. Song, C. P. Huang, J. Zhang and B. H. Chen, J. Environ. Chem. Eng., 2013, 1, 1301–1308 CrossRef CAS.
- J. Samuel, M. Pulimi, M. L. Paul, A. Maurya, N. Chandrasekaran and A. Mukherjee, Bioresour. Technol., 2013, 128, 423–430 CrossRef CAS PubMed.
- C. J. Li, Y. J. Li, J. N. Wang and J. Cheng, Chem. Eng. J., 2013, 220, 294–301 CrossRef CAS.
- M. Gheju and I. Balcu, J. Hazard. Mater., 2011, 196, 131–138 CrossRef CAS PubMed.
- S. Y. Guo, S. Han, B. Chi, J. Pu and J. Li, J. Power Sources, 2014, 245, 979–985 CrossRef CAS.
- S. C. Xu, S. S. Pan, Y. Xu, Y. Y. Luo, Y. X. Zhang and G. H. Li, J. Hazard. Mater., 2015, 283, 7–13 CrossRef CAS PubMed.
- Y. I. Choi, S. Lee, S. K. Kim, Y.-I. Kim, D. W. Cho, M. M. Khan and Y. Sohn, J. Alloys Compd., 2016, 675, 46–56 CrossRef CAS.
- S. Y. Guo, T. J. Zhao, J. Z. Quan and S. Han, J. Power Sources, 2015, 293, 17–22 CrossRef CAS.
- S. Y. Guo, S. Han, B. Chi, J. Pu and J. Li, J. Power Sources, 2014, 267, 9–13 CrossRef CAS.
- M. M. Khan, J. Saudi Chem. Soc., 2015, 19, 462–464 CrossRef.
- S. Y. Guo, S. Han, B. Chi, J. Pu and J. Li, ACS Appl. Mater. Interfaces, 2014, 6, 4743–4751 CAS.
- R. Narayanan and M. A. El-Sayed, Nano Lett., 2004, 4, 1343–1348 CrossRef CAS.
- S. Y. Guo, S. Han, B. Chi, J. Pu and J. Li, J. Alloys Compd., 2012, 544, 50–54 CrossRef CAS.
- M. M. Khan, S. A. Ansari, D. Pradhan, M. O. Ansari, D. H. Han, J. Lee and M. H. Cho, J. Mater. Chem. A, 2014, 2, 637–644 CAS.
- H. H. Qian, Y. Hu, Y. Liu, M. J. Zhou and C. F. Guo, Mater. Lett., 2012, 68, 174–177 CrossRef CAS.
- S. Y. Guo, S. Han, B. Chi, J. Pu and J. Li, Mater. Res. Bull., 2013, 48, 3032–3036 CrossRef CAS.
- S. Y. Guo, S. Han, B. Chi, J. Pu and J. Li, Int. J. Hydrogen Energy, 2014, 39, 2446–2453 CrossRef CAS.
- Z. L. Li, J. Ind. Eng. Chem., 2014, 20, 586–590 CrossRef CAS.
- L. Bai, H. P. Hu, W. Fu, J. Wan, X. L. Cheng, L. Zhuge, L. Xiong and Q. Y. Chen, J. Hazard. Mater., 2011, 195, 261–275 CrossRef CAS PubMed.
- B. Xiang, W. Fan, X. W. Yi, Z. H. Wang, F. Gao, Y. J. Li and H. B. Gu, Carbohydr. Polym., 2016, 136, 30–37 CrossRef CAS PubMed.
- O. S. Akintola, T. A. Saleh, M. M. Khaled and O. C. S. A. Hamouz, J. Taiwan Inst. Chem. Eng., 2016, 60, 602–616 CrossRef CAS.
- R. Abu-El-Halawa and S. A. Zabin, J. Taibah Univ. Sci., 2017, 11, 57–65 CrossRef.
- A. Denizli, K. Kesenci, Y. Arica and E. Piskin, React. Funct. Polym., 2000, 44, 235–243 CrossRef CAS.
- B. J. Liu, X. Lv, X. H. Meng, G. Yu and D. F. Wang, Chem. Eng. J., 2013, 220, 412–419 CrossRef CAS.
- T. Mahvelati-Shamsabadi and E. K. Goharshadi, Ultrason. Sonochem., 2017, 34, 78–89 CrossRef CAS PubMed.
- N. Srinivasan and S. Thirumaran, C. R. Chim., 2014, 17, 964–970 CrossRef CAS.
- M. S. Karmacharya, V. K. Gupta and V. K. Jha, Trans. Indian Ceram. Soc., 2016, 75, 1–8 CrossRef.
- T. A. Khan, M. Nazir, I. Ali and A. Kumar, Arabian J. Chem., 2013, 019, 1–11 Search PubMed.
- C. Jung, J. Y. Heo, J. H. Han, N. Her, S. Lee, J. Oh, J. Ryu and Y. Yoon, Sep. Purif. Technol., 2013, 106, 63–71 CrossRef CAS.
- Z. K. Wang, C. L. Ye, X. Y. Wang and J. Li, Appl. Surf. Sci., 2013, 287, 232–241 CrossRef CAS.
- S. H. Chen, Q. Y. Yue, B. Y. Gao and X. Xu, J. Colloid Interface Sci., 2010, 349, 256–264 CrossRef CAS PubMed.
- T. S. Anirudhan, J. Nima and P. L. Divya, Appl. Surf. Sci., 2013, 279, 441–449 CrossRef CAS.
- Q. Li, J. G. Yu, F. Zhou and X. Y. Jiang, Colloid Surface A: Physicochem. Eng. Aspects., 2015, 482, 306–314 CrossRef CAS.
- K. Z. Setshedi, M. Bhaumik, S. Songwane, A. Maity and M. S. Onyango, Chem. Eng. J., 2013, 222, 186–197 CrossRef CAS.
- N. Rajic, D. Stojakovic, M. Jovanovic, N. Z. Logar, M. Mazaj and V. Kaucic, Appl. Surf. Sci., 2010, 257, 1524–1532 CrossRef CAS.
- K. K. H. Choy, J. F. Porter and G. McKay, J. Chem. Eng. Data, 2000, 45, 575–584 CrossRef CAS.
- P. Xu, G. M. Zeng, D. L. Huang, C. Lai, M. H. Zhao, Z. Z. Wei, N. J. Li, C. Huang and G. X. Xie, Chem. Eng. J., 2012, 203, 423–431 CrossRef CAS.
- T. A. Khan, M. Nazir, I. Ali and A. Kumer, Arabian J. Chem., 2013, 39, 1–11 Search PubMed.
- A. S. K. Kumar, S. S. Kakan and N. Rajesh, Chem. Eng. J., 2013, 230, 328–337 CrossRef CAS.
- Y. Liu, Z. C. Liu, J. L. Gao, J. D. Dai, J. Han, Y. Wang, J. M. Xie and Y. S. Yan, J. Hazard. Mater., 2011, 186, 197–205 CrossRef CAS PubMed.
- S. H. Chen, Q. Y. Yue, B. Y. Gao and X. Xu, J. Colloid Interface Sci., 2010, 349, 256–264 CrossRef CAS PubMed.
- J. F. Dingman, K. M. Gloss, E. A. Milano and S. Siggia, Anal. Chem., 1974, 46, 774–777 CrossRef CAS.
|
| This journal is © The Royal Society of Chemistry 2017 |
Click here to see how this site uses Cookies. View our privacy policy here.  Open Access Article
 *b,
Dong-Shuai Houb,
Peng Zhangb,
Jun Shangb,
Shen Wanga and
Song Han*a


![[double bond, length as m-dash]](https://www.rsc.org/images/entities/char_e001.gif) S) were also observed. The band around 1360 cm−1 was assigned to the stretching vibration of the C
S) were also observed. The band around 1360 cm−1 was assigned to the stretching vibration of the C![[double bond, length as m-dash]](https://www.rsc.org/images/entities/char_e001.gif) S group in the –CSS− structure.29 The bands at 920 cm−1 and 996 cm−1 were attributed to the C–S− group in the CSS− structure.26 The characteristic adsorption peak appearing at 659 cm−1 was attributed to the C–S vibration.24 Meanwhile, the strong absorption bands in the range of 450–650 cm−1, were related to the vibrational characteristics of ZnS.
S group in the –CSS− structure.29 The bands at 920 cm−1 and 996 cm−1 were attributed to the C–S− group in the CSS− structure.26 The characteristic adsorption peak appearing at 659 cm−1 was attributed to the C–S vibration.24 Meanwhile, the strong absorption bands in the range of 450–650 cm−1, were related to the vibrational characteristics of ZnS.
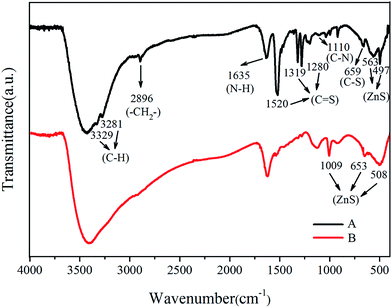
![[double bond, length as m-dash]](https://www.rsc.org/images/entities/char_e001.gif) S (1520 cm−1) stretching were not observed from the FTIR spectra. The absorption assignable to C
S (1520 cm−1) stretching were not observed from the FTIR spectra. The absorption assignable to C![[double bond, length as m-dash]](https://www.rsc.org/images/entities/char_e001.gif) S vibration in the region 1319–1280 cm−1 were less intense. The strong absorption bands in the range of 450–650 cm−1 were related to the vibrational characteristics of ZnS. The group peaks at around 1000 cm−1 were assigned to the ZnS lattice which originated from the resonance interaction between vibrational modes of sulfide ions in the crystal.30
S vibration in the region 1319–1280 cm−1 were less intense. The strong absorption bands in the range of 450–650 cm−1 were related to the vibrational characteristics of ZnS. The group peaks at around 1000 cm−1 were assigned to the ZnS lattice which originated from the resonance interaction between vibrational modes of sulfide ions in the crystal.30

![[thin space (1/6-em)]](https://www.rsc.org/images/entities/char_2009.gif) cos
cos![[thin space (1/6-em)]](https://www.rsc.org/images/entities/char_2009.gif) θ, in which R is the Scherrer constant, λ is wavelength of the X-ray beam, β is FWHM value in XRD data and θ is the Bragg angle, the average particle size of the C4H6N2S4Zn nanoparticle was about 2 nm, which was consistent with the TEM images.
θ, in which R is the Scherrer constant, λ is wavelength of the X-ray beam, β is FWHM value in XRD data and θ is the Bragg angle, the average particle size of the C4H6N2S4Zn nanoparticle was about 2 nm, which was consistent with the TEM images.


![[thin space (1/6-em)]](https://www.rsc.org/images/entities/char_2009.gif) ln
ln![[thin space (1/6-em)]](https://www.rsc.org/images/entities/char_2009.gif) Kd
Kd

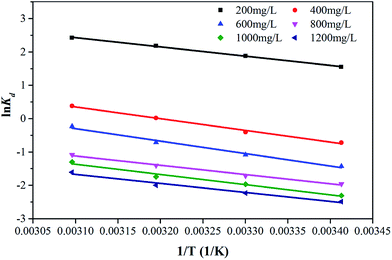
![[thin space (1/6-em)]](https://www.rsc.org/images/entities/char_2009.gif) Kd versus 1/T plots in Fig. 14 and the calculated values of thermodynamic parameters were listed in Table 3.
Kd versus 1/T plots in Fig. 14 and the calculated values of thermodynamic parameters were listed in Table 3.
![[double bond, length as m-dash]](https://www.rsc.org/images/entities/char_e001.gif) S)S– in the Zn(II) dithiocarbamate with a certain molecular ratio. The Zn(II) dithiocarbamate was bonded to the Cr6+ and formed a complexing agent ring surrounding the Cr6+. Secondly, the Cr6+ ions were adsorbed on the ZnS nanocomposite which having open ends with only sulphur atoms, and consequently catalyze adsorption of metal cations on them due to negatively polarized. Meanwhile, the adsorption mechanism of Cr6+ using Zn(II) dithiocarbamate/ZnS nanocomposites is also likely to relied on synergistic combination of electrostatic interaction (between Cr6+ and functional groups such as DTC groups and open ends with only sulphur atoms on ZnS) and some other stronger chemical interactions. In order to confirm this, FTIR was performed. The red-shift and the intensity reduction of characteristic FTIR DTC signals (C–S and C
S)S– in the Zn(II) dithiocarbamate with a certain molecular ratio. The Zn(II) dithiocarbamate was bonded to the Cr6+ and formed a complexing agent ring surrounding the Cr6+. Secondly, the Cr6+ ions were adsorbed on the ZnS nanocomposite which having open ends with only sulphur atoms, and consequently catalyze adsorption of metal cations on them due to negatively polarized. Meanwhile, the adsorption mechanism of Cr6+ using Zn(II) dithiocarbamate/ZnS nanocomposites is also likely to relied on synergistic combination of electrostatic interaction (between Cr6+ and functional groups such as DTC groups and open ends with only sulphur atoms on ZnS) and some other stronger chemical interactions. In order to confirm this, FTIR was performed. The red-shift and the intensity reduction of characteristic FTIR DTC signals (C–S and C![[double bond, length as m-dash]](https://www.rsc.org/images/entities/char_e001.gif) S stretching vibrations) following the adsorption of Cr6+, clearly demonstrated that the coordination interactions between Cr6+ and DTC groups actually occurred (see Fig. 2). BET demonstrated the mesopores in the nanocomposites might make a synergistic effect on the removing of Cr6+. The enhanced degradation rate of Cr6+ might be attributed to the novel configuration of the Zn(II) dithiocarbamate/ZnS heterostructure, which is conductive and enables a large interface for the reactions. The significantly increased adsorption and surface reaction, facilitated a high efficient on Cr6+ removal.
S stretching vibrations) following the adsorption of Cr6+, clearly demonstrated that the coordination interactions between Cr6+ and DTC groups actually occurred (see Fig. 2). BET demonstrated the mesopores in the nanocomposites might make a synergistic effect on the removing of Cr6+. The enhanced degradation rate of Cr6+ might be attributed to the novel configuration of the Zn(II) dithiocarbamate/ZnS heterostructure, which is conductive and enables a large interface for the reactions. The significantly increased adsorption and surface reaction, facilitated a high efficient on Cr6+ removal.


