 Open Access Article
Creative Commons Attribution 3.0 Unported Licence
Efficient photocatalytic and photovoltaic applications with nanocomposites between CdTe QDs and an NTU-9 MOF†
Rajnish Kaurab,
Aniket Ranac,
Rajiv K. Singhc,
Varun A. Chhabrad,
Ki-Hyun Kim*e and
Akash Deep *ab
*ab
aCentral Scientific Instruments Organisation (CSIR-CSIO), Sector 30 C, Chandigarh, 160030, India. E-mail: dr.akashdeep@csio.res.in; Fax: +91-172-2657287; Tel: +91-172-2672236
bAcademy of Scientific and Innovative Research (AcSIR-CSIO), Sector 30 C, Chandigarh, 160030, India
cCSIR – National Physical Laboratory, Dr K.S Krishnan Marg, New Delhi, 110012, India
dCentre for Development of Advanced Computing, Phase VIII, Mohali 160071, India
eDepartment of Civil and Environmental Engineering, Hanyang University, 222 Wangsimni-Ro, Seoul 04763, Korea. E-mail: kkim61@hanyang.ac.kr; Fax: +82-2-2220-1945; Tel: +82-2-2220-2325
First published on 2nd June 2017
Abstract
A new photoactive hybrid nanostructure formed through an integration of quantum dots (QDs) and metal organic frameworks (MOFs) has been explored and assessed for its photocatalytic and photovoltaic performance. To this end, the QD–MOF nanocomposite was synthesized by mixing CdTe QDs during the formation of a titanium-based MOF ‘NTU-9,’ with titanium isopropoxide as a metal source and 2,5-dihydroxyterephthalic acid (H4DOBDC) as an organic ligand. The successful formation of this nanocomposite is verified using various microscopic and spectroscopic techniques. Because the CdTe/NTU-9 composite exhibited a considerably broadened light absorption profile, it has achieved a rapid (30 min) and visible light-driven photocatalytic degradation (>95%) of rhodamine 6G. Further, when this composite is tested as a photoanode material in a QD-sensitized solar cell (QD-DSSC), its power conversion efficiency improved by approximately 1.5% relative to the raw QD form. Accordingly, CdTe/NTU-9 is demonstrated as a potential candidate for future applications in photocatalysis and DSSCs. The key features of the proposed nanocomposite include improved light absorption, sub-micron scale processing, chemical and thermal stability, easier regeneration, and better photocatalytic/photovoltaic characteristics.
1. Introduction
Traditional semiconductor-type photocatalysts are generally operated under UV irradiation conditions, thus harvesting only 3–5% of the available solar energy.1–4 Hence, to design more advanced models of photocatalysts, it is essential to absorb a broader range of the solar spectrum, including visible light, for improved efficiency. For such improvement in harvesting capacity, a variety of nanomaterials, including semiconducting nanocrystals, e.g., quantum dots (QDs), have been explored for photocatalytic and/or photovoltaic applications.5–11 QDs with a diameter of 2–10 nm are generally characterized with broad absorption but with narrow and symmetrical emission bands. They are advantageous over traditional semiconductor materials in terms of low photobleaching, long lifetime, and high quantum yields.12–15 The feasibility of QDs for photocatalytic and photovoltaic applications has been demonstrated by many researchers.16–19 QDs can utilize a higher density of absorbed photons due to the exciting possibility of achieving multiple exciton generation (MEG).20–24CdTe QDs are a prominent example of efficient photoactive systems due to their broader light absorption profile, easily tunable size, and multiple exciton generation.25–31 Photocatalysis and photovoltaic technologies using CdTe as a key material are growing rapidly towards more advanced applications, and CdTe now represents the second most utilized solar cell material in the world after silicon.32 Solar panels based on CdTe are the first and only thin film photovoltaic technology to surpass crystalline silicon PV in terms of cost.33,34 In spite of several advancements in the field, an opportunity still exists to improve the efficiency of CdTe QD-based photocatalysts and photovoltaic systems. This is potentially achievable through improving their overall light absorption profile, surface area, thermal stability, and moisture tolerance; therefore, combining CdTe QDs with other advanced nanostructures is seen as a vital research opportunity to realize improved photocatalytic and photovoltaic systems.35–38
Metal organic frameworks (MOFs) represent a class of relatively new materials that can be efficiently combined with QDs to improve the overall properties of the resulting nanocomposite structures.39–41 An ever-increasing interest has been observed in the photocatalytic and photovoltaic applications of MOFs in recent years.42–46 A number of light-driven organic transformations as well as solar cell applications have thus been proposed with various MOFs.47–51 In some studies, the MOFs have been mixed with other solid-state materials to propose new molecular functionalities such as photocurrent response, broad UV emission characteristics, high luminescence, and enhanced photocatalytic performance.52–56
Nanocomposites of QDs with MOFs have been suggested with improved charge transfer mechanisms, lower recombination losses, and more efficient harvesting of light.20,21,57–59 The stacking of hundreds to thousands of QD particles on an MOF surface can provide a large optical cross section area and improve light harvesting properties.21 The distribution/immobilization of QDs over the surface of an MOF should also help regenerate the material when used as a photocatalyst. The porous network of MOFs is known to minimize charge recombination losses during photocatalytic or photovoltaic applications.60,61
In this study, we demonstrate the CdTe/NTU-9 nanocomposite as a new material with improved photocatalytic and photovoltaic characteristics. NTU-9 is a Ti(IV)-based MOF with attractive redox and photocatalytic properties in addition to the many special features of an MOF.62,63 As the band gap of NTU-9 is comparable with that of traditional semiconductor-based photocatalysts (TiO2), NTU-9 is an ideal candidate to improve the efficiency of QDs.64 The CdTe/NTU-9 composite has been assessed for the first time for visible-light-driven photocatalysis of rhodamine 6G. Subsequently, it was also explored for possible applications as a photosensitizer and light absorption anode material in a QD-based dye sensitized solar cell (QD-DSSC).
2. Experimental section
2.1. Materials and equipment
The chemicals used in this study are of analytical reagent grade and were purchased from Sigma/Merck, India; these include cadmium chloride, tellurium powder, cysteamine, sodium borohydride, titanium(IV) isopropoxide (Ti(i-OPr)4), 2,5-dihydroxyterephthalic acid (H4DOBDC), acetic acid, rhodamine 6G dye, titanium dioxide powder, and platinum metal.UV-Visible spectra were recorded using a Varian Cary 5000 spectrophotometer. Fourier transform infrared (FTIR) spectra were collected using a Nicolet iS10 FTIR instrument. The morphological and structural investigations were performed using a transmission electron microscope (TEM-H7500, Hitachi, Japan) and an X-ray diffractometer (Rigaku Ultima IV, copper as the X-ray anode, wavelength of CuKα radiation of 1.54 Å). The BET surface area measurements were carried out on a Belsorp Max system from Microtrac. Confocal laser scanning microscopy of the samples was carried out with an LSM Meta instrument (Zeiss make). Proton NMR studies were carried out with a Bruker Avance II 400 NMR spectrometer operating at 400 MHz at 297 K. Thin films of titanium oxide were grown on FTO substrates via an electron beam gun evaporation technique (PLS 570 coating plant, Pfeiffer Vacuum, Germany) coupled with a quartz crystal for in situ thickness monitoring.
The solar cell characteristics were studied using a PET 100AA solar simulator with an output light intensity of 100 mW cm−2. The current–voltage characteristics were recorded using a Keithley 2420 source meter. The electrochemical impedance parameters were investigated using a potentiostat system (Autolab PGSTAT 302N). The impedance spectra were recorded over a frequency range of 1 MHz to 0.1 Hz with an AC amplitude of 10 mV under white light irradiation and dark conditions.
2.2. Synthesis of CdTe QDs
First, a NaHTe solution was prepared by adding 1 g of tellurium powder to 4 g of NaBH4 in a 100 mL sealed vessel. N2 gas was purged before adding 100 mL of distilled water to the reaction vessel. The contents were then left to react in a continuous N2 gas flow environment until the color of the solution turned purple. This solution (solution ‘A’) was stored (at 4 °C) for further use. In a separate three-necked vessel, 1 g each of cysteamine (HSCH2CH2NH2) and CdCl2·5H2O were dissolved in 100 mL of water. The pH was adjusted to 11.5 and N2 gas was purged for 30 min. 100 mL of solution ‘A’ was then added through a syringe with continuous stirring. This reaction mixture was refluxed at 100 °C for 30 min to synthesize the desired QDs. The dissolved CdTe QDs were precipitated with a small volume of 2-propanol, followed by their recovery through centrifugation (10![[thin space (1/6-em)]](https://www.rsc.org/images/entities/char_2009.gif) 000 rpm).
000 rpm).
2.3. Synthesis of NTU-9
The ligand ‘H4DOBDC’ (0.15 g, 0.75 mM) was mixed with 3 mL of concentrated acetic acid in a Teflon-lined stainless-steel bottle, and 0.67 mM (0.2 mL) of the metal precursor, ‘Ti(i-OPr)4’ was then added to this ligand solution. The reaction mixture was stirred to form a dark red slurry. This mixture was then heated in an oven at 120 °C for 5 days. After completion of the reaction, the mixture was allowed to cool to room temperature and washed five times with ethanol to obtain dark brown crystals of NTU-9.2.4. Synthesis of CdTe/NTU-9
The synthesis procedure for CdTe/NTU-9 was similar to that described in Section 2.3. As the source of the CdTe QDs, 400 μL of the prepared QD sample (Section 2.2.) was pre-mixed with the ligand solution. This QD-ligand solution was then mixed with the metal precursor. To study the dosage effect, varying volumes (100, 200, 300, 400, and 500 μL; concentration: 0.5 mg L−1) of the QDs were used to prepare the CdTe/NTU-9 composite with various QD/MOF compositions. The formation of the CdTe/NTU-9 nanocomposite took place through in situ encapsulation of the QDs into the NTU-9 matrix during the growth of the framework structure.2.5. Photodegradation studies
Photodegradation studies were carried out at neutral pH conditions. A fixed concentration (5 mg L−1) of the photocatalyst CdTe/NTU-9 was mixed with various initial concentrations of rhodamine 6G dye. Similar experiments were also conducted with reference photocatalysts (P-25 TiO2, CdTe QDs, and NTU-9) for the purpose of performance comparison. A high-power xenon light (HPX-2000, Mikropack) was used as the light source. The distance between the light source and the quartz cuvette containing the dye solution loaded with the photocatalyst was fixed at 10 cm. The photodegradation of the dye was monitored by spectrophotometrically determining its concentration after each experiment. Unless specified, all of the photodegradation experiments were performed at neutral pH conditions (6.5 ± 0.5). The pH value was selected in order to evaluate the photodegradation of the dye under normally encountered environmental conditions.2.6. DSSC (dye sensitized solar cell) fabrication
Fluorine-doped tin oxide (FTO) slides were first washed with deionized water, ethanol, and acetone. The slides were dried in an oven for 15 min at 380 °C before a second round of careful washing, followed by drying with clean hot air. A coating of TiO2 (6–7 μm thickness) on the cleaned FTO slides was processed using an electron beam gun evaporation technique. The TiO2-coated FTO slides were modified with CdTe QDs or CdTe/NTU-9 using the Doctor blade method. Finally, the obtained photoanodes were dried at 80 °C for approximately 30 min and stored under vacuum. A Pt counter electrode (thickness of ∼3 μm) prepared through a thermal evaporation technique was then attached to the photocatalyst-modified FTO substrate. A surlyn spacer was used to maintain the gap between the two electrodes. An electrolyte solution containing I−/I3− redox couple in methoxypropionitrile was introduced into the fabricated cell through a pre-drilled hole. The solar power conversion efficiency of the above designed cell was evaluated in both light and dark conditions under AM 1.5 G irradiation (100 mW cm−2). The schematic of the DSSC fabrication is presented in Fig. S1.†3. Results and discussion
3.1. Absorption studies
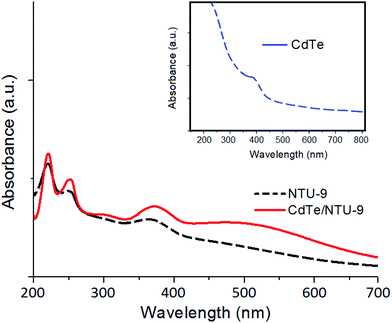
The UV-Vis spectra of CdTe QDs, NTU-9, and CdTe/NTU-9 are presented in Fig. 1. As reported previously, the absorption of light by NTU-9 includes a broader portion of the solar spectrum than most other categories of MOFs, and covers a significant range of UV-Vis light.65,66 This feature of NTU-9 makes it preferable for use in designing efficient QD/MOF composites for photocatalytic and photovoltaic applications. The absorption profile of the CdTe QDs also shows a broad range of UV-Vis light absorptivity .67,68 The CdTe/NTU-9 nanocomposite offers synergistic improvements in overall light harvesting capability, as evidenced by its higher degree of energy absorption.The direct energy bandgap (Eg) values of the CdTe QDs, NTU-9, and CdTe/NTU-9 (calculated using Tauc's method) are estimated to be 2.40, 1.85, and 2.21 eV, respectively. The above studies highlight some vital features of the CdTe/NTU-9 nanocomposite, such as a relatively low band gap, high surface area, and broadened light absorption profile, and thus confirm its potential in photocatalysis and photovoltaic applications.
3.2. BET surface area, TEM, XRD, and AFM based investigations
The results from the BET surface area analysis of the CdTe QDs, NTU-9, and CdTe/NTU-9, determined via nitrogen isotherm analysis, are 214, 1205, and 880 m2 g−1, respectively (Table S1†). NTU-9 has a larger surface area compared to the other materials due to its more porous nature. The reduction in the surface area of CdTe/NTU-9 can be linked to surface modification of the NTU-9 during the composite formation; however, the surface area value is still large enough to maintain a high potency of the CdTe/NTU-9 nanocomposite for the envisioned photocatalysis or photovoltaics applications. The use of MOFs in the proposed composite ensures the availability of a large number of surface active sites (due to the larger surface area) and minimization of charge recombination losses (due to the involvement of channelized electron pathways). The pore volumes of the NTU-9 and CdTe/NTU-9 composites were found to be almost identical (0.58 and 0.53 cm3 g−1), suggesting that the CdTe QDs could not enter into the open cavities of NTU-9. As a highlighting feature, the surface area of the CdTe/NTU-9 composite was fairly large in comparison to the other photocatalytic nanomaterials, including high-surface-area TiO2 (∼460 m2 g−1).Results from HR-TEM investigations of the CdTe QDs, NTU-9, and CdTe/NTU-9 are shown in Fig. 2 and S2.† The individual CdTe QDs have an average size of approximately 5–10 nm. The NTU-9 appear in a planar sheet-like geometry with a sheet width of approximately 50–100 nm. During the formation of CdTe/NTU-9, the QDs were entrapped homogeneously into the MOF structure so that the resulting nanocomposite retained the characteristic geometry of the latter molecule. HR-TEM and SAED images of the selected area of the CdTe/NTU-9 sample were highlighted with the presence of lattice fringes and diffraction rings that matched the standard CdTe phase, as reported in the literature.69–72 The results of HR-TEM analysis (Fig. S2†) also indicated the porous nature of both the MOF and its composite. As the electron beam invariably causes limited amount of degradation to the MOF crystals during the analysis, the interpretation about their porosity through TEM investigations must be complemented with other techniques such as BET that provides a much clearer information on this property.
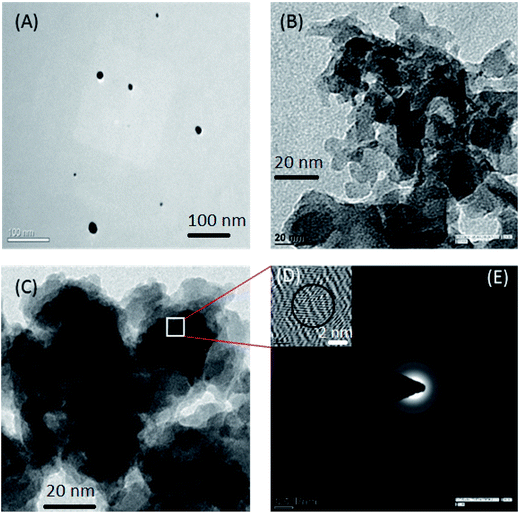 | ||
| Fig. 2 (A) TEM image of CdTe QDs, (B) TEM image of NTU-9, (C) TEM image of the CdTe/NTU-9 composite, (D) HR-TEM of the CdTe/NTU-9 composite, and (E) SAED pattern of the CdTe/NTU-9 composite. | ||
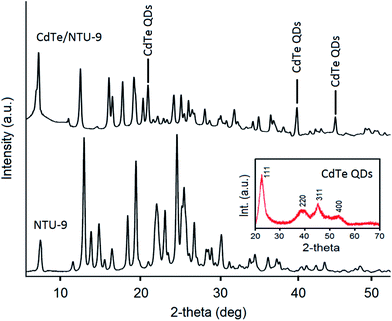
Powder X-ray diffraction (XRD) patterns of the CdTe QDs, NTU-9, and CdTe/NTU-9 are presented in Fig. 3. The XRD pattern of the CdTe QDs shows characteristic peaks corresponding to the (111), (220), (311), and (400) diffractions of their cubic zinc-blend structure.73 The XRD data for the NTU-9 is in agreement with previous reports.63 The XRD patterns of the nanocomposite exhibits peaks from both the CdTe QDs and NTU-9, thereby confirming the successful formation of the desired CdTe/NTU-9 structure. A confocal laser scanning spectroscopic image of the CdTe/NTU-9 is shown in Fig. S3.† As shown, the surface of the MOF was modified with fluorescent QDs as the latter components appear distinctly fluoresced upon excitation with a laser light of 488 nm.
3.3. Photodegradation of rhodamine 6G
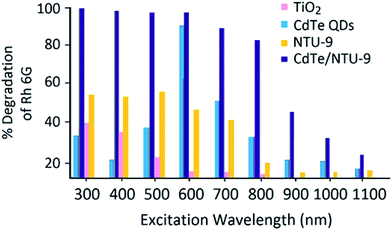
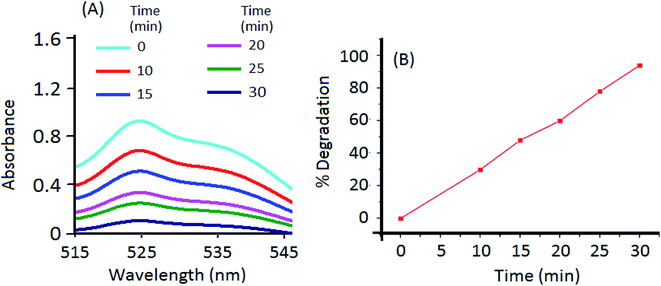
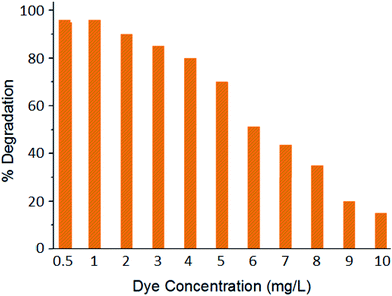
The UV-Vis absorption spectrum of Rh 6G shows an absorption maxima (λmax) at 530 nm (Fig. S4†). The calibration curve (absorbance vs. dye concentration) has been used to calculate the concentration of unknown samples in further studies. Fig. 4 presents the effect of various excitations wavelengths on the percentage photodegradation of Rh 6G (1 mg L−1). A reaction time of 30 min was selected in all of the above experiments and the concentration of the photocatalysts in the reaction slurry was maintained at 5 mg L−1. As the results highlight, the CdTe/NTU-9 nanocomposite is extremely efficient at causing quantitative degradation of the dye over a wide range of UV-Vis light irradiation. Under similar experimental conditions, the performances of reference (or pure form) materials including TiO2 (a popularly used commercial reagent), CdTe QDs, and NTU-9 were significantly reduced when compared to the CdTe/NTU-9 composite. The remarkably improved photocatalytic activity of the CdTe/NTU-9 can be attributed to synergistically improved energy harvesting properties and lower recombination losses. It may be highlighted here that the combination of CdTe QDs with NTU-9 resulted in improved photodegradation kinetics (almost a two-fold improvement with respect to reaction time) of Rh 6G over another QD/MOF (CdTe/Eu-MOF) hybrid material recently explored by our group.21Fig. 5 shows spectral changes in the absorbance of a 1 mg L−1 Rh 6G dye with respect to the photodegradation reaction time. The successful photodegradation of Rh 6G is evident in the gradually reducing absorbance values. The dye was almost completely (more than 95%) degraded in a sample irradiated for 30 min. The effect of the photocatalyst concentration on the photodegradation of the Rh 6G dye (Fig. 6) has revealed that 5 mg L−1 of the CdTe/NTU-9 photocatalyst can yield almost complete degradation of 0.5–4 mg L−1 of dye samples. The photodegradation of larger concentration (5, 7, 10 mg L−1) required a larger amount of the photocatalyst (50 mg L−1) without requiring any extension of the reaction time.
The effect of the pH of the medium on the photodegradation efficiency of CdTe/NTU-9 was also investigated. Lower pH conditions offered relatively enhanced photodegradation efficiencies (Fig. S5†) due to the preferable formation of perhydroxyl radical ions (protonated form of superoxide radical anions). Under these conditions, the formation of hydrogen peroxide gives rise to hydroxyl radicals that favor the photodegradation kinetics. At neutral and basic pH conditions, the photodegradation reaction is primarily governed by the formation of superoxide radical anions. Since there are fewer chances for the formation of both hydroxyl and superoxide radicals at pH 5, we observed a decrease in the photodegradation efficiency. The results of the above study suggest that the CdTe/NTU-9 photocatalyst can be used effectively under varying pH conditions.
The success of the photodegradation of Rh 6G with the CdTe/NTU-9 photocatalyst was further verified via FTIR and NMR spectroscopy. After a complete reaction, the photocatalyst was separated from the supernatant through centrifugation. The FTIR spectra of an initial Rh 6G and a completely degraded sample are shown in Fig. S6.† The characteristic bands of the benzene ring at 1589, 1469, and 923 cm−1 and those of the C–N bond, –CH3, and CCH (of phenyl rings) at 1180, 1344, and 1274 cm−1 in the initial sample completely disappeared in the degraded sample. This clear observation again verifies the success of the proposed process.
In Fig. S7,† the NMR spectra depict the characterization of dye samples before and after the photodegradation. In initial dye sample, the NMR signals from different protons at δ 6.1–8.2 ppm should be assigned to aromatic hydrogen atoms, whereas the NMR peaks at δ 1.0–1.1 ppm and δ 3.7–3.8 ppm appeared due to the hydrogen atoms in the ethyl group of the Rh 6G structure. After the photodegradation of the dye, most of the above NMR peaks disappeared due to breakdown of chromophore structures and removal of the ethyl groups.
The regeneration of the photocatalyst (CdTe/NTU-9) used after each successive degradation cycle is demonstrated in Fig. S8.† The photocatalyst sample was recovered from the reaction mixture after each degradation step through centrifugation at 10![[thin space (1/6-em)]](https://www.rsc.org/images/entities/char_2009.gif) 000 rpm. The sample was washed with water, dried at 60 °C for 12 h, and reused. As per our observations, the CdTe/NTU-9 photocatalyst could be effectively reused at least 5 times. The usefulness of the CdTe/NTU-9 photocatalyst for the degradation of Rh 6G under normal direct sunlight conditions has also been investigated. We obtained near complete degradation of a 1 mg L−1 dye sample within 40 min, which is a practical indication of the viability of the proposed CdTe/NTU-9 photocatalyst.
000 rpm. The sample was washed with water, dried at 60 °C for 12 h, and reused. As per our observations, the CdTe/NTU-9 photocatalyst could be effectively reused at least 5 times. The usefulness of the CdTe/NTU-9 photocatalyst for the degradation of Rh 6G under normal direct sunlight conditions has also been investigated. We obtained near complete degradation of a 1 mg L−1 dye sample within 40 min, which is a practical indication of the viability of the proposed CdTe/NTU-9 photocatalyst.
To learn more about the photodegradation capacity of this composite, we investigated the optimum ratio of the CdTe QDs![[thin space (1/6-em)]](https://www.rsc.org/images/entities/char_2009.gif) :
:![[thin space (1/6-em)]](https://www.rsc.org/images/entities/char_2009.gif) NTU-9 (w/w) for the photodegradation kinetics (Fig. S9†). A step-wise addition of the QD quantities resulted in faster photodegradation kinetics. Under the present experimental conditions, the addition of 500 μL of CdTe QDs (0.5 mg L−1) was sufficient to attain a maximum photodegradation efficiency for the CdTe/NTU-9 photocatalyst.
NTU-9 (w/w) for the photodegradation kinetics (Fig. S9†). A step-wise addition of the QD quantities resulted in faster photodegradation kinetics. Under the present experimental conditions, the addition of 500 μL of CdTe QDs (0.5 mg L−1) was sufficient to attain a maximum photodegradation efficiency for the CdTe/NTU-9 photocatalyst.
The photodegradation efficiency of the CdTe/NTU-9 nanocomposite was also compared with CdTe QDs or NTU-9 alone under similar experimental conditions (Fig. S10†). Evidently, the use of CdTe/NTU-9 offered faster degradation kinetics than individual components. The main possible processes governing the photocatalytic reaction can be expressed as follows:
| CdTe/NTU-9 + hν → CdTe/NTU-9 + (e−CB) + (h+VB) | (1) |
| (e−CB) + O2 → O2− | (2) |
Light irradiation of CdTe/NTU-9 can lead to the generation of electrons (e−CB) and holes (h+VB) (eqn (1)). As a porous material, NTU-9 can effectively absorb the dissolved O2. The photogenerated electrons are transferred to the conduction band of the MOF and are trapped by the adsorbed O2, which behaves as an electron acceptor (eqn (2)). Both the conduction and valance bands of the CdTe QDs lie above those of the NTU-9 MOF, which accounts for the thermodynamic preference of the aforementioned process. The porous nature of the composite causes prolonged lifetime in the excited electrons (e−) and enhances the quantum efficiency. The generation of holes is also accompanied by the production of superoxide radical anions. All of the above factors contribute to the photocatalytic degradation of the dye. Table S2† summarizes the performance of earlier reported hybrid materials (including the MOFs) and the present CdTe/NTU-9 system. This information is a fair indicator about the efficient photocatalytic performance of the QD/MOF hybrid material.
3.4. Current–voltage characteristics of the CdTe/NTU-9-based DSSC and impedance studies
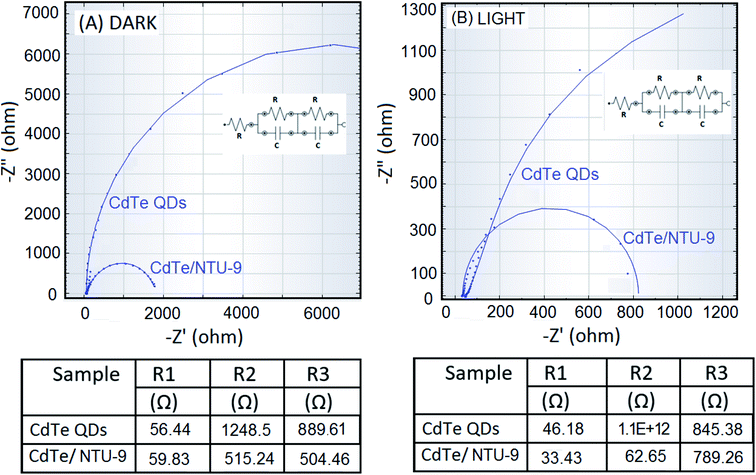
The CdTe and CdTe/NTU-9 photoanodes were first investigated for their charge transfer characteristics using cyclic voltammetry (CV). An I3−/I− solution was used as the electrolyte in the CV studies. This redox electrolyte was prepared by mixing 0.05 M solutions of iodine and lithium iodide in methoxypropionitrile. The solution was prepared in inert atmosphere to avoid oxidation with air and kept in an air tight bottle for further use.The same standard electrolyte was also used in the construction of DSSCs. The results of CV investigations indicate that the integration of CdTe QDs with NTU-9 has improved the charge transfer characteristics of the nanocomposite photoanode (Fig. 7). Furthermore, impedance levels were measured via sensitization at open-circuit conditions under both dark and illuminated (AM 1.5 G) environments. The Nyquist plots show the real and imaginary impedance values over a frequency range of 0.1 Hz to 1 MHz. The layout of the equivalent circuit model used to fit the data is also shown in Fig. 8. The values of the equivalent series resistance (R1), resistance across the counter electrode/electrolyte (R2), and transfer resistance across anode/electrolyte (R3) were computed from the equivalent circuit model (Fig. 8). Accordingly, the results clearly highlight a less resistive charge transfer mechanism with the use of the CdTe/NTU-9 composite. The effect is more pronounced under illumination conditions, which is an indication of the improved photovoltaic activities of the CdTe/NTU-9 composite.
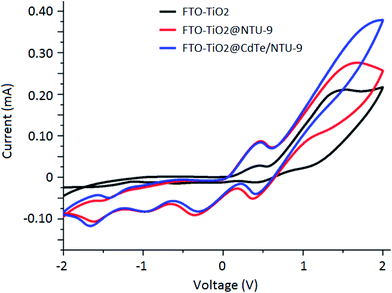 | ||
| Fig. 7 Cyclic voltammograms for the three types of electrodes in an I3−/I− electrolyte solution: (1) unmodified, (2) NTU-9 modified, and (3) CdTe/NTU-9 modified. | ||
3.5. DSSC parameters for the QD/MOF
The J–V characteristics of the CdTe QDs alone and CdTe/NTU-9 DSSCs (active area of 0.5 cm × 0.5 cm) under dark and illumination (standard AM 1.5 G) conditions are presented in Fig. 9. The J–V curves under dark conditions for the developed DSSCs depict a diode-like pattern. CdTe/NTU-9 DSSC has a smaller Jo value (reverse saturation current) than the CdTe DSSC, which implies an improved diode characteristic. The J–V curves for the illuminated conditions have been used to estimate the short circuit current densities (Jsc) with values of 19.8 and 23.2 mA cm−2 for the CdTe and CdTe/NTU-9 DSSCs, respectively (Table 1). This improvement in the Jsc characteristics of the CdTe/NTU-9 solar cell can be attributed to a lowering of the charge recombination losses due to the porous structure of the NTU-9 component. The values of the open circuit voltage (Voc) were observed as 340 and 486 mV for CdTe and CdTe/NTU-9 DSSCs, respectively. The CdTe/NTU-9 DSSC also yielded an improved photo-conversion efficiency (% PCE) from approximately 1.67 (in the case of the CdTe QDs alone) to 3.20 (in the case of CdTe/NTU-9) (Table 1). The better efficiency of the CdTe/NTU-9 DSSC can be attributed to a broader absorption capacity and improved management of the charge carriers.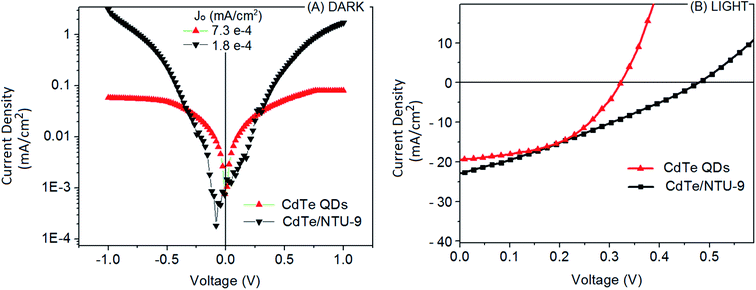 | ||
| Fig. 9 J–V characteristics of the CdTe and CdTe/NTU-9 DSSCs obtained (A) under dark conditions and (B) under illuminated conditions. | ||
| Samples | Jsc (mA cm−2) | Voc (mV) | FF (%) | Efficiency (%) |
|---|---|---|---|---|
| CdTe QDs | 19.80 | 340 | 24.9 | 1.67 |
| CdTe/NTU-9 | 23.19 | 486 | 28.5 | 3.20 |
4. Conclusions
The present work proposes the synthesis of a novel nanocomposite, CdTe/NTU-9, which is then found to be useful for the improved harvesting of photons over a wide UV-Vis range. The formation of the CdTe/NTU-9 composite is successfully characterized with a variety of imaging and spectral techniques. The large surface area and porous properties of this nanocomposite have been exploited for highly effective and rapid photodegradation of an environmentally polluting dye, rhodamine 6G. The CdTe/NTU-9 composite has effectively functioned as a visible-light-driven photocatalyst and yielded better photodegradation kinetics than the conventional P-25 TiO2. The easy regeneration and recovery of this composite following significant cycle testing should also be highlighted. The CdTe/NTU-9 can thus be used over a wide pH range with excellent degradation efficiencies.The CdTe/NTU-9 photocatalyst is also characterized with excellent photovoltaic features. Its thin film has shown potential as an improved photoanode for the assembly of a quantum dot-sensitized solar cell. In comparison to the simple QD-DSSC, the use of the CdTe/NTU-9 photoanode has offered better power conversion efficiency and short circuit current density. In recent years, the efficiency of quantum dot-sensitized solar cells has reached values as high as 9%. This has been realized with the use of doped/alloyed QDs, coating of the sensitized electrode with a combination of blocking layers, and selection of new efficient electrolytes. Our studies show that the use of a novel nanocomposite, CdTe/NTU-9, in the construction of the photoanode material can effectively boost the power conversion efficiency in the development of next-generation QD-DSSCs. The present results demonstrate that approximately 1.5% (absolute) of the cell's efficiency can be improved when CdTe QDs are used in conjunction with NTU-9 MOF.
Acknowledgements
One of the authors (Rajnish Kaur) acknowledges the Department of Science and Technology (DST), India for her research fellowship. The funding from CSIR India (Project: OMEGA/PSC0202) is gratefully acknowledged. We would like to thank Dr Amit L. Sharma, Senior Scientist (CSIR-CSIO, Chandigarh) for his help during the experimental work. We are also grateful to the Director, CSIR-CSIO, and Chandigarh, India. KHK also acknowledges the support of “Cooperative Research Program for Agriculture Science and Technology Development (Project No. PJ012521032017)” Rural Development Administration, Republic of Korea and the National Research Foundation of Korea (NRF) funded by the Ministry of Science, ICT & Future Planning (No. 2016R1E1A1A01940995).References
- R. Wang, F. Wang, S. An, J. Song and Y. Zhang, J. Rare Earths, 2015, 33, 154–159 CrossRef CAS.
- R. Saleh and N. F. Djaja, Superlattices Microstruct., 2014, 74, 217–233 CrossRef CAS.
- Q. Xiang, J. Yu and M. Jaroniec, Chem. Soc. Rev., 2012, 41, 782–796 RSC.
- J. Li and N. Wu, Catal. Sci. Technol., 2015, 5, 1360–1384 CAS.
- M. Halim, Nanomaterials, 2013, 3, 22 CrossRef CAS PubMed.
- M.-L. Tsai, S.-H. Su, J.-K. Chang, D.-S. Tsai, C.-H. Chen, C.-I. Wu, L.-J. Li, L.-J. Chen and J.-H. He, ACS Nano, 2014, 8, 8317–8322 CrossRef CAS PubMed.
- L. J. Brennan, M. T. Byrne, M. Bari and Y. K. Gun'ko, Adv. Energy Mater., 2011, 1, 472–485 CrossRef CAS.
- X. Yan, X. Cui, B. Li and L.-s. Li, Nano Lett., 2010, 10, 1869–1873 CrossRef CAS PubMed.
- K. S. Leschkies, R. Divakar, J. Basu, E. Enache-Pommer, J. E. Boercker, C. B. Carter, U. R. Kortshagen, D. J. Norris and E. S. Aydil, Nano Lett., 2007, 7, 1793–1798 CrossRef CAS PubMed.
- H. Yu, Y. Zhao, C. Zhou, L. Shang, Y. Peng, Y. Cao, L.-Z. Wu, C.-H. Tung and T. Zhang, J. Mater. Chem. A, 2014, 2, 3344–3351 CAS.
- I. Hod, V. González-Pedro, Z. Tachan, F. Fabregat-Santiago, I. Mora-Seró, J. Bisquert and A. Zaban, J. Phys. Chem. Lett., 2011, 2, 3032–3035 CrossRef CAS.
- D. Bera, L. Qian, T.-K. Tseng and P. H. Holloway, Materials, 2010, 3, 2260 CrossRef CAS.
- Y. Wang and N. Herron, J. Phys. Chem., 1991, 95, 525–532 CrossRef CAS.
- U. Resch-Genger, M. Grabolle, S. Cavaliere-Jaricot, R. Nitschke and T. Nann, Nat. Methods, 2008, 5, 763–775 CrossRef CAS PubMed.
- N. Shuji, S. Masayuki, N. Shin-ichi, I. Naruhito, Y. Takao, M. Toshio, S. Yasunobu and K. Hiroyuki, Jpn. J. Appl. Phys., 1997, 36, L1059 Search PubMed.
- K. A. S. Fernando, S. Sahu, Y. Liu, W. K. Lewis, E. A. Guliants, A. Jafariyan, P. Wang, C. E. Bunker and Y.-P. Sun, ACS Appl. Mater. Interfaces, 2015, 7, 8363–8376 CAS.
- C. Ratanatawanate, Y. Tao and K. J. Balkus, J. Phys. Chem. C, 2009, 113, 10755–10760 CAS.
- C.-H. M. Chuang, P. R. Brown, V. Bulović and M. G. Bawendi, Nat. Mater., 2014, 13, 796–801 CrossRef CAS PubMed.
- G. H. Carey, A. L. Abdelhady, Z. Ning, S. M. Thon, O. M. Bakr and E. H. Sargent, Chem. Rev., 2015, 115, 12732–12763 CrossRef CAS PubMed.
- D. Li, S. Wang, J. Wang, X. Zhang and S. Liu, Mater. Res. Bull., 2013, 48, 4283–4286 CrossRef CAS.
- R. Kaur, K. Vellingiri, K.-H. Kim, A. K. Paul and A. Deep, Chemosphere, 2016, 154, 620–627 CrossRef CAS PubMed.
- B. B. Jin, Y. F. Wang, X. Q. Wang and J. H. Zeng, Appl. Surf. Sci., 2016, 436, 369 Search PubMed.
- Z. Ge, L. Xu, R. Zhang, Z. Xue, H. Wang, J. Xu, Y. Yu, W. Su, Z. Ma and K. Chen, Appl. Surf. Sci., 2015, 15, 334 Search PubMed.
- B. Ma, L. Wang, H. Dong, R. Gao, Y. Geng, Y. Zhu and Y. Qiu, Phys. Chem. Chem. Phys., 2011, 13, 2656–2658 RSC.
- J.-W. Lee, D.-Y. Son, T. K. Ahn, H.-W. Shin, I. Y. Kim, S.-J. Hwang, M. J. Ko, S. Sul, H. Han and N.-G. Park, Sci. Rep., 2013, 3, 1050 CrossRef PubMed.
- M. C. Beard, K. P. Knutsen, P. Yu, J. M. Luther, Q. Song, W. K. Metzger, R. J. Ellingson and A. J. Nozik, Nano Lett., 2007, 7, 2506–2512 CrossRef CAS PubMed.
- J. E. Murphy, M. C. Beard, A. G. Norman, S. P. Ahrenkiel, J. C. Johnson, P. Yu, O. I. Mićić, R. J. Ellingson and A. J. Nozik, J. Am. Chem. Soc., 2006, 128, 3241–3247 CrossRef CAS PubMed.
- X.-F. Gao, W.-T. Sun, G. Ai and L.-M. Peng, Appl. Phys. Lett., 2010, 96, 153104 CrossRef.
- X.-F. Gao, H.-B. Li, W.-T. Sun, Q. Chen, F.-Q. Tang and L.-M. Peng, J. Phys. Chem. C, 2009, 113, 7531–7535 CAS.
- W. W. Yu, L. Qu, W. Guo and X. Peng, Chem. Mater., 2003, 15, 2854–2860 CrossRef CAS.
- S. V. Kershaw, S. Kalytchuk, O. Zhovtiuk, Q. Shen, T. Oshima, W. Yindeesuk, T. Toyoda and A. L. Rogach, Phys. Chem. Chem. Phys., 2014, 16, 25710–25722 RSC.
- http://energyinformative.org/best-thin-film-solar-panels-amorphous-cadmium-telluride-cigs.
- M. A. Green, Sol. Energy, 2003, 74, 181–192 CrossRef CAS.
- https://cleantechnica.com/2016/02/23/first-solar-achieves-new-conversion-efficiency-world-record-cdte-solar-pv-cells.
- X. Peng, M. C. Schlamp, A. V. Kadavanich and A. P. Alivisatos, J. Am. Chem. Soc., 1997, 119, 7019–7029 CrossRef CAS.
- D. V. Talapin, I. Mekis, S. Götzinger, A. Kornowski, O. Benson and H. Weller, J. Phys. Chem. B, 2004, 108, 18826–18831 CrossRef CAS.
- J. Luo, H. Wei, Q. Huang, X. Hu, H. Zhao, R. Yu, D. Li, Y. Luo and Q. Meng, Chem. Commun., 2013, 49, 3881–3883 RSC.
- G. Lu, S. Li, Z. Guo, O. K. Farha, B. G. Hauser, X. Qi, Y. Wang, X. Wang, S. Han, X. Liu, J. S. DuChene, H. Zhang, Q. Zhang, X. Chen, J. Ma, S. C. J. Loo, W. D. Wei, Y. Yang, J. T. Hupp and F. Huo, Nat. Chem., 2012, 4, 310–316 CrossRef CAS PubMed.
- R. Kaur, A. K. Paul and A. Deep, Forensic Sci. Int., 2014, 242, 88–93 CrossRef CAS PubMed.
- X. Lin, G. Gao, L. Zheng, Y. Chi and G. Chen, Anal. Chem., 2014, 86, 1223–1228 CrossRef CAS PubMed.
- T. Wakaoka, K. Hirai, K. Murayama, Y. Takano, H. Takagi, S. Furukawa and S. Kitagawa, J. Mater. Chem. C, 2014, 2, 7173–7175 RSC.
- Y. Li, A. Pang, C. Wang and M. Wei, J. Mater. Chem., 2011, 21, 17259–17264 RSC.
- D. Y. Lee, C. Y. Shin, S. J. Yoon, H. Y. Lee, W. Lee, N. K. Shrestha, J. K. Lee and S.-H. Han, Sci. Rep., 2014, 4, 3930 CrossRef PubMed.
- Y. Li, C. Chen, X. Sun, J. Dou and M. Wei, ChemSusChem, 2014, 7, 2469–2472 CrossRef CAS PubMed.
- W. A. Maza, A. J. Haring, S. R. Ahrenholtz, C. C. Epley, S. Y. Lin and A. J. Morris, Chem. Sci., 2016, 7, 719–727 RSC.
- P. Wu, C. He, J. Wang, X. Peng, X. Li, Y. An and C. Duan, J. Am. Chem. Soc., 2012, 134, 14991–14999 CrossRef CAS PubMed.
- S. Wang and X. Wang, Small, 2015, 11, 3097–3112 CrossRef CAS PubMed.
- K. G. M. Laurier, F. Vermoortele, R. Ameloot, D. E. De Vos, J. Hofkens and M. B. J. Roeffaers, J. Am. Chem. Soc., 2013, 135, 14488–14491 CrossRef CAS PubMed.
- C. Wang, D. Liu and W. Lin, J. Am. Chem. Soc., 2013, 135, 13222–13234 CrossRef CAS PubMed.
- J.-L. Wang, C. Wang and W. Lin, ACS Catal., 2012, 2, 2630–2640 CrossRef CAS.
- W.-w. Zhan, Q. Kuang, J.-z. Zhou, X.-j. Kong, Z.-x. Xie and L.-s. Zheng, J. Am. Chem. Soc., 2013, 135, 1926–1933 CrossRef CAS PubMed.
- D. Esken, S. Turner, C. Wiktor, S. B. Kalidindi, G. Van Tendeloo and R. A. Fischer, J. Am. Chem. Soc., 2011, 133, 16370–16373 CrossRef CAS PubMed.
- D. Buso, J. Jasieniak, M. D. H. Lay, P. Schiavuta, P. Scopece, J. Laird, H. Amenitsch, A. J. Hill and P. Falcaro, Small, 2012, 8, 80–88 CrossRef CAS PubMed.
- J.-S. Li, Y.-J. Tang, S.-L. Li, S.-R. Zhang, Z.-H. Dai, L. Si and Y.-Q. Lan, CrystEngComm, 2015, 17, 1080–1085 RSC.
- F. Ke, L. Wang and J. Zhu, Nano Res., 2015, 8, 1834–1846 CrossRef CAS.
- S. Jin, H.-J. Son, O. K. Farha, G. P. Wiederrecht and J. T. Hupp, J. Am. Chem. Soc., 2013, 135, 955–958 CrossRef CAS PubMed.
- R. Kaur, K.-H. Kim, A. K. Paul and A. Deep, J. Mater. Chem. A, 2016, 4, 3991–4002 CAS.
- J. Aguilera-Sigalat and D. Bradshaw, Coord. Chem. Rev., 2016, 307, 267–291 CrossRef CAS.
- M. Dan-Hardi, C. Serre, T. Frot, L. Rozes, G. Maurin, C. Sanchez and G. Férey, J. Am. Chem. Soc., 2009, 131, 10857–10859 CrossRef CAS PubMed.
- Y. Li, A. Pang, C. Wang and M. Wei, J. Mater. Chem., 2011, 21, 17259–17264 RSC.
- H.-J. Son, S. Jin, S. Patwardhan, S. J. Wezenberg, N. C. Jeong, M. So, C. E. Wilmer, A. A. Sarjeant, G. C. Schatz, R. Q. Snurr, O. K. Farha, G. P. Wiederrecht and J. T. Hupp, J. Am. Chem. Soc., 2013, 135, 862–869 CrossRef CAS PubMed.
- C. Serre, J. A. Groves, P. Lightfoot, A. M. Z. Slawin, P. A. Wright, N. Stock, T. Bein, M. Haouas, F. Taulelle and G. Férey, Chem. Mater., 2006, 18, 1451–1457 CrossRef CAS.
- J. Gao, J. Miao, P.-Z. Li, W. Y. Teng, L. Yang, Y. Zhao, B. Liu and Q. Zhang, Chem. Commun., 2014, 50, 3786–3788 RSC.
- L. Zou, D. Feng, T.-F. Liu, Y.-P. Chen, S. Yuan, K. Wang, X. Wang, S. Fordham and H.-C. Zhou, Chem. Sci., 2016, 7, 1063–1069 RSC.
- T. Zhou, Y. Du, A. Borgna, J. Hong, Y. Wang, J. Han, W. Zhang and R. Xu, Energy Environ. Sci., 2013, 6, 3229–3234 CAS.
- C.-C. Wang, J.-R. Li, X.-L. Lv, Y.-Q. Zhang and G. Guo, Energy Environ. Sci., 2014, 7, 2831–2867 CAS.
- M. Kumar and S. Kumar, RSC Adv., 2015, 5, 1262–1267 RSC.
- W. Liang, S. Liu, Z. Liu, D. Li, L. Wang, C. Hao and Y. He, New J. Chem., 2015, 39, 4774–4782 RSC.
- R. Moradian, M. Elahi, A. Hadizadeh, M. Roshani, A. Taghizadeh and R. Sahraei, Int. Nano Lett., 2013, 3, 1–6 CrossRef.
- M. Kumar and S. Kumar, RSC Adv., 2015, 5, 1262–1267 RSC.
- D.-W. Kim, K. Cho, H. Kim, B. Park, M. Young Sung and S. Kim, Solid State Commun., 2006, 140, 215–218 CrossRef CAS.
- H.-C. Chen, C.-W. Lai, I. C. Wu, H.-R. Pan, I. W. P. Chen, Y.-K. Peng, C.-L. Liu, C.-h. Chen and P.-T. Chou, Adv. Mater., 2011, 23, 5451–5455 CrossRef CAS PubMed.
- M. M. El-Nahass, G. M. Youssef and S. Z. Noby, J. Alloys Compd., 2014, 604, 253–259 CrossRef CAS.
Footnote |
| † Electronic supplementary information (ESI) available. See DOI: 10.1039/c7ra04125j |
| This journal is © The Royal Society of Chemistry 2017 |

