 Open Access Article
Creative Commons Attribution 3.0 Unported Licence
Magnetic targeted nanoparticles based on β-cyclodextrin and chitosan for hydrophobic drug delivery and a study of their mechanism
Pengfei Chen,
Hang Song,
Shun Yao,
Xianyu Tu,
Miao Su and
Lu Zhou *
*
School of Chemical Engineering, Sichuan University, Chengdu 610065, China. E-mail: zhoulu@scu.edu.cn; Fax: +86-28-8540-5221; Tel: +86-28-8540-5221
First published on 2nd June 2017
Abstract
Magnetic targeted nanoparticles double coated with β-cyclodextrin (β-CD) and chitosan (CS) were formed using a layer-by-layer model and their potential for hydrophobic drug delivery was evaluated in the study reported here. The resulting nanoparticles (NPs) had an average size of 102 nm and were spherical in shape. The double polymer layers ensured the colloidal stability and biocompatibility of the nanocarriers. Ibuprofen was chosen as the model drug. The nanocarriers possessed good magnetic properties and exhibited a high loading capacity that depended on the hybrid effects of electrostatic interaction and inclusion provided by the CS layer and the β-CD layer, respectively, which was confirmed using zeta potential analysis and a molecular modeling study. The in vitro release results revealed that the two-step release process consisted of an initial fast release and then a slower sustained release. Based on the Korsmeyer–Peppas model, the release mechanism was attributed to a mixed effect of swelling and a diffusion controlled release, which could be affected by pH, temperature and magnetic field. It is anticipated that the CS–CD–silica coated magnetic nanoparticles (SMNPs) will be a promising candidate as a nanocarrier for hydrophobic drugs.
Introduction
Hydrophobic drugs are a general problem in pharmaceutical drug formulation.1 The typical problem associated with hydrophobic drugs is their low bioavailability after administration, which is because of the insufficient drug doses at the lesion site, and thus, this limits its applications. To solve this issue, many attempts have been made to deliver these hydrophobic agents to the target sites as much as possible. At present, the most popular way to improve the bioavailability of drugs is to deliver them using targeted carriers. In this respect, iron(II,III) oxide (Fe3O4) nanoparticles (NPs) exhibit high magnetization, are easy to prepare and have relatively good biocompatibility, and thus are considered to be a promising candidate in targeted drug therapy.2–4 However, because of dipolar attractions, naked Fe3O4 NPs tend to aggregate into clusters to reduce their surface energy and thus, show poor dispersion in aqueous media.5 In addition, because Fe3O4 magnetic nanoparticles (MNPs) contain easily oxidized Fe2+ ions, they are vulnerable to losing their magnetism when exposed to a biological system,6 which means they are not suitable as drug carriers. For the drug delivery applications, MNPs must be processed with substances that assure their stability, biocompatibility and non-toxicity in the physiological medium in order to achieve the combination of high magnetic response, and biocompatibility with interactive functionality on the surface.7 The surfaces of these particles could be decorated with some polymers by depositing a few atomic sized layers of biocompatible polymers, which not only leads to the creation of more hydrophilic nanostructures, but also provides a variety of surface functional groups to bind drug molecules, inhibit aggregation, and increase stability.8,9Banerjee and Chen10 reported the design of MNPs grafted with β-cyclodextrin (β-CD) for hydrophobic drug delivery. The results of ketoprofen inclusion and release experiments indicated that β-CD seemed to be a very promising candidate for the administration of poorly soluble drugs. Although β-CD has received tremendous attention because of its unique structural features with a hydrophilic outer surface and a sufficient internal hydrophobic cavity to host drug molecules,11 the limited application of β-CD is because of the absence of a mucoadhesion property. Chitosan (CS) is another type of multifunction natural polymer with a high content of active amino groups (–NH2) together with hydroxyl (–OH) groups on the chain backbone, which can interact with mucins and open the tight junctions between epithelial cells, which are favorable for drug transport.12,13 Thus, use of CS has been gaining increasing attention in the pharmaceutical field and the CS-based delivery systems have shown great potential to deliver types of drugs, such as doxorubicin, isoniazid and so on.14,15 Nevertheless, apart from the evident advantages of CS, one important disadvantage for its use as a drug carrier is its hydrophilicity, which often gives rise to its poor loading capacity for hydrophobic therapeutic agents or results in a faster drug release.16,17 Based on this, it was thought that by combining CS with β-CD, CS could improve the mucoadhesive property of β-CD while the hydrophobicity of β-CD could enhance the capacity of CS to load poorly soluble drugs and give them sustained release properties. Several studies have been directed towards constructing NPs with different structures based on CS and β-CD to form new drug carriers. Trapani et al.18 reported grafting of the water soluble β-CD to CS which was used to carry eugenol to the mucosae. A series of β-CD-grafted carboxymethyl CS hydrogels were prepared by Kono and Teshirogi19 for the controlled release of acetylsalicylic acid.
Considering the previously reported research, in the present work, a simple and mild layer-by-layer method was designed to obtain an effective targeted delivery for poorly soluble drugs. The resulting MNPs (CS–CD–silica MNPs, SMNPs) were characterized using different analytical methods and their biocompatibility was assessed using the 3-(4,5)-dimethylthiazol-2-yl-2,5-diphenyltetrazolium bromide (MTT) assay. The nanocarriers prepared by this method were expected to achieve the combination of properties of high magnetic saturation, and biocompatibility with interactive functionality on the surface. As an example of an extensively employed poorly soluble drug, ibuprofen (IBU), used in the treatment of rheumatic disorders, muscular pain and fever, was selected as the model drug to evaluate the loading and release properties of the synthesized CS–CD–SMNPs. Furthermore, the deep mechanism of the loading and release process was investigated using zeta potential analysis and molecular modeling. The as-prepared CS–CD–SMNPs were anticipated to be a promising candidate for a targeted nanocarrier for use with hydrophobic drugs.
Materials and methods
Materials
All the chemicals were either used as-received or further purified as indicated next. Chitosan (deacetylation degree ≥95%, molecular weight: 30![[thin space (1/6-em)]](https://www.rsc.org/images/entities/char_2009.gif) 000 Da), β-CD (98%), and γ-(2,3-epoxypropoxy)propyltrimethoxysilane (KH-560) (97%) were purchased from Aladdin (Shanghai, China). MTT and dimethylsulfoxide (DMSO) were purchased from the Sigma Chemical Co. (St. Louis, USA). All the other chemicals used in the study were obtained from Sichuan Chemical Company (Chengdu, China). Toluene was dried using calcium hydride for 24 h and then distilled after refluxing for 6 h. Distilled water with a specific conductivity of less than 1 mΩ cm−1 was used throughout the study. The cellulose ester dialysis bag with a diameter of 2.2 cm and molecular weight cut off 3500 was purchased from Aladdin (Shanghai, China). The external magnetic field in this study was generated by a magnet with an intensity of 0.5 T.
000 Da), β-CD (98%), and γ-(2,3-epoxypropoxy)propyltrimethoxysilane (KH-560) (97%) were purchased from Aladdin (Shanghai, China). MTT and dimethylsulfoxide (DMSO) were purchased from the Sigma Chemical Co. (St. Louis, USA). All the other chemicals used in the study were obtained from Sichuan Chemical Company (Chengdu, China). Toluene was dried using calcium hydride for 24 h and then distilled after refluxing for 6 h. Distilled water with a specific conductivity of less than 1 mΩ cm−1 was used throughout the study. The cellulose ester dialysis bag with a diameter of 2.2 cm and molecular weight cut off 3500 was purchased from Aladdin (Shanghai, China). The external magnetic field in this study was generated by a magnet with an intensity of 0.5 T.
Three types of cell lines (HEPG-2, MCF-7 and BEL-1) were purchased from the American Type Culture Collection (ATCC, Rockville, MD, USA). Cells were cultured in RPMI-1640 or Dulbecco's Modified Eagle's Medium media supplemented with 10% fetal bovine serum (FBS; Gibco, Auckland, NZ) and 0.1% antibiotic–antimycotic solution. Cells were maintained in a 37 °C incubator with a 5% humidified carbon dioxide atmosphere.
Preparation of silica coated Fe3O4 magnetic nanoparticles (SMNPs)
The Fe3O4 MNPs suspension was synthesized using the coprecipitation of Fe2+ and Fe3+ ions using ammonium hydroxide (NH4OH) as the precipitating agent according to a previously published report.20 Then, the resulting Fe3O4 MNP suspension was re-dispersed in a solution of ethanol and distilled water (v/v = 4/1) to form a 4 wt% magnetic fluid (MF). MF (2 g), NH4OH solution (5 mL) and tetraethyl orthosilicate (2 mL) were added successively to a round-bottomed flask. The mixture was stirred for 24 h and the products obtained were separated and washed several times with distilled water and ethanol. Finally, the particles were dried at 50 °C under vacuum to obtain the SMNPs.Preparation of β-cyclodextrin grafted SMNPs (CD–SMNPs)
SMNPs (0.5 g) were ultrasonically dispersed in 100 mL of dried toluene and stirred for 10 min, then 5 mL of KH-560 was added dropwise. The reaction mixture was stirred at 100 °C for 12 h under nitrogen (N2) protection. Afterwards, the solid phase was collected and washed several times with distilled water and ethanol. The resulting functionalized SMNPs with an epoxy group (SMNPs–KH560) were dried at 50 °C under vacuum.β-CD (0.5 g) was dispersed in a solution composed of 20 mL of dimethyl sulfoxide and 20 mL of isopropanol. Then 50 mL of an aqueous solution of 0.55 M of sodium hydroxide was added dropwise when the β-CD was completely dissolved. The mixture was stirred at 60 °C for 4 h in order to convert the –CH2OH on the β-CD into –CH2O−. The SMNPs–KH560 were then added to the previous solution and the reaction was continued for 6 h at 8 °C in a N2 atmosphere. The CD–SMNPs obtained were separated, washed and dried under vacuum.
Preparation of chitosan coated CD–SMNPs (CS–CD–SMNPs)
CS solution was prepared by dissolving 0.2 g of CS in 50 mL 5% (v/v) of acetic acid. Then 0.2 g of CD–SMNPs and 0.25 g of sodium dodecyl sulfonate were added successively and then ultrasonically dispersed for 30 min. Finally, 2 mL of 50% glutaraldehyde was added and the mixture was stirred for 5 h at room temperature. The CS–CD–SMNPs formed were then vacuum dried at 50 °C after thoroughly washing with water.Characterization
The magnetic properties of the samples were determined at 300 K using a PPMS-VSM-9T superconducting quantum interference device (SQUID) (Quantum Design, USA). The morphological properties of the MNPs were determined using a JSM-7001F scanning electron microscope (SEM; JEOL) and a JEM-2100 transmission electron microscope (TEM; JEOL). The size distribution was determined at 25 °C using dynamic light scattering at a scattering angle of 90° and with a Zetasizer Nano ZS90 (Malvern Instruments, UK). Fourier transform infrared (FT-IR) spectra were recorded using a Spectrum Two L1600300 spectrometer (PerkinElmer, USA) in the range of 4000–400 cm−1. X-ray powder diffraction (XRPD) patterns were recorded on a D8 X-ray diffractometer (Bruker, Germany) with a graphite monochromator and Cu Kα radiation (λ = 0.15418 nm) in the range of 10–80°. Thermal gravimetric analysis (TGA) experiments were conducted using a TG 209 F1 analyzer (Netzsch, Germany) with a heating rate of 10 °C min−1 under a N2 flow. The zeta potentials of the CD–SMNPs and the CS–CD–SMNPs were determined at different pH values using a Zetasizer (Malvern Instruments, UK).A LC-20AT high-performance liquid chromatograph (HPLC; Shimadzu, Japan) consisting of a SPD-M20A photodiode array detector and Class VP chromatography workstation were used for the quantitative analysis of IBU. A Welchrom-C18 column (150 mm × 3.9 mm, 5 mm) was used as the HPLC analytical column and the mobile phase consisted of acetate buffer and acetonitrile (v/v, 40![[thin space (1/6-em)]](https://www.rsc.org/images/entities/char_2009.gif) :
:![[thin space (1/6-em)]](https://www.rsc.org/images/entities/char_2009.gif) 60) with a flow rate of 1 mL min−1. The detector was set at 263 nm and the injected volume was 20 μL. The HPLC conditions were taken from the Chinese Pharmacopeia (2015 edition).
60) with a flow rate of 1 mL min−1. The detector was set at 263 nm and the injected volume was 20 μL. The HPLC conditions were taken from the Chinese Pharmacopeia (2015 edition).
Cytotoxicity assay
The cytotoxicity of CS–CD–SMNPs was studied using the MTT assay21 to investigate the biocompatibility of the drug delivery nanosystems. Briefly, the exponentially growing fibroblasts, 2–4 × 10³ cells in 100 μL of medium were seeded in 96-well plates for 24 h. Then, various concentrations of the CS–CD–SMNP suspension in 100 μL medium were added to each well and incubated for 72 h. MTT (20 μL; 5 mg mL−1) was added to each well and incubated for an additional 4 h. Finally, the medium was discarded and 150 μL of DMSO was added to each well and the solution was vigorously mixed to dissolve the reacted dye. The absorbance of each well was measured at a wavelength of 570 nm with a SpectraMax M5 microplate spectrophotometer (Molecular Devices, CA, USA) and the percentage of inhibition was calculated. The results were obtained from three parallel experiments.IBU loading and release
CS–CD–SMNPs (15 mg) were dispersed in 50 mL of IBU solution at the desired concentration and pH for absorption and all batches of loading experiments were performed in an air-bath shaker with a shaking speed of 150 rpm. The residual concentration of IBU was determined using HPLC with a standard calibration curve (y = 1100.8x + 58![[thin space (1/6-em)]](https://www.rsc.org/images/entities/char_2009.gif) 304, R2 = 0.9996, 10–80 mg L−1). The loading content (mg g−1) of IBU was obtained using eqn (1) and all the data were averaged from three parallel experiments:
304, R2 = 0.9996, 10–80 mg L−1). The loading content (mg g−1) of IBU was obtained using eqn (1) and all the data were averaged from three parallel experiments:| Loading content (mg/g) = m1/m2 | (1) |
The release of IBU for the in vitro experiment was performed as follows: 25 mg of IBU loaded CS–CD–SMNPs (IBU–CS–CD–SMNPs) were placed in a dialysis bag (7 cm × 2.2 cm) which was then immersed in 50 mL of phosphate buffer solution (PBS, pH 7.4/1.4)22,23 and kept at pre-set conditions in a thermostated gas bath. At fixed time intervals, 1 mL of release medium was taken out for analysis, and the same volume of fresh release medium with the same temperature was added. The concentration of the IBU released from the IBU–CS–CD–SMNPs was monitored using HPLC and the corrected concentration of the released IBU was calculated using eqn (2):
 | (2) |
Molecular modelling
The initial geometry of IBU was constructed using ChemBioDraw Ultra and fully optimized using density functional theory methodology with Gaussian 03 at the B3LYP/6-31G(d) level.24 The β-CD structure was extracted from the crystal structure of β-CD complexes from the Cambridge Structural Database (ref. code: BCDEX03), and all attached water molecules were removed. After which, docking was conducted using a Lamarckian genetic algorithm in the AutoDock 4.2 program package. The grid box was constructed and set to a 40 × 40 × 40 point cubic box with grid spacing of 0.375 Å centered on β-CD. The grid box was chosen to be significantly large to include not only the cavity portion but also covering the entire cyclodextrin surface. A total of 50 docking runs were carried out. A semi-empirical autodock free energy force field was used to estimate the interaction free energy and the conformer with the lowest binding energy of ligand was used for further analysis.Results and discussion
Characterization of the CS–CD–SMNPs
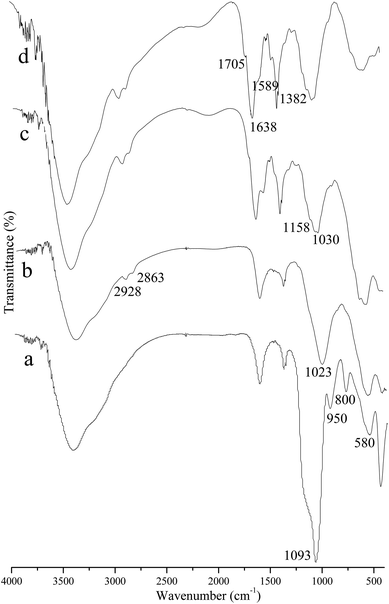
In order to validate the preparation results, FT-IR spectroscopy was employed to determine the new structure of the prepared products. As shown in Fig. 1, the peak at 580 cm−1 in all of the FT-IR spectra is produced by the characteristic vibration of the Fe–O bond,25 indicating the presence of Fe3O4. In order to provide the Fe3O4 NPs with a silica like surface that could react with the various coupling agents, SMNPs were prepared first. The IR spectrum of the SMNPs (Fig. 1a) shows the characteristic peaks of the Si–O–Si bond and Si–OH bond at 800, 1093 and 950 cm−1,9,26 which prove the formation of the silica matrix. After grafting with KH-560, it is worth noting that the absorption peaks at 1136 and 909 cm−1 related to epoxy ring27 from KH-560 were not observed in Fig. 1b because they were overlapped by the peaks of the silica matrix, which leads to a broad peak at 1023 cm−1. After further reaction with β-CD, two bands at 1030 and 1158 cm−1 were observed, and these were assigned to the asymmetric glycosidic (C–O–C) vibration and the coupled (C–C/C–O) stretch vibration11,27 (Fig. 1c). After crosslinking with glutaraldehyde, distinctive absorption peaks appeared at 1638 and 1705 cm−1 in the spectra of CS–CD–SMNPs (Fig. 1d), which indicates the formation of a Schiff's base (C![[double bond, length as m-dash]](https://www.rsc.org/images/entities/char_e001.gif) N) and carbonyl bands28,29 as a result of the reaction between the carbonyl groups of glutaraldehyde and the amine groups of the CS chain, respectively. Furthermore, the peak at 1589 cm−1 corresponds to the typical bending vibration band of the primary amino group.29 These observations confirmed that CS–CD–SMNPs were prepared successfully.
N) and carbonyl bands28,29 as a result of the reaction between the carbonyl groups of glutaraldehyde and the amine groups of the CS chain, respectively. Furthermore, the peak at 1589 cm−1 corresponds to the typical bending vibration band of the primary amino group.29 These observations confirmed that CS–CD–SMNPs were prepared successfully.
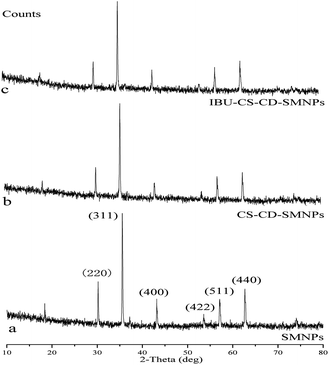
The XRPD patterns for SMNPs, CS–CD–SMNPs and IBU–CS–CD–SMNPs (IBU loading content 82.87 mg g−1) powders in the 2θ range of 10–80° are shown in Fig. 2. The six characteristic peaks of SMNPs occurring at 2θ = 30.1, 35.5, 43.1, 53.4, 57.0 and 62.6 and their indices are: (220), (311), (400), (422), (511), and (440), respectively, because of the presence of Fe3O4 according to the standard XRPD data cards of the Fe3O4 crystal15,30 (JCPDS no. 85-1436). For all the samples, the absence of the peaks (110) (2θ = 21.23) and (104) (2θ = 33.16) indicated that both goethite (α-FeOOH) and hematite (α-Fe2O3) did not form in the prepared samples. This revealed that the resultant NPs were pure Fe3O4 with a spinel structure and the conjugated and drug loaded process did not result in a phase of the Fe3O4 particles. It can be concluded that the surface modified Fe3O4 MNPs with these two polymers were helpful for avoiding its oxidization and to maintain its stability. It is worth noting that the intensity of the XRPD peaks obviously decreased when the SMNPs were coated with the polymers and this proved that successful surface modification had occurred.
The observations of the morphology of the SMNPs, CD–SMNPs and CS–CD–SMNPs were conducted using SEM (×20![[thin space (1/6-em)]](https://www.rsc.org/images/entities/char_2009.gif) 000). As shown in Fig. 3a, the synthesized SMNPs have a ball like morphology with an average diameter of nearly 20 nm. The CD–SMNPs shown in Fig. 3b exhibit a similar morphology to the SMNPs and present a mean diameter of approximate 56 nm. After crosslinking with CS, the CS–CD–SMNPs were observed to be stuck together because of the crosslinking process (Fig. 3c). According to the TEM results shown in Fig. 3d, the CS–CD–SMNPs have a good shape and are spherical or ellipsoidal with a core–shell structure. It can also be clearly seen that the CS–CD–SMNPs incorporate different amounts of CD–SMNPs, which leads to the different particle sizes of the CS–CD–SMNPs. But the particle size still shows a normal distribution. According to the statistical analysis, the mean diameter of the CS–CD–SMNPs microspheres was 102 nm. The larger size distributions also revealed that the CD–SMNPs had been successfully encapsulated into the CS nanocarriers.
000). As shown in Fig. 3a, the synthesized SMNPs have a ball like morphology with an average diameter of nearly 20 nm. The CD–SMNPs shown in Fig. 3b exhibit a similar morphology to the SMNPs and present a mean diameter of approximate 56 nm. After crosslinking with CS, the CS–CD–SMNPs were observed to be stuck together because of the crosslinking process (Fig. 3c). According to the TEM results shown in Fig. 3d, the CS–CD–SMNPs have a good shape and are spherical or ellipsoidal with a core–shell structure. It can also be clearly seen that the CS–CD–SMNPs incorporate different amounts of CD–SMNPs, which leads to the different particle sizes of the CS–CD–SMNPs. But the particle size still shows a normal distribution. According to the statistical analysis, the mean diameter of the CS–CD–SMNPs microspheres was 102 nm. The larger size distributions also revealed that the CD–SMNPs had been successfully encapsulated into the CS nanocarriers.
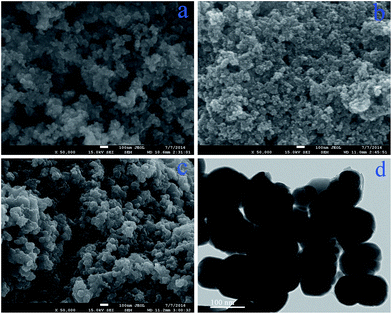 | ||
Fig. 3 SEM images (×20![[thin space (1/6-em)]](https://www.rsc.org/images/entities/char_2009.gif) 000) of SMNPs (a), CD–SMNPs (b), CS–CD–SMNPs (c) and the TEM image of CS–CD–SMNPs (d). 000) of SMNPs (a), CD–SMNPs (b), CS–CD–SMNPs (c) and the TEM image of CS–CD–SMNPs (d). | ||
Furthermore, the CS–CD–SMNPs obtained were non-porous (seen from the images of SEM and TEM) and this is advantageous, because they are more resistant to corrosion than porous microspheres,28 which contributes to them maintaining their stability.
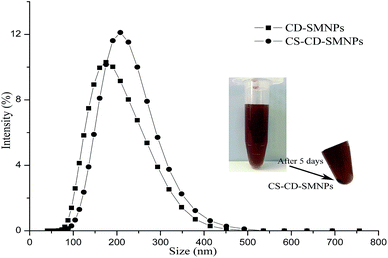
In order to determine the hydrodynamic diameters of CD–SMNPs and CS–CD–SMNPs, they were dispersed in water (pH 6.8) using an ultrasonic method to obtain 0.2 g L−1 content of each of the solids. To measure the particle size distribution of the dispersion, a polydispersity index (PI) was used from 0.0 (for an entirely monodispersed sample) to 1.0 (for a polydispersed sample). As can be observed in Fig. 4, a peak is observed in the size distribution and the average hydrodynamic size of CD–SMNP and CS–CD–SMNP microspheres is 172 nm and 236 nm with PI values of 0.45 and 0.29, respectively. The increasing trend of hydrodynamic size was consistent with the results of the SEM measurements. The larger hydrodynamic size of CD–SMNPs and CS–CD–SMNPs was because of the formation of a hydrate layer between organic substances on the microsphere surface.27,31 Furthermore, the CS–CD–SMNPs showed a better colloidal stability than CD–SMNPs as shown by their values in the PI. The pKa of CS was 6.2–7,14 indicating that the amino groups were deprotonated at biological pH conditions. This suggests that CS could provide particle stability by electrostatic repulsion6 and there was little sedimentation after five days at room temperature (see insert in Fig. 4). So, despite the larger particle size of CS–CD–SMNPs, they were more suitable drug carriers because of their higher colloidal stability.
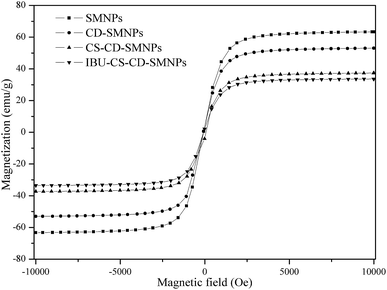
Fig. 5 shows that the magnetization curves of the prepared magnetic micro-particles at 300 K. All samples show no hysteresis loop in their magnetization curves, which indicates a superparamagnetic behavior.32 The saturation magnetization values for SMNPs, CD–SMNPs, CS–CD–SMNPs and IBU–CS–CD–SMNPs (IBU loading content 82.87 mg g−1) were 63.31, 53.05, 37.36 and 33.59 emu g−1, respectively. It was obvious that the saturation magnetization value decreased after modification, which could be attributed to the existence of the nonmagnetic organic substances on the surface of the SMNPs.30,33 But both CS–CD–SMNPs and IBU–CS–CD–SMNPs had comparable values of magnetization, which indicated that the CS–CD–SMNPs still maintained a strong magnetic response after drug loading. It is feasible that these magnetic nanocarriers could be applied in a targeted-drug delivery system because of their magnetic stability.
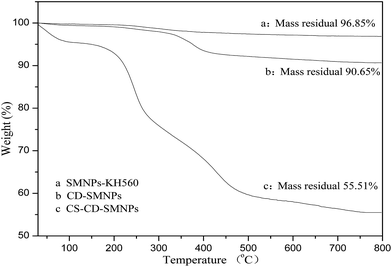
TGA was used to estimate the quantitative conjugation of β-CD and CS onto the surface of the SMNPs. As shown in Fig. 6, the TG curves are similar and show two steps of weight loss over the temperature range 30–800 °C. The first weight loss was because of the volatilization of residual organic solvents and the adsorbed water in the samples and the second weight loss was because of the progressive decomposition of the grafted polymers. According to the remaining weight percentages after TGA, the amount of β-CD and CS was 6.2% and 35.14%, respectively (the grafting percentage is defined as the weight percentage of the newly grafted component).
Stability studies
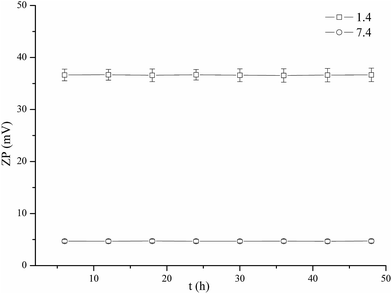
Because the final application of CS–CD–SMNPs is their use for drug delivery, it was important to determine their stability in different physiological conditions (pH 1.4/7.4 and 37 °C). Previous reports have shown that inconsistent zeta potential values with time can be a result of electrode degradation,34 and thus zeta potential measurement could be used to verify the stability of CS–CD–SMNPs in PBS (pH 1.4 and 7.4). The results in Fig. 7 show the relationship between the zeta potential of CS–CD–SMNP suspension (0.2 g L−1) and time. The results showed that the zeta potential of CS–CD–SMNP suspension under both pH conditions did not suffer a significant change following incubation for at least 48 h, which indicated the CS–CD–SMNPs prepared in this study exhibited good stability in both the acidic and neutral release medium. Furthermore, the CS–CD–SMNPs in the two types of PBS were recycled and its saturation magnetization value determined using vibrating sample magnetometry (VSM) was 37.39 emu g−1 (pH 7.4) and 37.32 emu g−1 (pH 1.4). The comparable saturation magnetization value further confirmed its stability.Cytotoxicity assay
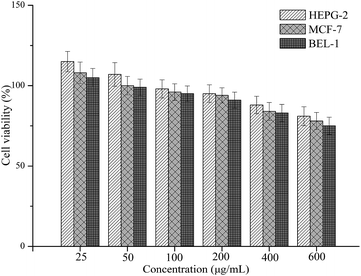
For use in drug delivery applications, MNPs must be preprocessed with substances that assure their non-toxicity in the physiological medium. Therefore, the biocompatibility or bioactivity of drug delivery nanosystems was determined using the MTT assay, which has been described as a suitable method for detection of biomaterial toxicity.35,36 Fig. 8 shows the cell cytotoxicity results of each sample in comparison to a control (using PBS as the blank control). It was found that the cytotoxicity of the CS–CD–SMNPs increased with increasing concentration. CS–CD–SMNPs revealed a low cytotoxic effect to all the tested cells and they remained more than 90% viable relative to the control at concentrations as high as 200 μg mL−1. According to a previous study,37 the naked iron oxide MNPs could cause a significant reduction (80% of control) in cell viability at 50 μg mL−1 because of the particle endocytosis response, which could be improved by coating the particles. As is already known, β-CD and CS are natural polymers with the advantages of non-toxicity and biodegradability, which have been approved by the FDA for use as drug excipients. Because of these two biocompatible polymer layers, the CS–CD–SMNPs possess good biocompatibility, which is favorable for their use in further biological applications.IBU loading and release behaviors
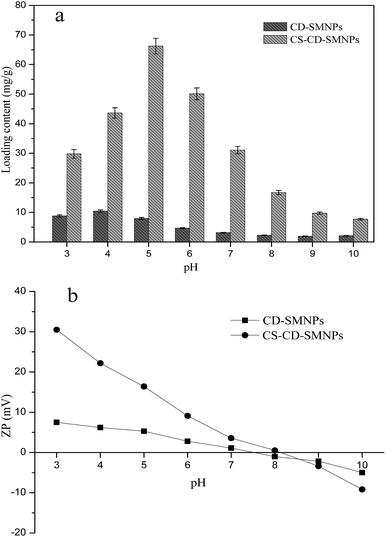
As is well known, IBU is a p-alkyl phenyl acetic acid with a pKa of 4.2–4.9.38 Part of IBU molecule is deprotonated to a carboxylate anion at pH 5. According to the results shown in Fig. 9b, the nanocarriers bear a positive charge at lower pH values because of the amine groups on the chitosan were protonated to form an NH3+ group. Thus, an electrostatic interaction occurred between the –NH3+ groups on the CS layer which caused the IBU to dissociate. But when the degree of deprotonation of IBU increased at a pH which was a little higher, the loading capacity decreased even though the nanocarriers still bear a positive charge. It may be speculated that the reason for this is that the ionization state of IBU lowers its affinity for β-CD.
To verify this hypothesis, the drug loading experiments of the CD–SMNPs were conducted at different pH values. It was found that the loading content decreased with increased pH values ranging from 5 to 7 whereas the CD–SMNPs still had a positive charge (Fig. 9b). Furthermore, molecular modeling, which is an important tool for clarifying the mechanism of binding, was used to confirm the binding forces between β-CD and the two types of IBU. Typically, the more negative the binding energy is, the stronger interaction between the host and guest molecules. Fig. 10 shows the conformation with the lowest binding energy of β-CD and the two types of IBU. The results indicated that both types of IBU could form IBU–CD complexes with 1![[thin space (1/6-em)]](https://www.rsc.org/images/entities/char_2009.gif) :
:![[thin space (1/6-em)]](https://www.rsc.org/images/entities/char_2009.gif) 1 stoichiometry and the main driving force for the complex formation was a hydrophobic interaction when the IBU was included into the β-CD cavity. However, according to lowest energy results, the free energy of binding for the complexes formed by un-ionized (Fig. 10a) and ionized IBU (Fig. 10b) with β-CD corresponds to −4.84 and −4.46 kcal mol−1, respectively, indicating that the un-ionized IBU has a stronger binding ability than ionized IBU, which is consistent with the speculation about the mechanism. So, a lower pH is beneficial for the inclusion in its molecular form.
1 stoichiometry and the main driving force for the complex formation was a hydrophobic interaction when the IBU was included into the β-CD cavity. However, according to lowest energy results, the free energy of binding for the complexes formed by un-ionized (Fig. 10a) and ionized IBU (Fig. 10b) with β-CD corresponds to −4.84 and −4.46 kcal mol−1, respectively, indicating that the un-ionized IBU has a stronger binding ability than ionized IBU, which is consistent with the speculation about the mechanism. So, a lower pH is beneficial for the inclusion in its molecular form.
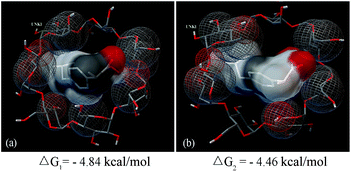 | ||
| Fig. 10 Lowest energy of different modes of IBU with β-CD inclusion complexes obtained after docking: un-ionized IBU with β-CD (a), and ionized IBU with β-CD (b). | ||
Based on the previous results, the loading process was mainly determined by electrostatic interaction provided by the CS and inclusion between β-CD and the different states of the drug molecule. A satisfactory loading content was achieved at pH 5 because then the stronger electrostatic interaction and inclusion could be realized simultaneously.
On the basis of single factor experiments, the highest amount of loaded IBU was achieved in a drug solution at pH 5 with a concentration of 70 mg L−1 when the CS–CD–SMNP concentration was 0.2 mg mL−1 and the maximum loading content was 82.87 mg g−1 after 4 h of loading. Compared with other drug carriers for IBU (Table 1), the CS–CD–SMNPs in the study exhibited a relatively high loading capacity. In the present work, it was demonstrated that a simple and mild layer-by-layer method could be used to obtain effective targeted delivery. One significant advantage of using the layer-by-layer method is that it allows the independent optimization and fine tuning of different properties of the individual components, which could be used to combine the properties of different materials well. Using this combination, the magnetic target properties of the Fe3O4 MNPs and biological functionality of CS together with β-CD can be highly desirable for its satisfactory loading capacity and targeting behavior of hydrophobic drugs.
| Drug carriers | Loading content |
|---|---|
| CS–sodium tripolyphosphate39 | 44.4 |
| CS–sodium tripolyphosphate–dextran sulfate39 | 82.9 |
| Poly(aspartic acid)–β-CD40 | 4.14 |
| CS coated mesoporous silica41 | 100 |
| Poly(methyl methacrylate-2-hydroxyethyl methacrylate)42 | 48.7 |
| Magnetic iron oxide/silica/calcium silicate43 | 75 |
| CS–CD–SMNPsThis study | 82.87 |
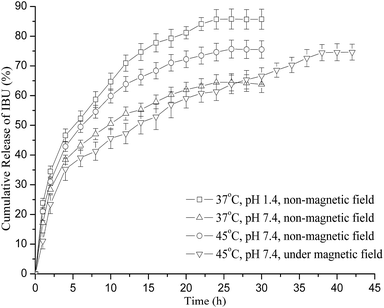
It is known that magnetic targeted drug delivery injected in to the human body should be guided to the targeted organs or locations using an external or embedded magnetic field and then positioning the drug to be released into the diseased tissues. However, few studies on site specific release have been found in the literature, for similar polymer particles. Thus, in the present study, the release behavior of the IBU–CS–CD–SMNPs carriers under a magnetic field was evaluated at 45 °C in PBS (pH 7.4). As shown in Fig. 11, the drug carriers showed a small amount of drug release in the first hour under the magnetic field, and compared with the drug release with no additional magnetic field, the site specific release rate was slower, but the final release amount was very similar. The results indicated that the drug release behavior was also related to the external magnetic field, which had a significant effect on the aggregation state and distribution of the drug carrier and the diffusion process. Because of the magnetic orientation role of MNPs, the magnetic drug nanocarriers could be transported by applying an external magnetic field and the concentration of the drug could be maintained for a prolonged time.44 Such a rapid transport and slow release of the nanocarriers to the targeted site may be desirable for biomedical applications, as their use could minimize the drug leakage at unwanted sites and reduce the risk of side effects. These results demonstrated that the CS–CD–SMNPs prepared, showed good promise as magnetic drug carriers to be used in magnetically targeted and controlled drug delivery.
Meanwhile, the drug release kinetics were characterized by fitting the various standard release models and mathematical equations such as zero-, first- and Korsmeyer–Peppas equation to the experimental data.45 Simulated equations and correlation coefficients were calculated and are compared in Table 2. It was clearly observed that IBU released from IBU–CS–CD–SMNPs with no additional magnetic field was described better by the Korsmeyer–Peppas models where the values of correlation coefficient under all conditions were greater than those obtained using the first-order and zero-order models, which gives an insight into its release mechanism.
| T (°C) | Kinetic model | Equation | Correlation coefficient (R2) |
|---|---|---|---|
| 37 (pH 1.4) | Zero-order | Q = 0.2959 + 0.0363 × t | 0.9736 |
| First-order | ln(1 − Q) = −0.2951 − 0.0747 × t | 0.9925 | |
| Korsmeyer–Peppas | lnQ = −1.3207 + 0.3826 × lnt | 0.9956 | |
| 37 (pH 7.4) | Zero-order | Q = 0.268 + 0.024 × t | 0.9471 |
| First-order | ln(1 − Q) = −0.29 − 0.0419 × t | 0.9703 | |
| Korsmeyer–Peppas | lnQ = −1.477 + 0.3496 × lnt | 0.9919 | |
| 45 (pH 7.4) | Zero-order | Q = 0.2622 + 0.0328 × t | 0.9684 |
| First-order | ln(1 − Q) = −0.2678 − 0.0602 × t | 0.9887 | |
| Korsmeyer–Peppas | lnQ = −1.4479 + 0.3911 × lnt | 0.9961 | |
| 45 (pH 7.4) (magnetic) | Zero-order | Q = 0.2941 + 0.0154 × t | 0.9887 |
| First-order | ln(1 − Q) = −0.3263 − 0.0272 × t | 0.9889 | |
| Korsmeyer–Peppas | lnQ = −1.457 + 0.2891 × lnt | 0.9821 |
The Korsmeyer–Peppas model is widely applied to describe drug release from slabs, cylinders and spheres, which is helpful in understanding the corresponding mechanism for the release behavior. It was expressed as follows:46
| Qt/Q∞ = ktn |
For spherical drug carriers, the threshold of n value between a Fickian and non-Fickian mechanism is 0.43.47 In particular, a value of n ≤ 0.43 corresponds to a Fickian diffusion release, whereas a value of n between 0.43 and 0.85 indicates an anomalous non-Fickian transport. The n values given in Table 2 indicate a diffusion controlled release. However, in comparison with the release using a non-magnetic field, a decreased correlation coefficient occurred because of the external magnetic field, which was attributed to the combination of diffusion as well as magnetic control.
Conclusions
In the present work, superparamagnetic CS–CD–SMNPs were successfully synthesized and characterized. The existence of this double shell of polymers ensured the colloidal stability and biocompatibility of the nanocarriers. The loading capacity and release behaviors were highly dependent on the structure of the nanocarriers. The related mechanism was studied at the molecular level by applying a molecular modeling study, which gave a good explanation of the experimental results. Combining the molecular modeling with the results of zeta potential analysis, it could be concluded that the amount of IBU adsorbed was mainly a function of the intensity of the electrostatic interaction and inclusion provided by the CS layer and β-CD layer, respectively. For the in vitro release process, the nanocarriers showed a two-step release that consisted of an initial fast release and then a slower sustained release. Based on the Korsmeyer–Peppas model, the release mechanism was attributed to a mixed effect of swelling and diffusion controlled release, which could be affected by pH, temperature and magnetic field. The nanocarriers based on the β-CD and CS have the advantages of magnetic sensitivity, high drug loading and sustained release, and they could serve as the targeted drug delivery for hydrophobic drugs in the future.Acknowledgements
Preparation of this paper was supported by the National Scientific Foundation of China (No. 81373284) and the 2013 Scientific Research Foundation of Sichuan University for Outstanding Young Scholars.Notes and references
- R. H. Müller, C. Jacobs and O. Kayser, Adv. Drug Delivery Rev., 2001, 47, 3–19 CrossRef.
- A. K. Gupta and M. Gupta, Biomaterials, 2005, 26, 3995–4021 CrossRef CAS PubMed.
- J. Zhang and R. D. K. Misra, Acta Biomater., 2007, 3(6), 838–850 CrossRef CAS PubMed.
- L. Barbosa-Barros, S. García-Jimeno and J. Estelrich, Colloids Surf., A, 2014, 450, 121–126 CrossRef CAS.
- P. P. Zhang, B. Wang, G. R. Williams, C. Branford-White, J. Quan, H. L. Nie and L. M. Zhu, Mater. Res. Bull., 2013, 48(9), 3058–3064 CrossRef CAS.
- A. H. Lu, E. L. Salabas and F. Schüth, Angew. Chem., 2007, 46(8), 11222–11244 Search PubMed.
- T. S. Anirudhan, D. Dilu and S. Sandeep, J. Magn. Magn. Mater., 2013, 343, 149–156 CrossRef CAS.
- D. Y. Chen, X. W. Xia, H. W. Gu, Q. F. Xu, J. F. Ge, Y. G. Li and J. M. Lu, J. Mater. Chem., 2011, 21(34), 12682–12690 RSC.
- J. P. Chen, P. C. Yang, Y. H. Ma and T. Wu, Carbohydr. Polym., 2011, 84, 364–372 CrossRef CAS.
- S. S. Banerjee and D. H. Chen, Chem. Mater., 2007, 19, 6345–6349 CrossRef CAS.
- A. Z. M. Badruddoza, M. Rahman, S. Ghosh, M. Hossain, J. Z. Shi, K. Hidajat and M. S. Uddin, Carbohydr. Polym., 2013, 95, 449–457 CrossRef CAS PubMed.
- Y. L. Ding, S. Z. Shen, H. D. Sun, K. N. Sun, F. T. Liu, Y. S. Qi and J. Yan, Mater. Sci. Eng., C, 2015, 48, 487–498 CrossRef CAS PubMed.
- Q. Yuan, R. Venkatasubramanian, S. Hein and R. D. K. Misra, Acta Biomater., 2008, 4(4), 1024–1037 CrossRef CAS PubMed.
- G. Unsoy, R. Khodadust, S. Yalcin, P. Mutlu and U. Gunduz, Eur. J. Pharm. Sci., 2014, 62, 243–250 CrossRef CAS PubMed.
- H. Qin, C. M. Wang, Q. Q. Dong, L. Zhang, X. Zhang, Z. Y. Ma and Q. R. Han, J. Magn. Magn. Mater., 2015, 381, 120–126 CrossRef CAS.
- S. Z. Wu, F. Zeng, H. P. Zhu and Z. Tong, J. Am. Chem. Soc., 2005, 127(7), 2048–2049 CrossRef CAS PubMed.
- M. Prabaharan and S. Q. Gong, Carbohydr. Polym., 2008, 73(1), 117–125 CrossRef CAS.
- A. Trapani, A. Lopedota, M. Franco, N. Cioffi, E. Ieva, M. Garcia-Fuentes and M. J. Alonso, Eur. J. Pharm. Biopharm., 2010, 75, 26–32 CrossRef CAS PubMed.
- H. Kono and T. Teshirogi, Int. J. Biol. Macromol., 2015, 72, 299–308 CrossRef CAS PubMed.
- H. N. Meng, Z. Z. Zhang, F. X. Zhao, T. Qiu and J. D. Yang, Appl. Surf. Sci., 2013, 280, 679–685 CrossRef CAS.
- L. Liu, T. H. Ye, Y. P. Han, H. Song and L. T. Yu, Cell. Physiol. Biochem., 2014, 33, 633–645 CrossRef CAS PubMed.
- Y. C. Yao, H. Xu, C. Liu, Y. Y. Guan, D. Q. Xu, J. Y. Zhang and J. B. Luo, RSC Adv., 2016, 6, 9082–9089 RSC.
- H. M. Redhead, S. S. Davis and L. Illum, J. Controlled Release, 2001, 70, 353–363 CrossRef CAS PubMed.
- W. Snor, E. Liedl, P. Weiss-Greiler, H. Viernstein and P. Wolschann, Int. J. Pharm., 2009, 381(2), 146–152 CrossRef CAS PubMed.
- J. P. Xu, L. M. Zhou, Y. Y. Jia, Z. R. Liu and A. A. Adesina, J. Radioanal. Nucl. Chem., 2015, 303, 347–356 CrossRef CAS.
- W. R. Zhao, J. L. Gu, L. X. Zhang, H. R. Chen and J. L. Shi, J. Am. Chem. Soc., 2005, 127(25), 8916–8917 CrossRef CAS PubMed.
- S. N. Lv, Y. B. Song, Y. Y. Song, Z. G. Zhao and C. J. Chen, Appl. Surf. Sci., 2014, 305, 747–752 CrossRef CAS.
- E. B. Denkbaş, E. Kiliçay, C. Birlikseven and E. Öztürk, React. Funct. Polym., 2002, 50, 225–232 CrossRef.
- P. E. Podzus, M. E. Daraio and S. E. Jacobo, Phys. B, 2009, 404, 2710–2712 CrossRef CAS.
- H. Y. Shen, Z. J. Wang, A. M. Zhou, J. L. Chen, M. Q. Hu, X. Y. Dong and Q. H. Xia, RSC Adv., 2015, 5, 22080–22090 RSC.
- J. Zheng, C. J. Ma, Y. F. Sun, M. R. Pan, L. Li, X. J. Hu and W. L. Yang, ACS Appl. Mater. Interfaces, 2014, 6, 3568–3574 CAS.
- J. Zhi, Y. J. Wang, Y. C. Lu, J. Y. Ma and G. S. Luo, React. Funct. Polym., 2006, 66, 1552–1558 CrossRef CAS.
- A. Z. M. Badruddoza, G. S. S. Hazel, K. Hidajat and M. S. Uddin, Colloids Surf., A, 2010, 367, 85–95 CrossRef CAS.
- J. D. Clogston, A. K. Patri and S. E. Mcneil, Methods Mol. Biol., 2011, 679, 63–70 Search PubMed.
- T. Mosmann, J. Immunol. Methods, 1993, 95, 55–63 Search PubMed.
- G. Z. Jiao, X. He, X. Li, J. Q. Qiu, H. Y. Xu, N. Zhang and S. M. Liu, RSC Adv., 2015, 5, 53240–53244 RSC.
- A. K. Gupta and M. Gupta, Biomaterials, 2005, 26, 1565–1573 CrossRef CAS PubMed.
- N. Lindqvist, T. Tuhkanen and L. Kronberg, Water Res., 2005, 39, 2219 CrossRef CAS PubMed.
- W. C. Lin, D. G. Yu and M. C. Yang, Colloids Surf., B, 2005, 44, 143–151 CrossRef CAS PubMed.
- Z. Y. Sun, M. X. Shen, A. W. Yang, C. Q. Liang, N. Wang and G. P. Cao, Chem. Commun., 2011, 47, 1072–1074 RSC.
- A. Popat, J. Liu, G. Q. Lu and S. Z. Qiao, J. Mater. Chem., 2012, 22, 11173 RSC.
- M. Sivakumar and K. P. Rao, J. Appl. Polym. Sci., 2002, 83(141), 3045–3054 CrossRef CAS.
- B. Q. Lu, Y. J. Zhun, G. F. Cheng and Y. J. Ruan, Mater. Lett., 2013, 104, 53–56 CrossRef CAS.
- D. G. Julian, D. A. Chamberlain and S. J. Pocock, BMJ – Brit. Med. J., 1996, 313, 1429–1431 CrossRef CAS PubMed.
- X. Y. Zhang, L. Xue, J. Wang, Q. Liu, Z. Gao and W. L. Yang, Colloids Surf., A, 2014, 431, 80–86 CrossRef.
- P. L. Ritger and N. A. Peppas, J. Controlled Release, 1987, 5(1), 37–42 CrossRef CAS.
- M. L. Vueba, L. A. E. Batista de Carvalho, F. Veiga, J. J. Sousa and M. E. Pina, Eur. J. Pharm. Biopharm., 2004, 58(1), 51–59 CrossRef CAS PubMed.
| This journal is © The Royal Society of Chemistry 2017 |

