 Open Access Article
Enhanced proliferation inhibition of HL60 cells treated by synergistic all-trans retinoic acid/blue light/nanodiamonds†
Jianjian Zhuanga,
Junsong Liua,
Yange Liub,
Hongdong Li *a,
Di Wang*b and
Lesheng Teng*b
aState Key Lab of Superhard Materials, Jilin University, Changchun 130012, PR China. E-mail: hdli@jlu.edu.cn
bCollege of Life Sciences, Jilin University, Changchun 130012, PR China. E-mail: jluwangdi@gmail.com; tenglesheng@jlu.edu.cn
First published on 8th August 2017
Abstract
To improve drug efficacy and minimize side effects for treating human promyelocytic leukemia cells, we explored a strategy using the traditional chemotherapy drug all-trans retinoic acid (ATRA) combined with nanodiamonds (NDs) and blue light (BL) irradiation on the typical HL60 cell line. The synergistic ATRA–BL–ND could significantly induce cell inhibition ∼4 times that treated by ATRA alone. The introduction of BL plays an important role in the enhancement of cells apoptosis, improves the level of reactive oxygen species (ROS), reduces the expression of B-cell leukemia/lymphoma 2 (Bcl-2) mRNA, and increases the activation of caspase-3 of HL60 cells. The biocompatible NDs are favorable for increasing ATRA concentration and improving drug delivery. The synergistically enhanced antitumor effect was further verified by in vivo examinations. The results in this paper could be helpful to establish a high efficiency and low toxicity strategy for clinical treatment of various tumors.
1. Introduction
Leukemia, a group of hematological malignancies, is one of the most dangerous threats to human health. HL60 cells with promyelocytic morphology features are an important malignant tumor cell in the blood, named acute myeloid leukemia AML-M2 cell lines (AML with M2 maturation subtype characterized by the maturation stages of the myeloid cell development).1,2 The drug all-trans retinoic acid (ATRA) has been widely applied for the treatment of leukemia.3,4 It was reported that ATRA could induce HL60 cell differentiation, and generally lead to apoptosis by a mitochondria apoptosis pathway.5–10 However, toxic side effects could be produced by ATRA after longterm usage.11 It is necessary to develop a feasible approach to improve ATRA efficiency and reduce the drug dosage in an attempt to relieve side effects. In order to solve this problem, combining ATRA with other drugs have been proposed.12–14 The combination of ATRA and arsenic trioxide (ATO) was reported to obtain high remission rate in a relatively short time and high survival rate.14 However, ATO could cause some adverse reactions due to its toxicity and carcinogenic property.15,16 Another strategy of photodynamic therapy has been proposed to treat acute myeloid leukemia, e.g., the red light irradiation on the photosensitizer of Purpurin 18 could promote the apoptosis in HL60 cells.17,18 However, during treatment processes, the photosensitizer would generally cause toxicity, non-selective accumulation, and low capillaries permeability.19,20 Ultraviolet (UV) is reported to inhibit the growth of HL60 cells, while UV light may cause skin cancer.21 Blue light (BL) from LED (light-emitting-diode) irradiated on HL60 cells, which is relatively safe to human cells, has been employed to achieve an obvious inhibition.22 However, the related mechanisms and systematic researches at a molecular level have not been investigated thus far. Therefore, it is highly desirable to find a new strategy to further improve the therapeutic efficiency and minimize the side effects in the treatment of HL60 cells, and to deeply study the corresponding inhibition mechanism.Recently, our group applied non-toxic and bio-compatibility ND to enhance the amount of ATRA molecules and efficiently promote the apoptosis of HL60 cells with reducing drug dosage efficiently.23 In this paper, we combine ATRA, BL irradiation and ND to further improve the therapeutic effect on HL60 cells. The examinations include proliferation inhibition, apoptosis, level of reactive oxygen species (ROS), expression of B-cell leukemia/lymphoma 2 (Bcl-2) mRNA, and caspase-3 activation. The growth and inhibition of tumor in HL60 xenograft model were tested by various treatments of ATRA, BL, ATRA–BL, ATRA–ND and ATRA–BL–ND in turn to determinate their antitumor effects. It is demonstrated that the synergistic treatment of ATRA–BL–ND is favorable for significantly increasing the inhibition of tumors compared to that by ATRA alone.
2. Experimental
2.1. Preparations of materials, cell line, and equipment
The materials, cell line, and various equipment used in the experiments are listed in ESI.†2.2. Synthesis of ATRA–ND compound
10 mg detonation ND (5–10 nm in size) was dispersed in solution of 18.4 mol L−1 H2SO4![[thin space (1/6-em)]](https://www.rsc.org/images/entities/char_2009.gif) :
:![[thin space (1/6-em)]](https://www.rsc.org/images/entities/char_2009.gif) 14.5 mol L−1 HNO3 (9
14.5 mol L−1 HNO3 (9![[thin space (1/6-em)]](https://www.rsc.org/images/entities/char_2009.gif) :
:![[thin space (1/6-em)]](https://www.rsc.org/images/entities/char_2009.gif) 1) and heated in water bath at 75 °C for 72 h. The esterification of NDs were carried out by adding 100 mL ethanol into the above mixture to achieve a dispersed 0.1 mg mL−1 NDs, and then heated at 120 °C for 24 h. The esterified NDs were washed into neutral (pH = 7.0) by using deionized water and then dried under vacuum. The 100 mM ATRA powder and 100 mg L−1 NDs were dispersed into DMSO, separately, and then were mixed together. The mixture was finally added into water slowly drop by drop and vortexed for 30 min to obtain ATRA–ND product. The morphology and size of the ATRA–ND compound are shown in TEM (transmission electron microscopy) image of Fig. S1.†
1) and heated in water bath at 75 °C for 72 h. The esterification of NDs were carried out by adding 100 mL ethanol into the above mixture to achieve a dispersed 0.1 mg mL−1 NDs, and then heated at 120 °C for 24 h. The esterified NDs were washed into neutral (pH = 7.0) by using deionized water and then dried under vacuum. The 100 mM ATRA powder and 100 mg L−1 NDs were dispersed into DMSO, separately, and then were mixed together. The mixture was finally added into water slowly drop by drop and vortexed for 30 min to obtain ATRA–ND product. The morphology and size of the ATRA–ND compound are shown in TEM (transmission electron microscopy) image of Fig. S1.†
2.3. Cell culture
HL60 cells were cultured at 1 × 10⁵ cells per mL in Roswell Park Memorial Institute (RPMI) 1640 medium supplemented with 10% fetal bovine serum (FBS) and 100 units per mL penicillin–100 μg mL−1 streptomycin, at 37 °C in a 5% CO2 humidified atmosphere.2.4. LED irradiation treatments
The viability of HL60 cells under different wavelengths were assessed by using cell counting kit-8 assay (CCK-8, BestBio, China). The LED light reaction chamber was kept at 37 °C consists of a black shading box with 36 commercial LED arrays pasted (Fig. S2a†). The power was supplied by 12 V battery, and the radiation power density was 0.25 mW cm−2. The central wavelengths of LEDs were 456 nm (blue), 515 nm (green), 630 nm (red) and 840 nm (near infrared), respectively, as shown in Fig. S3.† Emission spectra tested by USB4000 spectroscopy system (Ocean Optics). HL60 cells were seeded in 96-well plates with a density of 1 × 10⁴ cells per well at 37 °C in a 5% CO2 humidified atmosphere, and irradiated with different central wavelength. The absorbance was measured at 450 nm using ELX 808 microplate reader with specific time. Cell viability was expressed as the percentage of absorbance in the BL treated cells compared to that in the dark control cells.2.5. Cell cytotoxicity assay
The viability in HL60 cells under different group were assessed by using CCK-8. The HL60 cells were seeded in 96-well plates with a density of 1 × 10⁴ cells per well at 37 °C in a 5% CO2 humidified atmosphere. For the experimental groups, the viabilities of HL60 cells were tested after treated by ND, ATRA, ATRA–ND, BL, BL–ND, ATRA–BL, and ATRA–BL–ND used as the experimental groups. The cells cultured in 0.1% DMSO medium was used as control group. The cells were treated for 24 h. Then 10 μL CCK-8 was added to each well and incubated for an additional 4 h at 37 °C in 5% CO2 in dark. The absorbance was measured at 450 nm using ELX 808 microplate reader. Cell viability was expressed as the percentage of absorbance in the treated cells compared to that in the dark control cells.2.6. Apoptosis analysis
The apoptosis rate of HL60 cells were measured by flow cytometry. HL60 cells were seeded at a density of 5 × 10⁵ cells per well in 100 mm culture plates. The cells treated by ND, ATRA, ATRA–ND, BL, BL–ND, ATRA–BL, ATRA–BL–ND were used as the experimental groups, and cultured in 0.1% DMSO medium was used as control group. The experiments were carried out as that continuously irradiating by BL for 12 h per day. On next day, the LED was turn on for the next 12 h irradiation. It means that for the process lasted for 1 day (2 days, 3 days), the BL irradiation was 12 h (24 h, 36 h). The apoptosis was measured by using Annexin-FITC apoptosis detection kit (BestBio, China). Briefly, the cells were collected and washed with cold PBS, and then re-suspended in 500 μL binding buffer containing 1% (5 μL) Annexin V-FITC and 2 μg mL−1 propidium iodide (PI) as DNA stain for 20 min at 4 °C in a CO2 incubator. The fluorescence intensity of 2 × 10⁴ cells were measured and analyzed by FACScan flow cytometry for Annexin V-FITC (with the excitation wavelength at 488 nm and emission wavelength at 525 nm) and PI (with the excitation wavelength at 488 nm and emission wavelength at 620 nm). The apoptosis ratios were obtained by the Cell Quest software (Becton Dickinson), calculated by the sum of number proportions of the early (the lower right quadrant) and late apoptotic cells (the upper right quadrant) to total cells tested.2.7. ROS determination
The ROS assay was used to determine the influence of ATRA–BL–ND on the production of ROS levels by using cellular ROS detection assay kit (Beyotime Biotechnology Inc. China). H2DCFDA was used as the cell permeable fluorescent probe, which is hydrolyzed by cellular esterase to non-fluorescent form and was oxidized and converted to fluorescent DCF at the present of ROS. Briefly, the HL60 cells were seeded in 24-well plates with a density of 5 × 10⁵ cells per well. The cells treated by ND, ATRA, ATRA–ND, BL, BL–ND ATRA–BL, ATRA–BL–ND were used as the experimental groups, and cultured in 0.1% DMSO medium was used as control group. BL irradiation was lasted for 24 h. We added 1 μL H2DCFDA solution into 1 mL PBS to get the 10 mM final concentration H2DCFDA. 500 μL was added to each well and incubated for 30 min at 37 °C in a humidified CO2 incubator. The cells were washed with PBS and fluorescent intensity of total 2 × 10⁴ cells were measured by FACScan flow cytometry.2.8. Quantification of Bcl-2 mRNA by qRT-PCR
The expression of Bcl-2 mRNA was measured by quantitative Reverse Transcriptase-Polymerase Chain Reaction (qRT-PCR). HL60 cells were seeded in 100 mm culture plates at a density of 5 × 10⁵ cells per well. The cells incubated with ND, ATRA, ATRA–ND, BL, BL–ND, ATRA–BL, ATRA–BL–ND were used as experimental groups, and cultured in 0.1% DMSO medium was used as control group. BL irradiation was lasted for 24 h. The cells were collected and washed by PBS. RNA was extracted from cells according to the instruction of RNA isolation kit (Takara, China). The purity of RNA was measured by NanoDrop and A260/A280 ≥ 1.8, the RNA was reverse transcribed to cDNA by using reverse transcription kits (Takara, China). The designed PCR primers were as follows: Bcl-2 forward, 5′ATGTGTGTGGAGAGCGTCAACC3′ and reverse, 5′CGACAGCCAGGAGAAATCAAACAGAG-3′; β-forward, 5′TGACGTGGACTCCGCAAAG-3′ and reverse, 5′CTGGAAGGTGGACAGCGAGG-3′. The qRT-PCR was performed by using the ABI Prism 7500 Sequence Detection System. The amplification system was performed by using a SYBR Premix Ex Taq™ kit (Takara, China), with the experimental conditions: by initial denaturation at 95 °C for 3 s, followed by 40 cycles of amplification, 60 °C for 34 s for data collection. The dates were calculate relative to a calibrator using the formula 2−ΔΔCt.2.9. Caspase-3 activity assay
The activity of caspase-3 protein was measured by caspase-3 activity assay kit (BestBio, China). HL60 cells were seeded in 100 mm culture plates at a density of 5 × 10⁵ cells per well. The cells treated by ND, ATRA, ATRA–ND, BL, BL–ND ATRA–BL, ATRA–BL–ND were used as experimental groups, and cultured in 0.1% DMSO medium was used as control group. BL irradiation was lasted for 24 h. At the end of the experiments, the cells were washed with cold PBS and centrifuged. The cells pellet was lysed and the amounts of cell lysate was measured by using Bradford assay kit, briefly, the unknown protein concentration was measured according to the standard curve. The caspase-3 activity was analyzed by quantitative colorimetric assay with caspase-3 activity assay. The detailed procedures include 20–50 μg protein lysate mix with 90 μL detection buffer, then add 10 μL Ac–DEVD–pNA. The above mixture was incubated at 37 °C for 1–2 h, then the absorbance at 400 nm was measured. The absorbance ratio of the experimental and control groups were presented.2.10. Animal experiments
Male BALB/c nude mice were maintained in six groups in different cages (Fig. S2b†) within a controlled lighting environment conditions under a 12 h light/dark cycle (lights on 07:00–19:00 h) at 23 ± 1 °C with water and mouse chow freely. In this experiment, the mice were freely moving during the BL irradiation. The animal experiments were performed according to the protocol approved by the Animal Ethics Committee of Jilin University and the Laboratory Animal Center of Jilin University (license no. SCXK-(JI) 2011-0003).2.11. HL60 xenograft mouse model
Cells suspension with a density of 1 × 10⁷ cells/100 μL were subcutaneously injected into mice (5 weeks old, male BALB/c nude mice, Vital River Laboratory Animal Technology Co. Ltd., China), and the palpable tumors were observed within 7 days. Tumors volume were calculated using the following formula24,25 volume (in mm3) = length (mm) × width (mm) × width (mm)/2. All procedures were approved by the Animal Ethics Committee of Jilin University. The mice bearing tumor were randomly divided into six groups (n = 3 per group). Phosphate buffered saline (PBS) was used as control group. ATRA, ATRA–ND, BL, ATRA–BL, ATRA–BL–ND were used as experimental groups for treatments. ATRA (5 mg kg−1) and ATRA–ND (ATRA: 5 mg kg−1–ND: 5 mg kg−1) was dissolved in PBS was given to mice by intraperitoneal injection which was relatively safe route and toxicity was mild every two days. BL irradiation for 8 h per day were lasted for 7 days. The irradiation distance was about 12 cm and the light intensity was 0.25 mW cm−2. Intraperitoneal injection of 5 mg per kg ATRA (containing 1% hydroxymethyl cellulose sodium) for five times in a week. Tumor volume and weight of mice were measured everyday. After anesthetization with 200 mg per kg pentobarbital, the tumors were dissected.2.12. Statistical analysis
The results were represented as the means ± standard deviation (SD). Statistical significance was carried out by analysis of variance (ANOVA) test followed by Newman–Keuls multiple comparison test (GraphPad Software). P < 0.05 was considered statistically significant. All experiments were performed in triplicate.3. Results and discussion
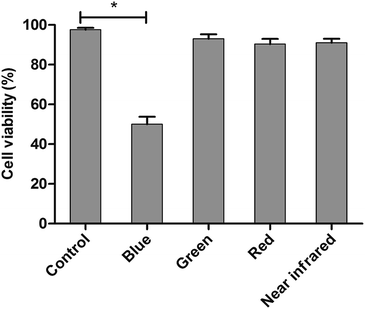
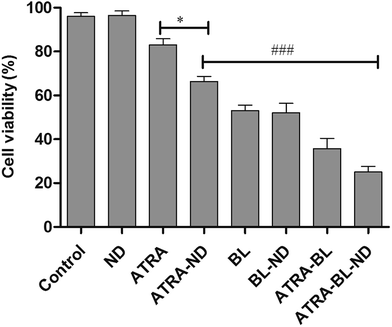
The LED arrays with different wavelengths (Fig. S3†) were used to examine the proliferation inhibition of HL60 cells. For the inhibition rates illuminated by various LEDs (Fig. 1), a maximum of 50% rate was realized under BL irradiation, showing the highest value among those treated with varying wavelengths. The BL LED was thus chosen as the irradiation source in this work.Cell proliferation inhibition under different conditions (DMSO, ND, ATRA, ATRA–ND, BL, BL–ND, ATRA–BL, ATRA–BL–ND) treated for 24 h are plotted in Fig. 2. The cell inhibition rates are 3.2%, 17% and 34% treated by ND, ATRA and ATRA–ND, respectively. Due to the bio-compatibility of ND, the inhibition of the HL60 cells by ND treatment can be nearly ignored. It was reported that the large specific surface area of ND can improve the adsorption of ATRA and increase the local drug concentration, which is favorable for increasing the inhibition of HL60 cells treated by ATRA.23 Illuminated under BL, the cell inhibition rate was 53%, which is 3.1 times that by ATRA alone. The combined BL and ND does not produce evident increase of inhibition with respect to that for BL, due to the biological compatibility of ND.26,27 A 65% inhibition rate is realized proposed with ATRA–BL group, which is 3.8 and 1.2 times that by ATRA and/or BL alone. Importantly, when the combined ATRA–BL–ND was synergistically performed for treating HL60 cells, the highest inhibition rate of 75% was obtained, which was 1.2, 2.2 and 4.4 times that by ATRA–BL, ATRA–ND and ATRA, respectively, showing the most significant inhibition effect.
For confirming the increased growth inhibitory effect of ATRA–BL–ND on HL60 cells, the apoptosis was studied. Annexin V-fluoresceinisothiocyanate/propidiumiodide (Annexin V-FITC/PI) double staining was proposed to test HL60 cell apoptosis treated for 24, 48 and 72 h under different conditions (Fig. S4†). As plotted in Fig. 3, the apoptosis rates increased linearly in the 24–72 h region for various experimental groups, except for the cases of the control and the bio-compatible ND groups. For 24 h, the apoptosis rate of HL60 cells by ATRA–ND is 19.4%, which is 2.5 times that of ATRA treatment (7.8%). The result shows that the apoptosis rate of BL (35.6%) is 4.6 times that of ATRA (7.8%) alone, ATRA–BL can obviously accelerate the apoptosis rate (57.1%). After combining BL, ND and ATRA, the maximum apoptosis rate of 66.2% was obtained, which was 3.4 and 1.2 times that of ATRA–ND and ATRA–BL groups, respectively, and even 8.5 times that of ATRA group. With increasing the time, the apoptosis rates were all enhanced with the same increasing trend of apoptosis rates in 48 h and 72 h. For 48 h (72 h), the rates were: ND: 3.8% (4.5%); ATRA: 15.9% (25.7%); ATRA–ND: 29.6% (46.6%); BL: 43.7% (65.5%); BL–ND: 44.5% (63.5%); ATRA–BL: 71.0% (85.3%) and ATRA–BL–ND: 85.3% (97.1%). Among most cases, the combined ATRA–BL–ND group leads to the highest cell apoptosis.
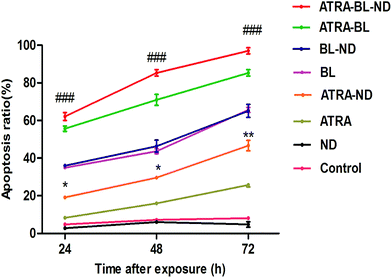 | ||
| Fig. 3 The plots of the apoptosis ratio as a function of time treated with 0.1% DMSO medium alone (control), ND, ATRA, ATRA–ND, BL, BL–ND, ATRA–BL and ATRA–BL–ND in 24 h (1 day), 48 h (2 days) and 72 h (3 days). BL irradiation was lasted for continuous 12 h each day. The apoptosis ratios were measured by using flow cytometry, as presented in Fig. S4.† The identification of the fluorochromes was measured and analyzed by FACScan flow cytometry for Annexin V-FITC and PI. The apoptosis ratios were calculated by the Cell Quest software (Becton Dickinson). The results are shown as the means ± SD (n = 3). *p < 0.05 and **p < 0.01 vs. ATRA, ###p < 0.001 vs. ATRA–ND. | ||
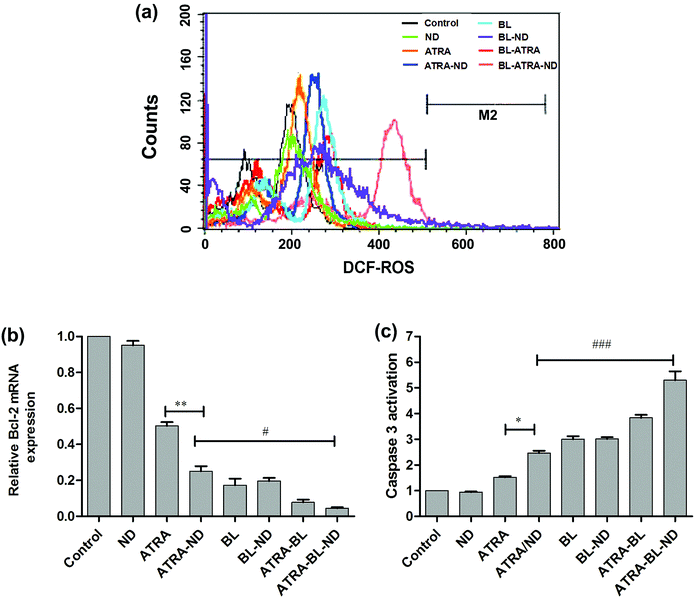
To further understand the mechanism of increased apoptosis treated by various routes on HL60 cells, the levels of ROS, expression of Bcl-2 mRNA and activation of caspase-3 were tested. The cells were treated with cell permeable fluorescent probe H2DCFDA to detect the level of ROS (Fig. 4a). Compared with the control group, the introduced bio-compatible NDs alone did not lead to evident variation of ROS. The similar bio-compatibility of ND was also presented in the examinations of expression level of Bcl-2 mRNA (Fig. 4b) and activity of caspase-3 (Fig. 4c). In Fig. 4a, the ROS level treated by ATRA drug is increased, which is in agreement with the results in literature.6 A higher level of ROS was achieved by adding NDs combined with ATRA. Because NDs have large surface area, and drug molecules can be adsorbed on the surface of NDs (modified by esterification), i.e., one ND particle can load large amount of various drug molecules and deliver to tumor cells,27 resulting in a increase of localized ATRA concentration applied to HL60 cells.23
Noted that the BL irradiation could increase the level of ROS greater than ATRA group alone, which might be attributable to light-activated mitochondria leading to damage of DNA and/or protein.28–31 Furthermore, the synergistic ATRA–BL–ND produced the highest level of ROS, because ATRA and BL can jointly improve the level of ROS, and ND increases the local concentration of ATRA. It has been reported that ATRA reduces the level of the Bcl-2 mRNA, which further induces HL60 cell apoptosis.32–34 The qRT-PCR tests were performed to detect the expression of Bcl-2 mRNA of HL60 cells (Fig. 4b). The expression of Bcl-2 mRNA has a monotonous decrease after treated by ATRA, ATRA–ND, BL, ATRA–BL, and ATRA–BL–ND, in turn. The decreasing trend of ATRA and ATRA–ND are expected, as presented in Fig. 3 and 4a. Interestingly, the introduced BL irradiation suppresses the expression of Bcl-2 mRNA and subsequently enhance the inhibition of HL60 cells, stronger than that by ATRA and/or ATRA–ND treatments. Based on the above results, and further taking into account the non-contacting and less side effect22 of BL irradiation treatment, it is suggested that BL irradiation is more valuable for practical leukemia treatment in comparison to those by traditional methods. Obviously, the expression of Bcl-2 mRNA treated by ATRA–BL is higher than ATRA or ATRA–ND. Overall, the synergistic ATRA–BL–ND realized the greatest degree in suppressing the expression of Bcl-2 mRNA. Meanwhile, the caspase-3 protease35 located in the downstream of the Bcl-2 might also be activated by ATRA–BL–ND, which leads to the final cells death. A similar trend was observed for the caspase-3 activity of HL60 cells treated under various conditions, as shown in Fig. 4c. The activity of caspase-3, which induced cell apoptosis, has a monotonous improvement after treated by ATRA, ATRA–ND, BL, ATRA–BL, and ATRA–BL–ND, in turn. It is well known that ROS, caspase-3 protease, and Bcl-2 mRNA are all related to the mitochondrial apoptosis of HL-60 cells.6,9 Based on the above results of the increased ROS generation, the down-regulation of Bcl-2 mRNA and the improvement in caspase-3 activity, it is speculated that the pathway for the enhanced inhibition of HL60 cells treated under various conditions mentioned above might be related to a mitochondrial apoptosis. More detailed investigations are being undertaken.
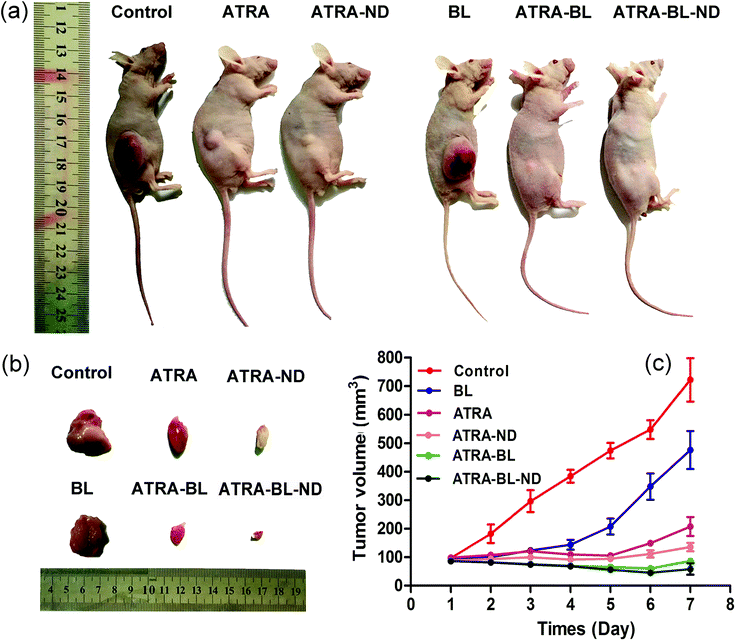
In vivo animal study showed that the tumor growth was inhibited with varying degrees in experimental groups (Fig. 5a and b). In the control group, the tumor volume sharply increased from original 107.3 ± 23.1 mm3 to 722.5 ± 102.5 mm3 after 7 days. In the ATRA and ATRA–ND groups, the tumor volumes reduced obviously. Importantly, in the ATRA–BL–ND group, the tumor volume reduced significantly from original 97.3 ± 23.1 mm3 to 36.5 ± 5.2 mm3, showing a tumor inhibition rate as high as ∼95%, which is higher than that of ∼71% from the ATRA group (Fig. 5c). This demonstrated that for the in vivo tests, the ATRA–BL–ND presented more effective tumor inhibitory than that from individual ATRA, in good agreement with the above results of in vitro cells. It is worth to point out that during the BL irradiation, the mice were free of movement in the chamber and the BL cannot be continuously irradiated directly on the tumor in mouse body, which could reduce the influence of BL on the inhibition of tumor in mice. Therefore, the inhibition rate of tumor for ATRA treatment (drug in the body to continuously inhibit the tumor) was higher than that for BL irradiation alone (Fig. 5), which is different to the results of in vitro tests (Fig. 2, 3 and S4†).
4. Conclusions
In this paper, we provided a new strategy by proposing a synergistic effect of ATRA–BL–ND to significantly enhance the proliferation inhibition of HL60 cells, which is highly efficient than those treated by the traditional ATRA alone. This synergistic effect was verified in both in vitro and in vivo experiments. The formed ATRA–ND drug-capsule, BL irradiation, as well as ATRA, play an important role in enhancing the inhibition of HL60 cells by various examined routes from the level of ROS, expression of Bcl-2 mRNA, and activation of caspase-3. Considering the increased drug loading with bio-compatible ND and the phototherapy (especially by BL irradiation) that has been broadly applied for human health, it is believed that this synergistic strategy could be helpful for improving the clinical treatment effects on various types of leukemia and tumors, but not limit to AML.Acknowledgements
This work was financially supported by the National Natural Science Foundation of China (NSFC) with No. of 51472105. Open Project of State Key Laboratory of Superhard Materials of Jilin University (No. 201503).References
- H. Miyoshi, K. Shimizu, T. Kozu, N. Maseki, Y. Kaneko and M. Ohki, Proc. Natl. Acad. Sci. U. S. A., 1991, 88, 10431–10434 CrossRef CAS.
- V. Andrieu, I. Radford-weiss, X. Troussard, C. Chane, F. Valensi, M. Guesnu, E. Haddad, F. Viguier, F. Dreyfus and B. Varet, Br. J. Haematol., 1996, 92, 855–865 CrossRef CAS PubMed.
- G.-B. Zhou, S.-J. Chen and Z. Chen, Hematology, 2005, 10, 270–280 CrossRef CAS PubMed.
- L. Shi, X.-Q. Weng, Y. Sheng, J. Wu, M. Ding and X. Cai, Oncol. Rep., 2016, 36, 3072–3080 CAS.
- Z.-X. Shen, Z.-Z. Shi, J. Fang, B.-W. Gu, J.-M. Li, Y.-M. Zhu, J.-Y. Shi, P.-Z. Zheng, H. Yan and Y.-F. Liu, Proc. Natl. Acad. Sci. U. S. A., 2004, 101, 5328–5335 CrossRef CAS PubMed.
- C.-Y. Wang, T.-T. Yang, C.-L. Chen, W.-C. Lin and C.-F. Lin, Biochem. Pharmacol., 2014, 88, 86–94 CrossRef CAS PubMed.
- M. Ozeki and J. E. Shively, J. Leukocyte Biol., 2008, 84, 769–779 CrossRef CAS PubMed.
- Y. Otake, T. K. Sengupta, S. Bandyopadhyay, E. K. Spicer and D. J. Fernandes, Mol. Pharmacol., 2005, 67, 319–326 CrossRef CAS PubMed.
- A. Zheng, P. Mäntymaa, M. Säily, T. Siitonen, E. R. Savolainen and P. Koistinen, Br. J. Haematol., 1999, 105, 215–224 CrossRef CAS PubMed.
- L. Degos, H. Dombret, C. Chomienne, M. Daniel, J. Miclea, C. Chastang, S. Castaigne and P. Fenaux, Blood, 1995, 85, 2643–2653 CAS.
- L. Degos, Br. J. Haematol., 2003, 122, 539–553 CrossRef PubMed.
- F. Ferrara, S. Palmieri and G. Mele, Haematologica, 2004, 89, 998–1008 CAS.
- F. Wu, D. Wu, Y. Ren, C. Duan, S. Chen and A. Xu, Oncotarget, 2016, 7, 47319 Search PubMed.
- J. Q. Mi, S. J. Chen, G. B. Zhou, X. J. Yan and Z. Chen, J. Intern. Med., 2015, 278, 627–642 CrossRef CAS PubMed.
- T. D. Zhang, G. Q. Chen, Z. G. Wang, Z. Wang, S. J. Chen and Z. Chen, Oncogene, 2001, 20, 7149 Search PubMed.
- S. Kumar and P. B. Tchoun wou, Cancer Res., 2015, 75, 3811 Search PubMed.
- A. D. Stefano, A. Ettorre, S. Sbrana, C. Giovani and P. Neri, Photochem. Photobiol., 2001, 73, 290–296 CrossRef PubMed.
- M. Triesscheijn, P. Baas, J. H. Schellens and F. A. Stewart, Oncologist, 2006, 11, 1034–1044 CrossRef CAS PubMed.
- Y. Yang, W. Song, A. Wang, P. Zhu, J. Fei and J. Li, Phys. Chem. Chem. Phys., 2010, 12, 4418–4422 RSC.
- S. Wang, R. Gao, F. Zhou and M. Selke, J. Mater. Chem., 2004, 14, 487–493 RSC.
- A. C. S. De Souza, L. Kodach, F. R. Gadelha, C. L. Bos, A. D. M. Cavagis, H. Aoyama, M. P. Peppelenbosch and C. V. Ferreira, Apoptosis, 2006, 11, 1761–1771 CrossRef PubMed.
- M. Ohara, Y. Kawashima, H. Watanabe and S. Kitajima, Int. J. Mol. Med., 2002, 10, 407–411 CAS.
- F. Y. Fan, J. S. Liu and H. D. Li, Mater. Lett., 2014, 133, 262–265 CrossRef CAS.
- D. M. Euhus, C. Hudd, M. C. Laregina and F. E. Johnson, J. Surg. Oncol., 1986, 31, 229–234 CrossRef CAS PubMed.
- N. M. Oh, D. S. Kwag, K. T. Oh, Y. S. Youn and E. S. Lee, Biomaterials, 2012, 33, 1884–1893 CrossRef CAS PubMed.
- Y. Zhu, J. Li, W. Li, Y. Zhang, X. Yang, N. Chen, Y. Sun, Y. Zhao, C. Fan and Q. Huang, Theranostics, 2012, 2, 302–312 CrossRef CAS PubMed.
- S. Augustine, J. Singh, M. Srivastava, M. Sharma, A. Das and B. D. Malhotra, Biomater. Sci., 2017, 5, 901–952 RSC.
- W. Gorczyca, J. Gong, B. Ardelt, F. Traganos and Z. Darzynkiewicz, Cancer Res., 1993, 53, 3186–3192 CAS.
- L. A. Gorgidze, S. A. Oshemkova and I. A. Vorobjev, Biosci. Rep., 1998, 18, 215–224 CrossRef CAS PubMed.
- A. King, E. Gottlieb, D. G. Brooks, M. P. Murphy and J. L. Dunaief, Photochem. Photobiol., 2004, 79, 470–475 CrossRef CAS PubMed.
- B. F. Godley, F. A. Shamsi, F.-Q. Liang, S. G. Jarrett, S. Davies and M. Boulton, J. Biol. Chem., 2005, 280, 21061–21066 CrossRef CAS PubMed.
- Y. Otake, T. K. Sengupta, S. Bandyopadhyay, E. K. Spicer and D. J. Fernandes, Mol. Pharmacol., 2005, 7, 319–326 CrossRef PubMed.
- J. C. Sharpe, D. Arnoult and R. J. Youle, Biochim. Biophys. Acta, Mol. Cell Res., 2004, 1644, 107–113 CrossRef CAS PubMed.
- M. Donovan and T. G. Cotter, Biochim. Biophys. Acta, Mol. Cell Res., 2004, 1644, 133–147 CrossRef CAS PubMed.
- D. G. Kirsch, A. Doseff, B. N. Chau, D.-S. Lim, N. C. de Souza-Pinto, R. Hansford, M. B. Kastan, Y. A. Lazebnik and J. M. Hardwick, J. Biol. Chem., 1999, 274, 21155–21161 CrossRef CAS PubMed.
Footnote |
| † Electronic supplementary information (ESI) available. See DOI: 10.1039/c7ra04093h |
| This journal is © The Royal Society of Chemistry 2017 |

