 Open Access Article
Optical properties of selected 4d and 5d transition metal ion-doped glasses
Hongli Wen *a,
Bing-Ming Chengb and
Peter A. Tannerc
aKey Laboratory of Clean Chemistry Technology of Guangdong Regular Higher Education Institutions, School of Chemical Engineering and Light Industry, Guangdong University of Technology, Guangzhou 510006, P. R. China. E-mail: hongliwen@gmail.com
bNational Synchrotron Radiation Research Centre, Hsinchu, Taiwan
cDepartment of Chemistry, Hong Kong Baptist University, Waterloo Road, Kowloon Tong, Hong Kong S.A.R., P. R. China
First published on 17th May 2017
Abstract
Selected 4d and 5d transition metal ion-doped lead borate (PbO–B2O3) and sodium borosilicate (SiO2–Na2O–B2O3) glasses have been prepared by the melting-quenching technique and their room temperature optical properties were investigated with a view to future co-doping with lanthanide ions. The oxidation states revealed from the diffuse reflectance spectra, absorption spectra, excitation and emission spectra of the glasses are Nb(V), Ta(V), Mo(V, VI), W(VI), Re(IV, VII), Ru(III, IV, VI), Rh(III), and Ir(III). The Ru, Rh, or Ir ion-doped glasses show distinctive strong absorption bands and a red-shifted absorption edge. Charge transfer emission bands are observed for Nb(V), Ta(V), and Mo(VI) at 474 nm, 420 nm and 553 nm, respectively, whereas no visible emission bands can be attributed to Ru, Rh or Ir species. The X-ray absorption spectra of Mo-doped glasses indicate the predominant tetrahedral Mo(VI) moiety. The presence of intense charge transfer absorption and emission bands for some of the transition metal ions provides us with the vision of energy transfer to co-doped lanthanide ions with the application of downshifted emission for a solar cell.
1 Introduction
Compared with bulk crystalline hosts, glasses have the advantages of easy fabrication, low cost, high mechanical strength, and high chemical durability. Therefore, luminescent glass materials play an indispensable role providing a wide spectral range including the ultraviolet, visible, and infrared regions.1 Emission from glass materials can be achieved by doping lanthanide or transition metal (TM) ions into the glass host. Research has focused upon rare earth ion-doped transparent solid state materials whereas less attention has been paid to TM ion-doped materials, despite their semiconductor nature,2 optical switching,3–5 and a broad range of technological applications especially in lasers, phosphors, solar energy converters, plasma display panels and electronic devices.6,7 Furthermore, since the outer shell nd electrons are sensitive to the surrounding ligands, TM ions can be used to probe glass structure.8This work is devoted to the investigation of the UV-Vis-NIR absorption and the luminescence properties of 4d (Nb, Mo, Ru and Rh) and 5d (Ta, W, Re and Ir) TM ion-doped sodium borosilicate glass, as well as the 4d (Mo and Rh) and 5d (W, Re and Ir) ion-doped lead borate glass. We have previously investigated the corresponding properties of 3d TM ion-doped glasses.9,10 The aims of these studies are to provide a solid understanding of the redox and spectral behaviours of TM ions in these glasses as a prerequisite to co-doping with lanthanide ions, with applications in down conversion such as for solar energy conversion. The background information of the electronic structures and spectra of the ions investigated are now briefly described.
The closed-shell TM ions Nb5+, Ta5+ and W6+ in various oxides have metal–oxygen coordinated polyhedral groups contributing to photoluminescence.11,12 The niobium complex NbO43− has been investigated as a possible blue phosphor.13 Blue-green emission from Nb5+ doped glasses excited by an 800 nm femtosecond laser has been ascribed to the charge transfer transition from O2− to Nb5+ ions.14 Rack et al.15 reported that Ta2Zn3O8 thin film emitted light at 385 nm under excitation of 236 nm UV radiation, and that 420 nm blue emission could be observed by filtering. Meng et al.1,16 also reported an intense blue emission centred at 420 nm from tantalum doped silicate glass with composition of (Ta2O5)(CaO)10(SiO2)69(Na2O)20 and suggested that it is due to O2− 2p–Ta5+ 5d0 charge transfer. By contrast to TaO43− and TaO811− complexes at room temperature, octahedrally-coordinated (TaO6)7− systems11 are known as efficient luminescent moieties by this metal-to-ligand transition.
Tungsten has possible oxidation states from +2 to +6,17 with the two most important oxidation states in glass, W5+ and W6+, reported to coexist in tungsten phosphate glasses.18 Tungsten ions are six fold-coordinated in glasses19,20 and form distorted WO6 octahedra in NaPO3–BaF2–WO3 glasses at high concentrations. However, Dong et al. reported blue emission at 468 nm from tungsten ion-doped Na2O–CaO–SiO2 glasses under 800 nm irradiation and they ascribed this emission to the 2p O2− → d0 W6+ charge transfer transition of WO42− tetrahedra.21
The electronic configurations of Mo6+, Mo5+ and Mo4+ are 4d0, 4d1 and 4d2, respectively. The orthorhombic crystal α-MoO3 consists of edge-sharing distorted MoO6 octahedra in chains.22 The octamolybdate unit in (NH4)6Mo8O27·4H2O is built up of distorted MoO6 octahedra sharing edges and corners. Both molar volume and electrical conductivity measurements indicated that Mo6+ ions enter (MoO3)x(PbO)1−x−y(B2O3)y glasses as network modifiers.23,24 From electron spin resonance studies, Boudlich et al.25 concluded that less than 1% of MoO3 in (Li2MoO4)0.1(P2O5)0.9−x(Li2O)x glasses is present as Mo5+. Reddy et al.26 reported that molybdenum ions exist mostly in the Mo6+ state in the glasses of composition (MoO3)x(PbO)20−x(Sb2O3)40(B2O3)40 for x ≤ 0.6, and occupy network forming positions with [MoO4]2− structural units, thereby increasing the rigidity of the glass network. However, when MoO3 is present at higher concentrations, molybdenum ions exist mostly in the Mo5+ state and occupy modifying positions. Similarly, for (MoO3)4(PbO)30(B2O3)66−x(TiO2)x glasses there is a change above x = 0.8 in the oxidation state of molybdenum to +5.27 The 500 nm blue emission from (Mo2O5)0.5(Na2O)20(CaO)15(SiO2)65 glass under 800 nm irradiation has been ascribed to O2− 2p → Mo6+ 4d0 charge transfer in [MoO4]2− tetrahedra.21
All the oxidation states of ruthenium (from 4d0 Ru8+ to 4d5 Ru3+) exhibit colour in aqueous solution due to ligand field splitting and/or charge transfer between the central cation and its ligands.28
Under strong ligand fields, the 1A1g state of the 4d6 ion Rh3+ originates from one of the high energy singlet terms of the free ion, 1I, dropping very rapidly with 10 Dq and crossing the 5T2g state.29 The octahedrally-coordinated Rh3+ ion has a 1A1g (t62g) ground state and the excited states are 1,3T1g and 1,3T2g, belonging to the t52ge1g configuration, with 3T1g as the low-lying excited state. The absorption spectra should therefore consist of two strong bands corresponding to the spin-allowed transitions 1A1g → 1T1g, 1T2g and two weak bands associated with the spin-forbidden transitions 1A1g → 3T1g,3T2g.30
Following the experimental descriptions, the subsequent sections describe the absorption, emission and excitation spectra of the TM-doped glasses. In the case of the Mo-doped glasses, X-ray absorption spectra recorded with synchrotron radiation are also reported.
2 Experimental
2.1 Materials and synthesis
The transition metal ion doped sodium borosilicate glass samples had the following nominal compositions (in mol%): (TM)0.5(SiO2)49.5(Na2O)25(B2O3)25, where TM is one of the 4d-transition metal (Nb, Mo, Ru and Rh) ions or the 5d-transition metal (Ta, W, Re and Ir) ions. The doped lead borate glasses had the general formula (TM)x(PbO)50−x(B2O3)50 (x = 0.5 and 0.01), where TM is Mo, Rh, W, Re and Ir. For comparison, the reference samples with nominal composition (in mol%) of (SiO2)50(Na2O)25(B2O3)25 and (PbO)50(B2O3)50 were also studied. The above mole compositions refer to the batch composition and small changes caused by vapourisation during melting are neglected. The starting materials were SiO2 (silica sand 15–20 mesh extra pure, International Laboratory, USA); Na2CO3 (99.5%), H3BO3 (99.5%), Nb2O5 (99.9%), Ta2O5 (99.9%), WO3 (99%), Re2O7 (99.9%), PbO (99.9+%), Na2WO4·2H2O (all Sigma-Aldrich); KReO4 (99.9%), RuCl3·xH2O (35.1% Ru), RhCl3·xH2O (32.66% Rh), IrCl3·xH2O (57.41% Ir) (all Precious Metals Online, PMO Pty Ltd); MoO3 (99.5%) (Fluka Chemika); and (NH4)6Mo7O24 (99%) (Reidel-de-Haën).The components were milled, well-mixed together, and melted at 1430 °C for sodium borosilicate glass or at 1000–1200 °C for lead borate glass, in aluminium crucibles under air. Samples were obtained by quenching the melts on a brass plate preheated at 300 °C. The prepared glass samples were transferred immediately to be annealed at 300 °C for 15 h in an ambient air atmosphere.
2.2 Instrumental methods
Room temperature diffuse reflectance spectra (DRS) of the glass samples were recorded between 190–2000 nm at a resolution of 1 nm using a Perkin-Elmer Lambda 750 Spectrometer. The grating change between 860–900 nm produces a spectral artefact. We have observed in previous reports9,10 that the quality of DRS is similar to that of transmission spectra for glasses. Room temperature excitation and emission spectra were recorded by a Horiba Jobin Yvon Fluorolog spectrophotometer using a xenon lamp as the light source and the signal was detected by a Hamamatsu R636 photomultiplier.Photoluminescence and X-ray absorption spectra of glasses and reference compounds were measured at 295 K using the beamlines of BL03 (5–35 eV) and BL01C1 (6–33 keV), respectively, at Hsinchu National Synchrotron Radiation Research Centre (NSRRC). The XANES signals at the K-edge were very weak for lead borate glasses with TM ion concentration of 0.5 mol%, so that additional spectra were also recorded for 2 mol% Mo-doped lead borate glass. Comparison of the XANES spectra was performed after background subtraction and normalization.
3 Results and discussion
3.1 Spectral data of undoped base glasses
The spectral data for the undoped glasses have previously been presented9,10 and explained and the reader is referred to these reports. Basically, the borosilicate glass exhibits intense absorption at 298 nm and a broad emission band centred at 525 nm. The lead borate glass has strong absorption between 237 nm and 349 nm, with a broad emission peak at 470 nm.3.2 Niobium-doped sodium borosilicate glass
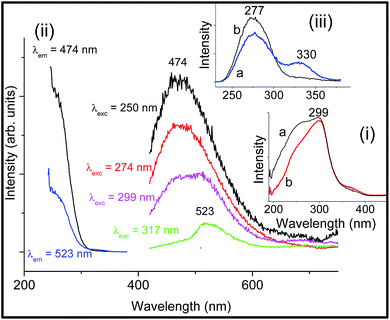
The closed-shell Nb5+ ion usually occupies octahedral sites in solids.11 The niobium-doped sodium borosilicate glass is colourless. The DRS of (0.5Nb2O5)0.5(SiO2)49.5(Na2O)25(B2O3)25 is shown as an inset (i) in Fig. 1 in comparison with that of the base glass (SiO2)50(Na2O)25(B2O3)25. The more intense absorption between 270–299 nm is associated with O2−–Nb5+ charge transfer. The room temperature excitation and emission spectra of the Nb-doped glass are also shown in Fig. 1(ii). The emission band centred at 523 nm is observed under excitation of 317 (or 330 nm, not shown) with an intensity comparable to that of the undoped sodium borosilicate glass, so that it corresponds to the glass matrix. Two emission bands are observed under excitation of 299 nm. The emission band centred at 474 nm is uniquely observed under excitation of 250 or 274 nm. Zeng et al.14 have reported that the charge transfer emission band of O2−–Nb5+ occurs at 480 nm in (Nb2O5)1(SiO2)69(Na2O)20(CaO)10 glass under 250 nm and 267 nm excitation, which is therefore similar to our observation. Fig. 1(iii) shows more clearly the absolute intensities in the excitation spectra when monitoring the 523 nm (a) and 474 nm (b) emissions. The maximum of the O2− → Nb5+ charge transfer absorption is observed at 277 nm. No visible emission was observed under excitation by an 800 nm diode laser at 600 mW power.3.3 Tantalum-doped sodium borosilicate glass
Tantalum produces no colour in sodium borosilicate glass. The room temperature DRS of (0.5Ta2O5)0.5(SiO2)49.5(Na2O)25(B2O3)25 glass provides a spectrum completely coincidental with that of undoped sodium borosilicate glass, with a strong UV absorption located at 297 nm. Fig. 2 shows the room temperature excitation and emission spectra of the Ta-doped glass (0.5Ta2O5)0.5(SiO2)49.5(Na2O)25(B2O3)25. The emission band centred at 525 nm is observed under excitation of 317 nm, attributed to the host glass emission since the intensity is similar to that of the undoped sodium borosilicate glass. Emission at 420 nm is observed under excitation of 250 nm and is associated with the charge transfer transition of (TaO6)7−.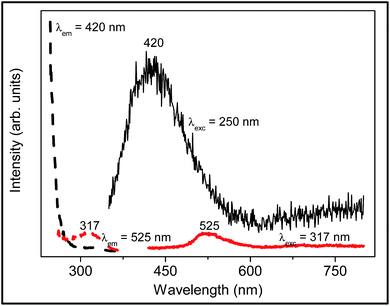 | ||
| Fig. 2 Room temperature excitation and emission spectra of the Ta-doped glass (0.5Ta2O5)0.5(SiO2)49.5(Na2O)25(B2O3)25. The peak maxima are marked in nm. | ||
3.4 Molybdenum-doped glasses
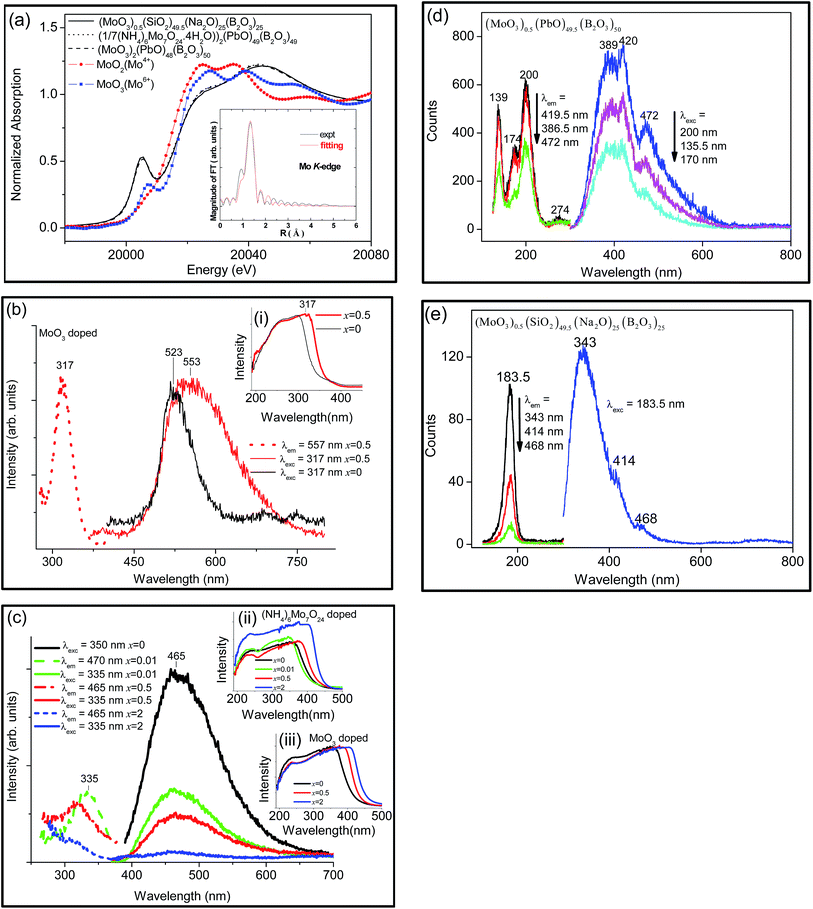
Molybdenum produces no colour in sodium borosilicate glass. The obtained Mo-doped lead borate glasses are colourless (x = 0.01) and pale yellow (x = 0.5) in colour. The Mo K-edge XANES of MoO3 and (NH4)6Mo7O24 doped into lead borate glass, and of MoO3 doped into sodium borosilicate glass are very similar, Fig. 3(a), and indicate the presence of Mo in the 6 + oxidation state from the pre-edge peak at 20![[thin space (1/6-em)]](https://www.rsc.org/images/entities/char_2009.gif) 005 eV. The pre-edge absorption is due to the 1s(Mo) → 4d(Mo) + 2p(O) electronic transition which is dipole forbidden in the case of Mo situated at an inversion centre, but gaining intensity for tetrahedral and distorted octahedral coordination via p–d wavefunction mixing. The large intensity of the pre-edge peak, different from the weak shoulders in the XANES of Mo-doped into phosphate glasses,31 thus suggests that tetrahedral [MoO4]2− units are present in the glasses. The EXAFS-k3 spectra are also very similar for the two glass samples, indicating similar Mo–O bond lengths and plots of Fourier transform magnitude k3χ(k) and distance exhibit two major peaks which could indicate distinct Mo–O distances (both spectra not shown) or scattering from another neighbour. Fitting of the Fourier transform spectra gives Mo–O bond distances of 1.774 Å and 1.761 Å for the lead borate glass and borosilicate glass (inset, Fig. 3(a)), respectively, which are shorter than for bridging molybdate groups or hexa-coordinated molybdenum. The Mo–O bond distances in XMoO4 (X = Ca, Sr) are 1.757 ± 0.005 Å and 1.766 ± 0.005 Å, respectively.32 These conclusions are in agreement with those from the study of Mo doped into nuclear glasses33 and PbO–Sb2O3–B2O3 glasses at low Mo concentration26 but differ from other reports of glasses where the existence of Mo5+ has been indicated34–36 and Mo3+ was found.37 However, firm evidence for the presence of Mo5+ species in addition to that of tetrahedral [MoO4]2− is included below.
005 eV. The pre-edge absorption is due to the 1s(Mo) → 4d(Mo) + 2p(O) electronic transition which is dipole forbidden in the case of Mo situated at an inversion centre, but gaining intensity for tetrahedral and distorted octahedral coordination via p–d wavefunction mixing. The large intensity of the pre-edge peak, different from the weak shoulders in the XANES of Mo-doped into phosphate glasses,31 thus suggests that tetrahedral [MoO4]2− units are present in the glasses. The EXAFS-k3 spectra are also very similar for the two glass samples, indicating similar Mo–O bond lengths and plots of Fourier transform magnitude k3χ(k) and distance exhibit two major peaks which could indicate distinct Mo–O distances (both spectra not shown) or scattering from another neighbour. Fitting of the Fourier transform spectra gives Mo–O bond distances of 1.774 Å and 1.761 Å for the lead borate glass and borosilicate glass (inset, Fig. 3(a)), respectively, which are shorter than for bridging molybdate groups or hexa-coordinated molybdenum. The Mo–O bond distances in XMoO4 (X = Ca, Sr) are 1.757 ± 0.005 Å and 1.766 ± 0.005 Å, respectively.32 These conclusions are in agreement with those from the study of Mo doped into nuclear glasses33 and PbO–Sb2O3–B2O3 glasses at low Mo concentration26 but differ from other reports of glasses where the existence of Mo5+ has been indicated34–36 and Mo3+ was found.37 However, firm evidence for the presence of Mo5+ species in addition to that of tetrahedral [MoO4]2− is included below.
Sodium borosilicate glass containing 0.5 mol% MoO3 reveals a prominent ultraviolet absorption band with the peak at 317 nm, and with no clear absorption bands in the visible spectral region, Fig. 3(b) inset (i). The slight red-shift of absorption edge from that of the base glass due to the addition of MoO3 may be ascribed to the charge transfer from O2− to Mo6+ ions.38,39 Lead borate glasses containing Mo in the progressive range from 0.01 mol% to 2 mol% also show a red-shift up to 400 nm, Fig. 3(c) inset (ii)–(iii). The presence of Mo3+ in (P2O5)55(Li2O)30(CaO)10(Al2O3)4.8(MoO3)0.2 glasses was made from the observation of a weak emission band at 850 nm (ref. 37) but this band is not observed from our samples, nor the absorption band of Mo5+ between 500–950 nm.40
Fig. 3(b) shows the broad visible emission band of (MoO3)0.5(SiO2)49.5(Na2O)25(B2O3)25 under ultraviolet excitation. The emission is assigned to the charge transfer t1 → 2e emission in the region between 500 and 590 nm of [MoO4]2−.11,41 Blasse11 reports the absence of emission from [MoO6]6− compounds.
Fig. 3(c) shows the corresponding emission and excitation spectra for Mo-doped lead borate glasses. The emission spectrum of PbMoO4 is sensitive to the synthesis conditions42 but the absence of an emission band at ∼520 nm shows that the molybdate tetrahedra are not linked to lead ions in the glass.43 Using excitation wavelengths in the range from 335 nm to 350 nm in Fig. 3(c), the emission arises from the glass matrix and it is quenched for higher molybdenum concentrations.
The Mo-doped lead borate glass was also investigated with synchrotron radiation excitation (Fig. 3(d)). The photoluminescence spectrum does not exhibit change with the different excitation lines and exhibits three peaks at 389, 420 and 472 nm. The excitation spectra of these emissions each display peaks at 139, 174 and 200 nm. The emission bands therefore correspond to the same species. The 183.5 nm-excited spectrum of the borosilicate glass doped with MoO3, Fig. 3(e), shows three analogous bands to those of the lead borate glass, but shifted and with different relative intensities. The excitation spectra of the emission bands produce only one feature, however, in contrast to Fig. 3(d).
It is clear that Fig. 3(d) and (e) differ considerably from the published absorption spectra of bulk or thin film-MoO3.44,45 However, it is noted that the emission spectra in Fig. 3(d) and (e) are similar to the emission spectrum of MoO3 nanoparticles deposited on thin films using 250 nm excitation, where three major peaks are observed at 343, 411 and 470 nm.46 The band gaps of the nanoparticles were between 3.2–3.6 eV, compared with that of bulk MoO3 (2.9 eV). The interpretation of the spectra (and structure) of MoO3 has not only received different viewpoints, but the spectra themselves differ considerably in literature publications. Blasse reported that bulk Mo6+ in tetrahedral α-MoO3 only shows very weak emission at 295 K, and at 4.2 K the maximum intensity of the broad band is at 750 nm.47 Otherwise the structure has been described as Mo5+ ions in distorted octahedral and other coordination environments, from electron spin resonance measurement.48 The spectra have been assigned to exciton traps, impurities, charge transfer and/or d-electron transitions. We interpret the spectra as due to the presence of 4d1 Mo5+ in a distorted octahedral environment arising from loss of oxygen (also found by electron spin resonance measurements49). The highest energy emission transition (at 343, 389 nm in Fig. 3(d) and (e), respectively) is then assigned to the maximum of the 2E → 2T2(1) transition (where 1 represents the electronic ground state level), whereas the other two bands may correspond to the transitions to the higher-energy crystal field states of 2T2. The value of 10 Dq is then about 23![[thin space (1/6-em)]](https://www.rsc.org/images/entities/char_2009.gif) 000–25
000–25![[thin space (1/6-em)]](https://www.rsc.org/images/entities/char_2009.gif) 000 cm−1. The features in the excitation spectrum may correspond to higher terms of 4d1 such as 2S1/2 and 2PJ.
000 cm−1. The features in the excitation spectrum may correspond to higher terms of 4d1 such as 2S1/2 and 2PJ.
3.5 Tungsten-doped glasses
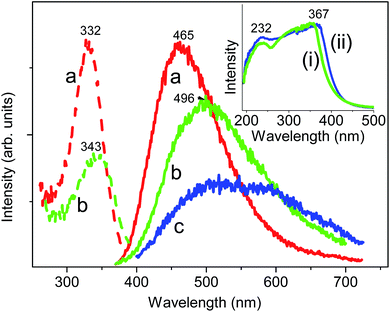
Tungsten produces no colour in sodium borosilicate glass. The DRS of (WO3)0.5(SiO2)49.5(Na2O)25(B2O3)25 reveals a strong absorption peak at 300 nm but no visible absorption band. The (Na2WO4·2H2O)x(PbO)50−x(B2O3)50 glass is colourless when x = 0.01 and pale yellow in colour when x = 0.5. The DRS of these glasses all exhibit a UV absorption peak between 232–367 nm (inset, Fig. 4). Blue tungsten glass,18,50 as in (WO3)x(PbO)50(P2O5)50 (x = 0, 0.01, 0.05, 0.5, 2.5, 5) contains W5+ ions,51 which have an absorption band at ∼780 nm. Our results therefore indicate the existence of mainly W6+ in the studied glasses.The room temperature emission spectrum of (WO3)0.5(SiO2)49.5(Na2O)25(B2O3)25 exhibits a broader and stronger emission band at 520 nm under excitation at 300 nm, than for the undoped glass. The emission band centred at 465 nm under excitation of 330 nm for the (Na2WO4·2H2O)x(PbO)50−x(B2O3)50 (x = 0.01) glass broadens and moves to lower energy as x increases up to 2 (Fig. 4(a)–(c)). Recently, Dong et al.21 investigated the blue emission at 468 nm from (W2O5)0.5(Na2O)20(CaO)15(SiO2)65 glass with either the irradiation of an 800 nm femtosecond laser or using 256 nm monochromatic light, and they ascribed this emission to the charge transfer between the O2− and W6+ ions in the WO42− tetrahedron. Blasse52 has noted that the emission from isolated tungstate groups is quenched at room temperature, although clusters emit more efficiently, and that any observed emission is related to the presence of defect centres. The weak, broad emission band between 400–700 nm in Fig. 4(c) presumably arises from one of these two reasons but the attribution is unclear. Abdelghany and co-workers have studied various W-doped glasses with or without the action of ionizing radiation53–55 and have interpreted the presence of W5+ and W6+ ions.
From literature data for MWO4 compounds (M = Mg, Ca, Sr, Ba, Pb) a reasonably linear fit (R2adj = 0.9560, N = 5) is obtained for our plot of charge transfer emission band maximum (between 420–470 nm) against cation crystal radius (not shown).
3.6 Rhenium-doped glasses
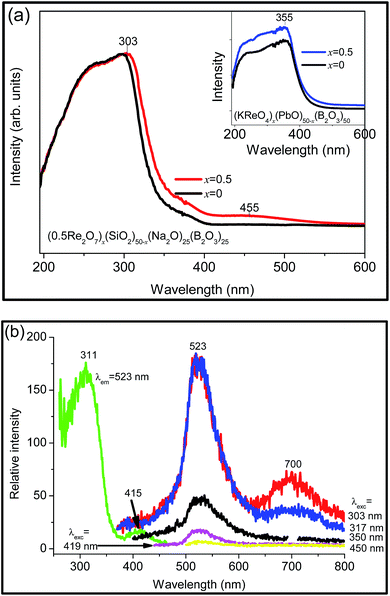
It was determined from vibrational spectroscopy56 that rhenium is present in borosilicate glasses as ReO4−. Hence due to the absence of d–d transitions, and the high energy of the O2− → Re7+ charge transfer transition,57 it was not unexpected that doping Re2O7 produces no colour in sodium borosilicate glass. The Re-doped lead borate glass is pale yellow in colour when x = 0.01 and 0.5. Re-doped sodium borosilicate glass shows (Fig. 5(a)) an intense UV absorption peak at 303 nm followed by an unresolved weak band at ∼455 nm, and a slightly red-shifted absorption edge. The weak feature at 455 nm presumably corresponds to absorption by a trace of another oxidation state of rhenium. The +6 state exhibits a charge transfer band in this region and the +4 state exhibits the 2A2 → 4T2 absorption band. The x = 0.5 Re-doped lead borate glass reveals a stronger UV absorption band peaking at 355 nm (Fig. 5(a) inset). The spectra are therefore similar to those of the undoped glasses so that unequivocal assignments of oxidation states other than +7 are not possible from the room temperature absorption spectra.The excitation and emission spectra of the Re-doped borosilicate glass are shown in Fig. 5(b), with the emission band at 523 nm coming from the glass host. A near infrared band with maximum intensity at 700 nm is also observed under 303 nm and 317 nm excitation which is assigned to the 2T2 → 2A2 transition of Re4+.58
3.7 Ruthenium-doped sodium borosilicate glass
The Ru-doped sodium borosilicate glass is intense yellow. Black needle-shaped dispersed precipitates were apparent with the addition of 0.5 mol% RuCl3 in sodium borosilicate glass, indicating the excess amount of RuO2 dispersed in the studied glass, as identified previously.59,60 The glass reveals a strong UV absorption progressively increasing up to a maximum at 438 nm and a shoulder at ∼500 nm, together with a strong absorption peak centred at 711 nm (Fig. 6). The 438 nm band is due to tetrahedrally-coordinated hexavalent ruthenium, Ru6+, and appears at 465 nm in silicate glasses and at 455 nm in phosphate glasses and was assigned to a mixture of ligand and charge transfer band transitions.28 The shoulder at 500 nm may be due to trivalent ruthenium, Ru3+, assigned to the 2T2 → 2A2 transition.28,61 The absorption band located at 711 nm in Ru-doped sodium borosilicate glass is due to a spin-allowed transition of tetravalent ruthenium, Ru4+.28,62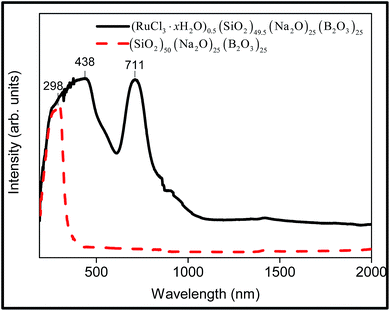 | ||
| Fig. 6 Room temperature DRS of the Ru-doped glass (RuCl3·xH2O)0.5(SiO2)49.5(Na2O)25(B2O3)25 and comparison with the undoped glass (SiO2)50(Na2O)25(B2O3)25. | ||
According to Mukerji,28 the amount of Na2O in glasses determines the valence states of ruthenium. In silicate glasses with <25 mol% Na2O, ruthenium is present mainly in octahedral coordination since Ru4+ and Ru3+ are both octahedrally coordinated; silicate glass with >25 mol% Na2O favours tetrahedrally coordinated ruthenium Ru6+.28 Thus, in the case of 25 mol% Na2O in the studied silicate glass, octahedral Ru4+ is present together with octahedrally coordinated Ru3+, and tetrahedrally coordinated Ru6+.
3.8 Rhodium-doped glasses
Rh(III) and Ir(III) both belong to the d6 electron configuration. In octahedral environments, both have a t62g ground state configuration (1A1g), and low-lying states 3T1g,2g and 1T1g,2g of the t52ge1g configuration. The Rh-doped sodium borosilicate glass is grey in colour with turbidity. The transparent Rh-doped lead borate glass is yellow and intense yellow in colour when x = 0.01 and 0.5, respectively, with small black scattering particles dispersed in the 0.5% Rh doped lead borate glass. Rh-doped sodium borosilicate glass reveals two absorption bands centred at 297 nm and 449 nm, together with progressive medium absorption in the range of 600–2000 nm (Fig. 7, lower). According to the spectral data of other rhodium(III) doped borate and silicate glasses29 and by using the Tanabe–Sugano diagrams for the d6 octahedral system,63 the absorption band at 297 nm can be ascribed to 1A1 → 1T2, and at 449 nm to 1A1 → 1T1 spin-allowed transitions of rhodium(III) in an octahedral environment.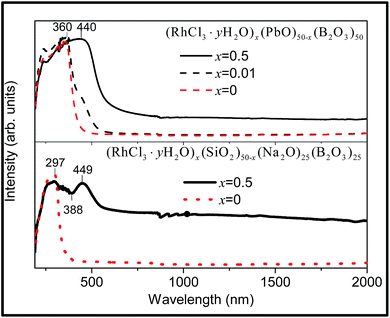 | ||
| Fig. 7 Room temperature DRS of the Rh-doped glass (RhCl3·yH2O)x(SiO2)50−x(Na2O)25(B2O3)25 (x = 0, 0.5) (lower) and (RhCl3·yH2O)x(PbO)50−x(B2O3)50 (x = 0.5, 0.01, 0) (upper). | ||
Rh-doped lead borate glass with x = 0.01 reveals a strong UV absorption with maximum at 360 nm, and a shoulder at 440 nm (Fig. 7, upper). Both the borosilicate and lead borate glasses exhibit a very broad absorption from 600–2000 nm for x = 0.5. The singlet–triplet transitions 1A1 → 3T1,2 occur in this wavelength range but the extreme breadth observed in Fig. 7 suggests the presence of charge transfer transitions of Rh and/or metal–metal charge transfer with Pb2+. For example, rhodium and iridium metal oxide nanoparticles deposited on a layered niobate support were found to transfer d-electron density to niobate ions.64
3.9 Iridium-doped glasses
The Ir-doped sodium borosilicate glass is deep grey in colour, revealing a strong UV absorption followed by progressive absorption up to 2000 nm (Fig. 8 lower spectrum). The Ir-doped lead borate glass is yellow and black in colour when x = 0.01 and 0.5, respectively. The spectrum of the sample with lower concentration shows a strong UV absorption and a shoulder at 450 nm, with an extension of the absorption to 2000 nm in the sample with higher concentration of Ir (Fig. 8, upper spectrum). The shoulder at 450 nm can be associated with the Ir3+ 1A1 → 1T1 transition in an oxygen-coordinated octahedral environment and the analogous spin- allowed, spin-forbidden and charge transfer transitions to those of Rh present the continuous absorption in the visible and infrared spectral regions.65 Ion pair charge transfer has been reported for the Ir–Pb–O system.66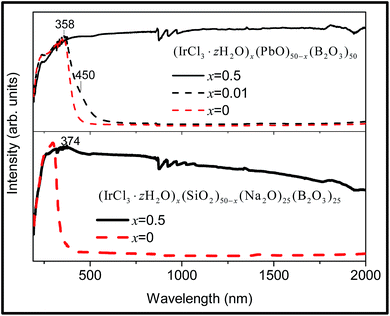 | ||
| Fig. 8 Room temperature DRS of the Ir-doped glass (IrCl3·zH2O)x(SiO2)50−x(Na2O)25(B2O3)25 (x = 0, 0.5) (lower), and (IrCl3·zH2O)x(PbO)50−x(B2O3)50 (x = 0, 0.01, 0.5) (upper). | ||
4 Conclusions
The study of doped glasses currently attracts attention in solar energy conversion and some new concepts and techniques have recently been suggested.67–71 The vision of the present study is to utilize intense charge transfer absorption bands of TM ions for solar light absorption with the consequent efficient energy transfer to co-doped lanthanide ions with the downshifted emission at an energy appropriate for a solar cell. Herein, the first step in this direction has required the experimental investigation of TM ion-doped glasses and the interpretation of the spectra obtained. Charge transfer emission bands have been observed for Nb, Ta and Mo-doped glasses. Since these glasses also possess strong charge transfer absorption bands, the energy harvesting and transfer to co-doped lanthanide ions, namely Eu3+, Tb3+ and Yb3+ appears to be promising.The major conclusions from this study concern the oxidation states of the species doped into the glasses. The X-ray absorption near edge spectra of Mo-doped glasses indicate that tetrahedral Mo(VI) exists in the studied lead borate or sodium borosilicate glasses. The oxidation states revealed from the diffuse reflectance spectra, absorption spectra, excitation and emission spectra of the glasses are Nb(V), Ta(V), Mo(V, VI), W(VI), Re(IV,VII), Ru(III, IV, VI), Rh(III), and Ir(III). The Ru, Rh and Ir ion-doped glasses show distinctive strong absorption bands and red-shifted absorption edges.
The use of synchrotron radiation for higher energy excitation of the Mo-doped glass has enabled additional information concerning the presence of oxidation states to be obtained, other than that from XANES and optical spectroscopy.
Acknowledgements
This work was supported by the Guangdong Natural Science Foundation (No. 2014A030310132) and Guangdong University Students Science and Technology Innovation Cultivation Special Fund (Grant No. pdjh2016b0153), Guangdong University of Technology through the One-Hundred Young Talents Program start-up grant (Grant No. 220413505) and Guangdong University of Technology University Students' Innovation and Entrepreneurship Training Program (Grant No. yj201611845021). We are indebted to Dr Ting Shan for recording the XANES at NSRRC, Hsinchu and for his useful comments.References
- X. Meng, S. Murai, K. Fujita and K. Tanaka, Appl. Phys. Lett., 2006, 89, 061914 CrossRef.
- M. Sayer and A. Mansingh, Phys. Rev. B: Solid State, 1972, 6, 4629 CrossRef CAS.
- A. Ghosh, J. Appl. Phys., 1988, 64, 2652 CrossRef CAS.
- J. Livage, J. P. Jolivet and E. Tronc, J. Non-Cryst. Solids, 1990, 121, 35 CrossRef CAS.
- Y. Sakurai and J. Yamaki, J. Electrochem. Soc., 1985, 132, 512 CrossRef CAS.
- N. J. Kreidl, J. Non-Cryst. Solids, 1990, 123, 377 CrossRef CAS.
- J. E. Shelby, Introduction to Glass Science and Technology, Royal Society of Chemistry, Cambridge, 2nd edn, 2005 Search PubMed.
- J. Wong and C. A. Angell, Glass: Structure by Spectroscopy, Marcel Dekker Inc., New York, 1976 Search PubMed.
- H. Wen and P. A. Tanner, J. Alloys Compd., 2015, 625, 328 CrossRef CAS.
- H. Wen, P. A. Tanner and B.-M. Cheng, Mater. Res. Bull., 2016, 83, 400 CrossRef CAS.
- G. Blasse, The luminescence of closed-shell transition-metal complexes, in Structure and Bonding, Springer, Berlin, Heidelberg, 1980, vol. 42, pp. 1–41 Search PubMed.
- Y. Takahashi, K. Kitamura, N. Iyi and S. Inoue, Appl. Phys. Lett., 2006, 88, 151903 CrossRef.
- S. H. Shin, D. Y. Jeon and K. S. Suh, J. Appl. Phys., 2001, 90, 5986 CrossRef CAS.
- H. Zeng, J. Song, D. Chen, S. Yuan, X. Jiang, Y. Cheng, Y. Yang and G. Chen, Opt. Express, 2008, 16, 6502 CrossRef CAS PubMed.
- P. D. Rack, M. D. Potter, S. Kurinec, W. Park, J. Penczek, B. K. Wagner and C. J. Summers, J. Appl. Phys., 1998, 84, 4466 CrossRef CAS.
- X. Meng, K. Tanaka, S. Murai, K. Fujita, K. Miura and K. Hirao, Opt. Lett., 2006, 31, 2867 CrossRef CAS PubMed.
- J. D. Lee, A New Concise Inorganic Chemistry, Van Nostrand Reinhold Co., New York, 3rd edn, 1977 Search PubMed.
- D. Boudlich, L. Bih, M. E. H. Archidi, M. Haddad, A. Yacoubi, A. Nadiri and B. Elouadi, J. Am. Ceram. Soc., 2002, 85, 623 CrossRef CAS.
- G. Poirier, F. C. Cassanjes, Y. Messaddeq, S. J. L. Ribeiro, A. Michalowicz and M. Poulain, J. Non-Cryst. Solids, 2005, 351, 3644 CrossRef CAS.
- G. Poirier, Y. Messaddeq, S. J. L. Ribeiro and M. Poulain, J. Solid State Chem., 2005, 178, 1533 CrossRef CAS.
- G. Dong, X. Xiao, B. Qian, J. Song, X. Liu, Q. Zhang, G. Lin, D. Chen and J. Qiu, J. Optoelectron. Adv. Mater., 2009, 11, 270 CAS.
- H. Negishi, S. Negishi, Y. Kuroiwa, N. Sato and S. Aoyagi, Phys. Rev. B: Condens. Matter Mater. Phys., 2004, 69, 064111 CrossRef.
- W. A. Weyl, Coloured Glasses, Dawson's of Pall Mall, London, 1959 Search PubMed.
- J. D. Mackenzie, Modern Aspects of the Vitreous State, Butterworths, London, 1960 Search PubMed.
- D. Boudlich, M. Haddad, A. Nadiri, R. Berger and J. Kliava, J. Non-Cryst. Solids, 1998, 224, 135 CrossRef CAS.
- M. S. Reddy, V. L. N. S. Raja and N. Veeraiah, Eur. Phys. J.: Appl. Phys., 2007, 37, 203 CrossRef CAS.
- P. S. Prasad, M. S. Reddy, V. R. Kumar and N. Veeraiah, Philos. Mag., 2007, 87, 5763 CrossRef CAS.
- J. Mukerji, Ind. Eng. Chem. Prod. Res. Dev., 1972, 11, 178 CAS.
- A. Paul and J. M. Parker, Phys. Chem. Glasses, 1975, 16, 103 CAS.
- S. C. Weaver and D. S. McClure, Inorg. Chem., 1992, 31, 2814 CrossRef CAS.
- A. Kuzmin and J. Purans, Proc. SPIE, 1997, 2968, 180 CrossRef CAS.
- E. Gürmen, E. Daniels and J. S. King, J. Chem. Phys., 1971, 55, 1093 CrossRef.
- G. Calas, M. Le Grand, L. Galoisy and D. Ghaleb, J. Nucl. Mater., 2003, 322, 15 CrossRef CAS.
- P. S. Prasad, B. V. Raghavaiah, R. B. Rao, C. Laxmikanth and N. Veeraiah, Solid State Commun., 2004, 132, 235 CrossRef CAS.
- S. M. Abo-Naf, J. Non-Cryst. Solids, 2012, 358, 406 CrossRef CAS.
- O. Cozar, D. A. Magdas and I. Ardelean, J. Optoelectron. Adv. Mater., 2007, 9, 1730 CAS.
- J. Fernández, A. Mendioroz, R. Balda, M. A. Arriandiaga and M. J. Weber, Phys. Rev. B: Condens. Matter Mater. Phys., 1995, 52, 181 CrossRef.
- V. A. Morozov, B. I. Lazoryak, S. Z. Shmurak, A. P. Kiselev, O. I. Lebedev, N. Gauquelin, J. Verbeeck, J. Hadermann and G. Van Tendeloo, Chem. Mater., 2014, 26, 3238 CrossRef CAS.
- M. Fournier, C. Louis, M. Che, P. Chaquin and D. Masure, J. Catal., 1989, 119, 400 CrossRef CAS.
- M. V. N. P. Rao, L. S. Rao, M. S. Reddy, V. R. Kumar and N. Veeraiah, Croat. Chem. Acta, 2009, 82, 747 CAS.
- Y. Hizhnyi, S. Nedilko, V. Chornii, T. Nikolaenko, I. Zatovsky, K. Terebilenko and R. Boiko, Solid State Phenom., 2013, 200, 114 CrossRef.
- M. Tyagi, S. D. G. Desai and S. C. Sabharwal, J. Lumin., 2008, 128, 22 CrossRef CAS.
- M. R. D. Bomio, L. S. Cavalcante, M. A. P. Almeida, R. L. Tranquilin, N. C. Batista, P. S. Pizani, M. S. Li, J. Andres and E. Longo, Polyhedron, 2013, 50, 532 CrossRef CAS.
- P.-R. Huang, Y. He, C. Cao and Z.-H. Lu, Sci. Rep., 2014, 4, 7131 CrossRef CAS PubMed.
- S. K. Deb and J. A. Chopoorian, J. Appl. Phys., 1966, 37, 4818 CrossRef CAS.
- I. Navas, R. Vinodkumar and V. P. M. Pillai, Appl. Phys. A, 2011, 103, 373 CrossRef CAS.
- G. Blasse and M. Wiegel, J. Alloys Compd., 1995, 224, 342 CrossRef CAS.
- S. Morandi, M. C. Paganini, E. Giamello, M. Bini, D. Capsoni, V. Massarotti and G. Ghiotti, J. Solid State Chem., 2009, 182, 3342 CrossRef CAS.
- M. Łabanowska, Phys. Chem. Chem. Phys., 1999, 1, 5385 RSC.
- C. R. Bamford, Colour Generation and Control in Glass, Elsevier Scientific Publishing Company, Elsevier North-Holland Inc., Amsterdam, New York, 1977 Search PubMed.
- F. H. ElBatal and S. Y. Marzouk, J. Mater. Sci., 2009, 44, 3061 CrossRef CAS.
- G. Blasse and G. J. Dirksen, J. Solid State Chem., 1981, 36, 124 CrossRef CAS.
- R. M. M. Morsi, A. M. Abdelghany and M. M. Morsi, J. Mater. Sci.: Mater. Electron., 2015, 26, 5120 CrossRef CAS.
- H. A. ElBatal, A. M. Abdelghany, F. H. ElBatal and F. M. EzzElDin, Mater. Chem. Phys., 2012, 134, 542 CrossRef CAS.
- A. M. Abdelghany and A. H. Hammad, J. Mol. Struct., 2015, 1081, 342 CrossRef CAS.
- P. L. Gassman, J. S. McCloy, C. Z. Soderquist and M. J. Schweiger, J. Raman Spectrosc., 2014, 45, 139 CrossRef CAS.
- J. F. H. Custers, Physica, 1937, 4, 426 CrossRef CAS.
- J. F. Suyver, A. Aebischer, D. Biner, P. Gerner, J. Grimm, S. Heer, K. W. Krämer, C. Reinhard and H. U. Güdel, Opt. Mater., 2005, 27, 1111 CrossRef CAS.
- S. R. Butler and J. L. Gillson, Mater. Res. Bull., 1971, 6, 81 CrossRef CAS.
- M. Yamashita, H. Yamanaka and K. Sasage, J. Am. Ceram. Soc., 2004, 87, 967 CrossRef CAS.
- C. J. Ballhausen, Introduction to Ligand Field Theory, McGraw-Hill, New York, 1962 Search PubMed.
- J. Mukerji and S. R. Biswas, Indian J. Chem., 1969, 7, 1239 CAS.
- Y. Tanabe and S. Sugano, J. Phys. Soc. Jpn., 1954, 9, 753 CrossRef CAS.
- M. E. Strayer, T. P. Senftle, J. P. Winterstein, N. M. Vargas-Barbosa, R. Sharma, R. M. Rioux, M. J. Janik and T. E. Mallouk, J. Am. Chem. Soc., 2015, 137, 16216 CrossRef CAS PubMed.
- B. Gilliams, L. Heerman and C. Görller-Walrand, J. Alloys Compd., 1997, 259, 153 CrossRef CAS.
- C. Mullens, M. Pikulski, S. Agachan and W. Gorski, J. Am. Chem. Soc., 2003, 125, 13602 CrossRef CAS PubMed.
- X. Huang, J. Alloys Compd., 2017, 690, 356 CrossRef CAS.
- P. Song, C. M. Zhang and P. F. Zhu, Ceram. Int., 2016, 42, 11417 CrossRef CAS.
- S. F. H. Correia, P. P. Lima, E. Pecoraro, S. J. L. Ribeiro, P. S. André, R. A. S. Ferreira and L. D. Carlos, Prog. Photovoltaics, 2016, 24, 1178 CAS.
- G. Lia, C. Zhang, P. Song, P. Zhu, K. Zhu and J. He, J. Alloys Compd., 2016, 662, 89 CrossRef.
- J. A. Jiménez and M. Sendova, Mater. Chem. Phys., 2015, 162, 425 CrossRef.
| This journal is © The Royal Society of Chemistry 2017 |

